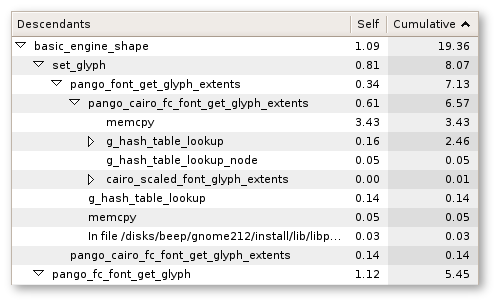
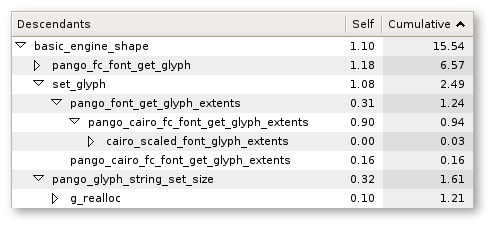
Sysprof is great, and the tree view UI makes it quick and easy to narrow down performance issues. The call stack information is invaluable, and being able to quickly sort the times is awesome.
OProfile, like sysprof, is a kernel-level profiler which I’ve been using for working on cairo. While it lacks sysprof’s UI, the command line interface can be handy, and the resulting data is very raw and believable.
You basically use it like this:
  # Clear the data from the last run first
  opcontrol --reset
  opcontrol --start
  # Run your benchmark here
  opcontrol --stop
The opcontrol commands are run as root, while the benchmark can run anywhere. OProfile gathers data for the entire system.
There are four commands I found useful for gathering information from OProfile. First, it can break down the samples by binary:
# opreport --threshold 4.0
  samples|      %|
------------------
   807298 38.1359 libpango-1.0.so.0.1001.0
   446257 21.0807 libc-2.3.5.so
   364723 17.2291 libglib-2.0.so.0.800.4
   148549  7.0173 libgobject-2.0.so.0.800.4
    92573  4.3731 libpangoft2-1.0.so.0.1001.0
You can then pick a library, and see the top hit symbols for that library:
# opreport --symbols --debug-info \
  --threshold 3.0 /.../libpango-1.0.so.0.1001.0
samples  %        linenr info         symbol name
151514   18.7680  pango-script.c:98   pango_script_for_unichar
81120    10.0483  break.c:447         pango_default_break
76167     9.4348  pango-script.c:214  get_pair_index
59039     7.3132  fribidi.c:516       fribidi_analyse_string
30140     3.7334  glyphstring.c:148   pango_glyph_string_extents_range
OProfile can even narrow down which parts of the code were hit in that symbol, although the measurements here are usually too small to be reliable:
# opreport --symbols --debug-info --threshold 1.0 \
    --details --include-symbols get_pair_index \
    /.../libpango-1.0.so.0.1001.0
vma      samples  %        linenr info         symbol name
0001a7b6 76167    100.000  pango-script.c:214  get_pair_index
0001a7b6 189       0.2481  pango-script.c:214
...
0001a7de 1093      1.4350  pango-script.c:220
0001a7e0 58535    76.8509  pango-script.c:222
0001a7e3 1121      1.4718  pango-script.c:222
...
OProfile can also generate annotated source code based on this information. The annotated code very visually shows which code paths get hit.
# opannotate --source --output-dir=/root/oprofile/source \
   /.../libpango-1.0.so.0.1001.0

  ...
               :static void
               :compact_list (TypeLink *list)
   341  0.0422 :{ /* compact_list total:   7755  0.9606 */
  2003  0.2481 :  if (list->next)
  1389  0.1721 :    for (list = list->next; list; list = list->next)
  2648  0.3280 :      if (RL_TYPE (list->prev) == RL_TYPE (list)
               :          && RL_LEVEL (list->prev) == RL_LEVEL (list))
   141  0.0175 :        list = merge_with_prev (list);
  1233  0.1527 :}
  ...
All of the data here is from a simple text measuring benchmark under pango 1.10.1. I had to build pango without inlining to show which functions were really doing the work. This slows the benchmark down, making it more difficult to evaluate changes. Only use the non-inlined results as a guide.
Steps to enlightenment:
- Run your benchmark a bunch of times, record timing information
- Compile without inlining (I used “-Wall -g -Os -fno-inline”)
- Run your benchmark and gather profiler output
- Make some performance-enhancing modifications and test them
- Run your benchmark and gather profiler output, estimate speedup
- Recompile with normal CFLAGS
- Run your benchmark a bunch of times, record timing information, compare with step 1
- Post the patch and brag about it in your blog