For the sake of formality, if you’re yet to read the [brief] introduction of my GSoC project, here you go.
Rendering Puzzles in GNOME Crosswords
GNOME Crosswords currently renders puzzles in two layers. The first is a grid of what we call the layout items: the grid cells, borders between cells and around the grid, and the intersections between borders. This is as illustrated below:
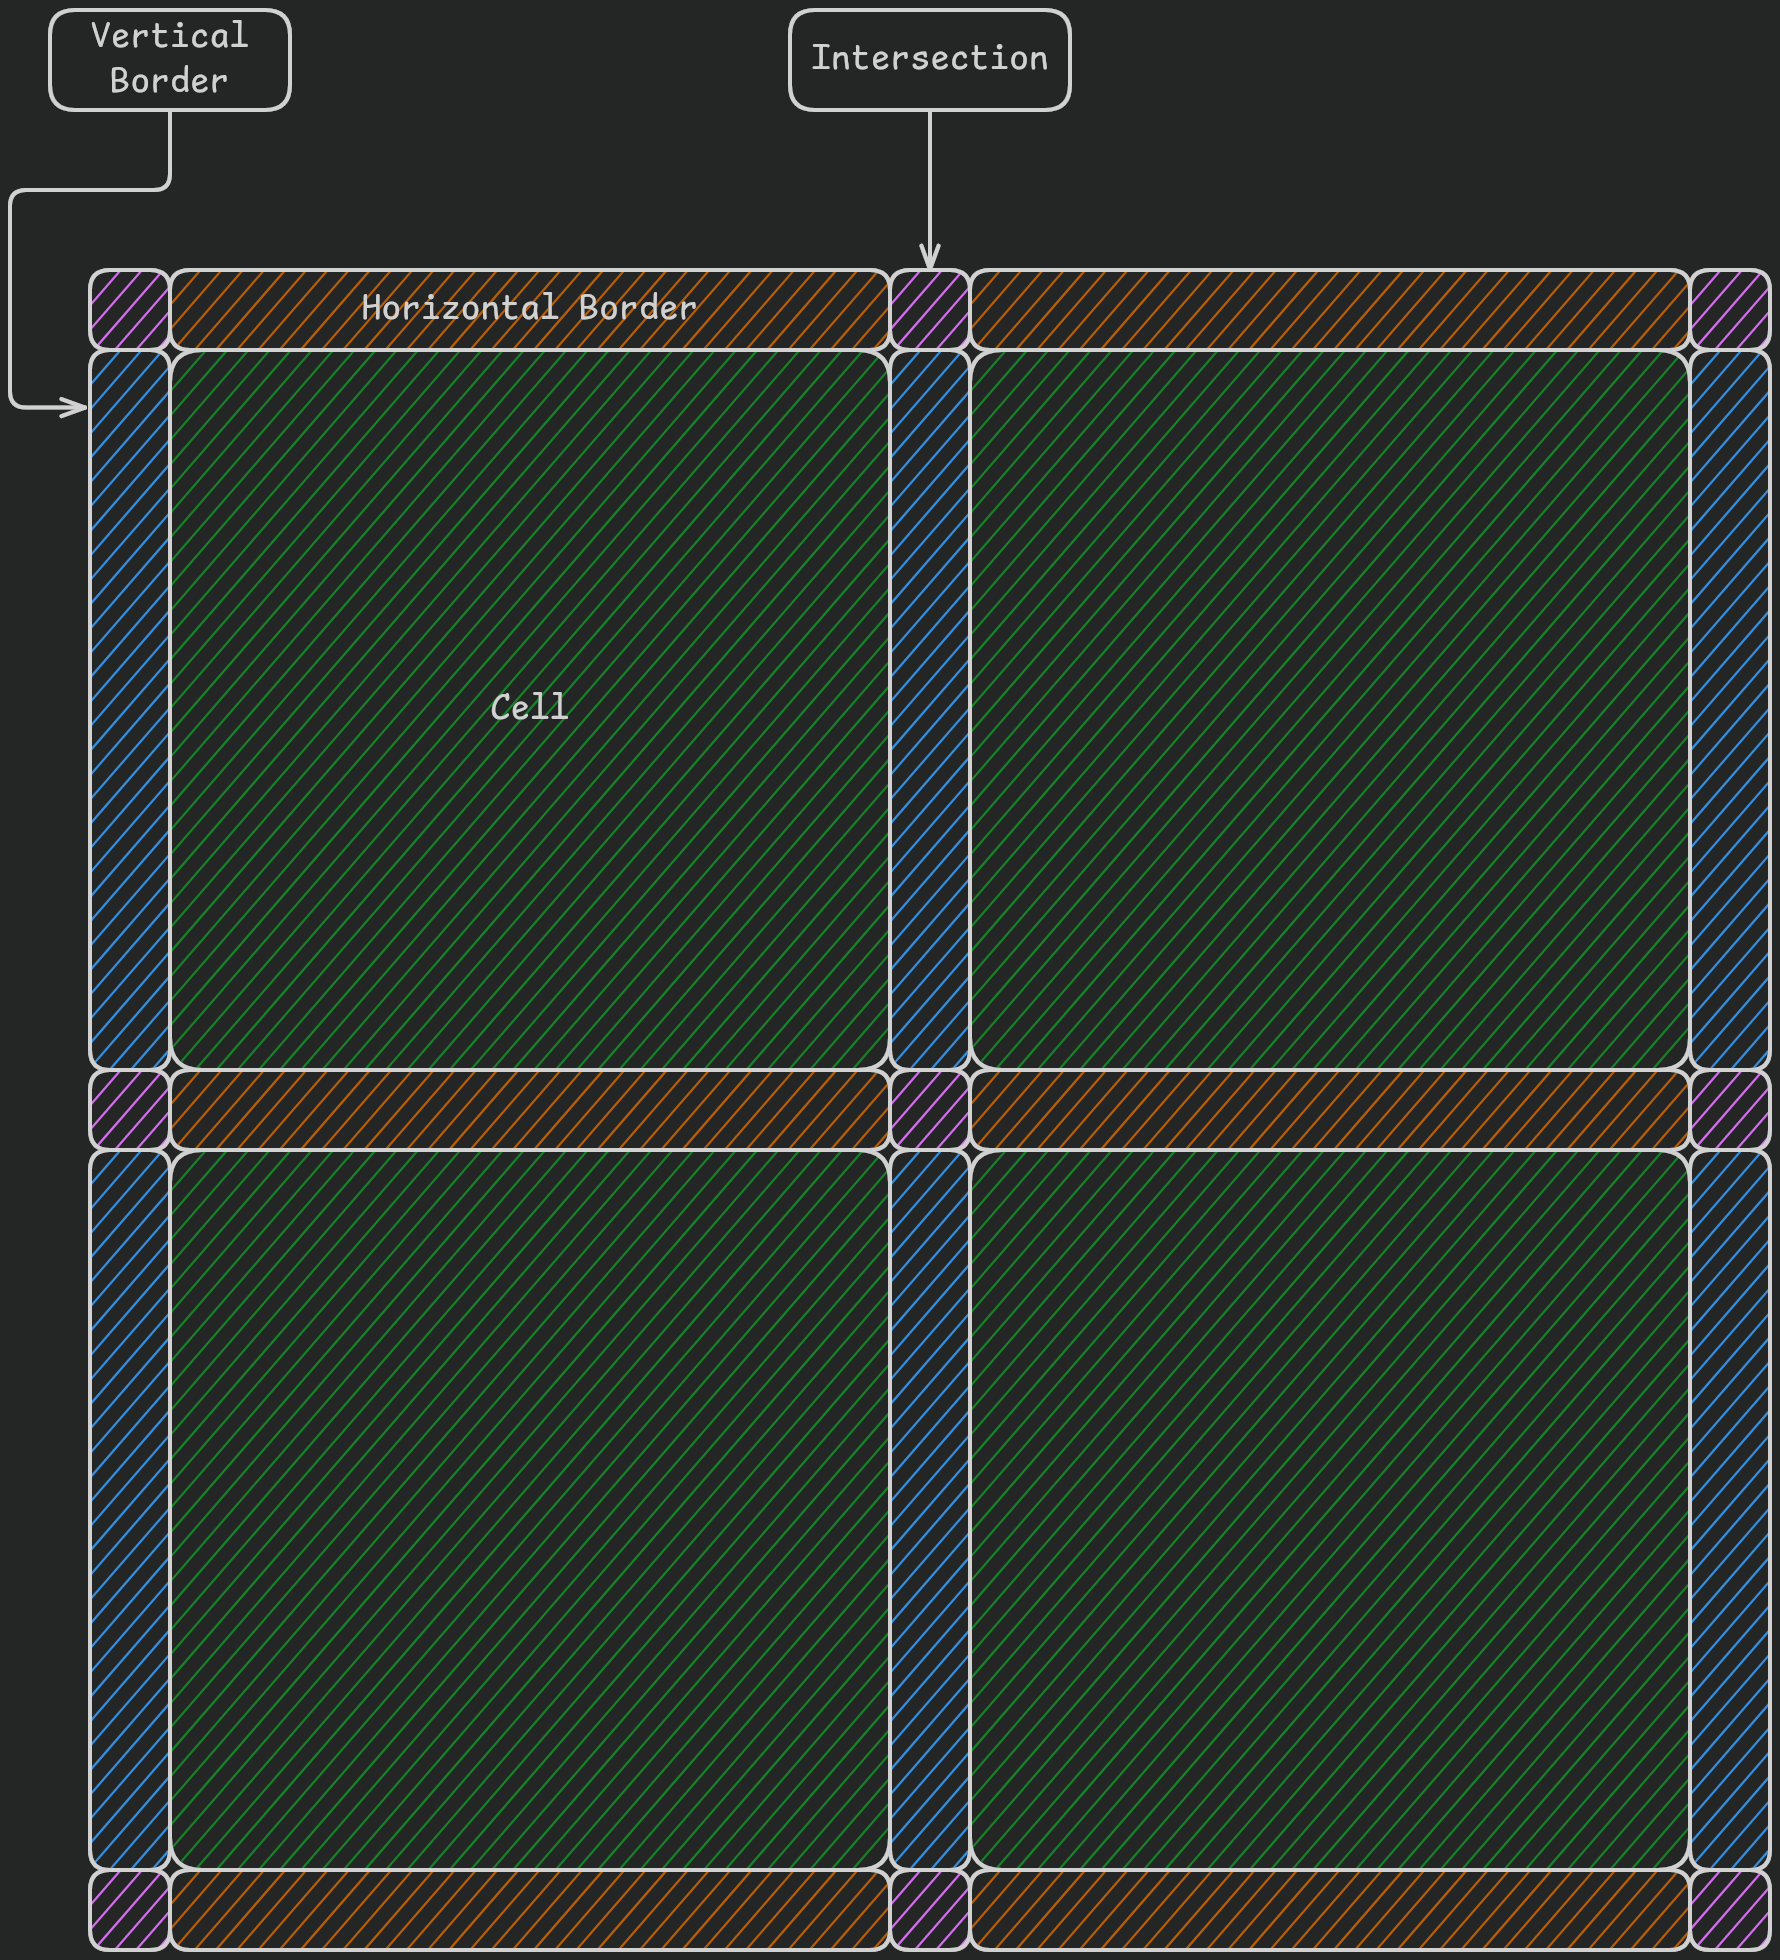
The game and editor implement this item grid using a set of custom Gtk widgets: PlayCell for the cells and PlayBorder for the borders and intersections, all contained and aligned in a grid layout within a PlayGrid widget. For instance, the simple.ipuz puzzle, with just its item grid, looks like this:

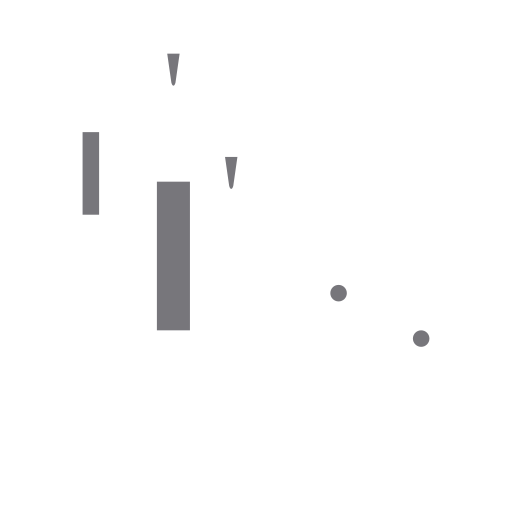
Then it renders another layer, of what we call the layout overlays, above the grid. Overlays are elements of a puzzle which do not exactly fit into the grid, such as barred borders, enumerations (for word breaks, hyphens, etc), cell dividers and arrows (for arrowword puzzles), amongst others. The fact that overlays do not fit into the grid layout makes it practically impossible to render them using widgets. Hence, the need for another layer, and the term “overlay”.
Overlays are currently implemented in the game and editor by generating an SVG and rendering it onto a GtkSnapshot of the PlayGrid using librsvg. The overlays for the same puzzle, the item grid of which is shown above, look like this:
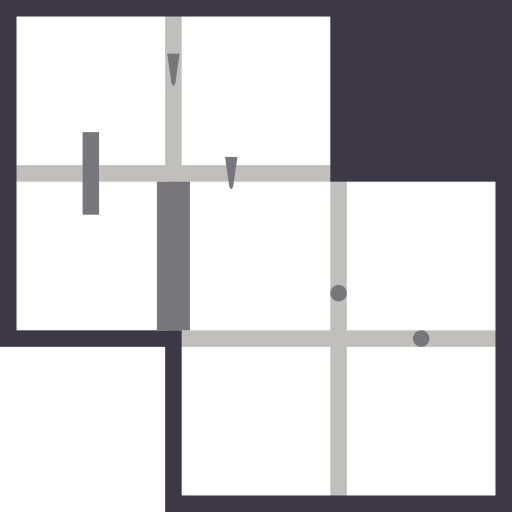
When laid over the item grid, they together look like this:
All these elements (items and overlays) and their various properties and styles are stored in a GridLayout instance, which encapsulates the appearance of a puzzle in a given state. Instances of this class can then be rendered into widgets, SVG, or any other kind of output.
The project’s main source includes svg.c, a source file containing code to generate an SVG string from a GridLayout. It provides a function to render overlays only, another for the entire layout, and a function to create an RsvgHandle from the generated SVG string.
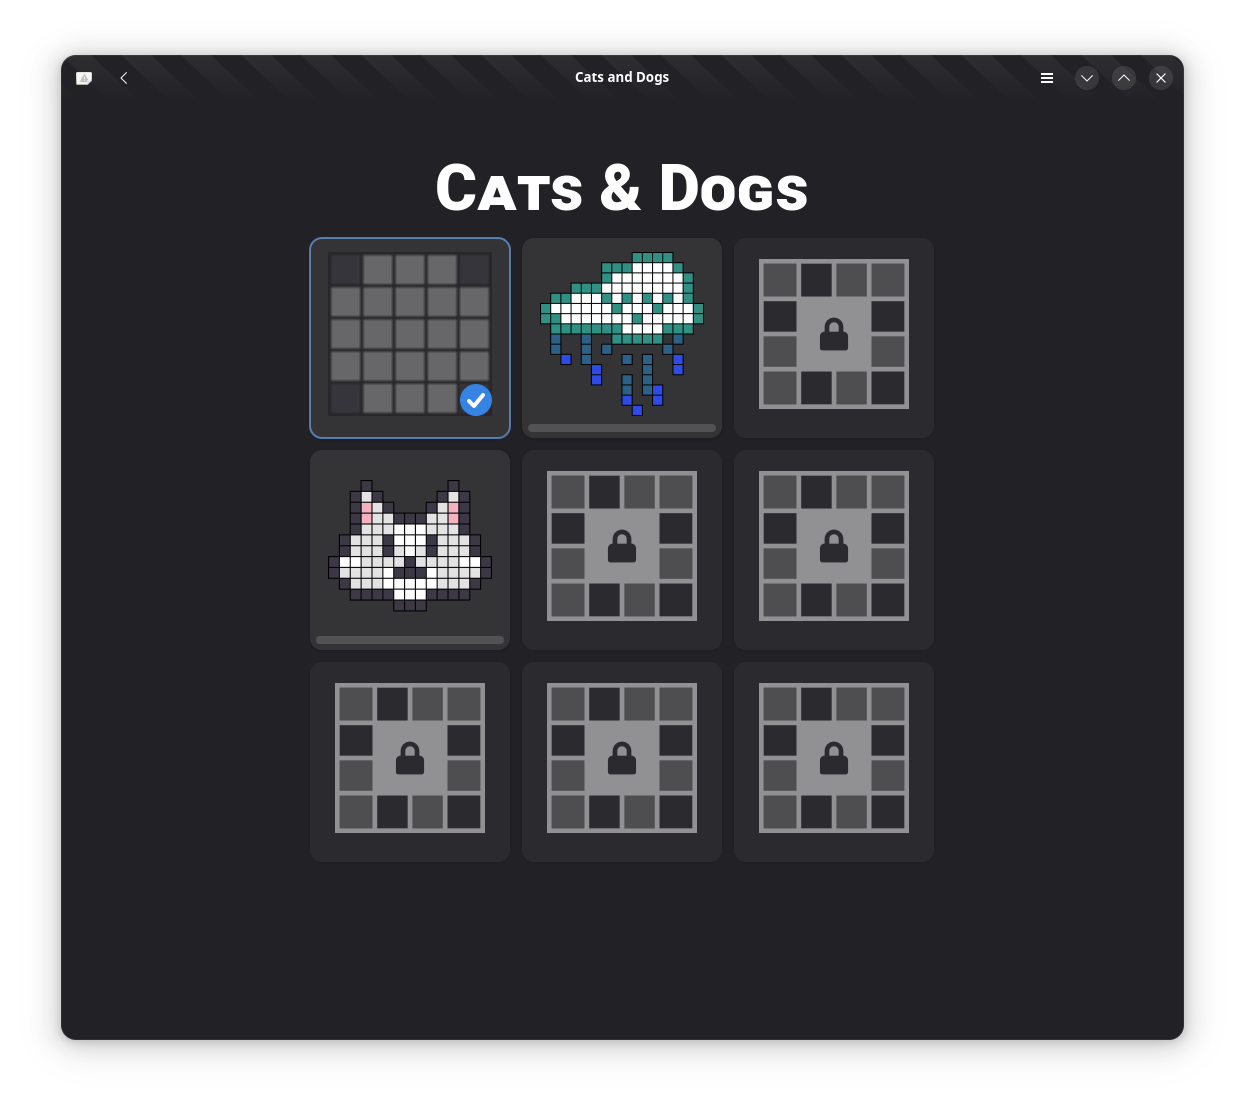
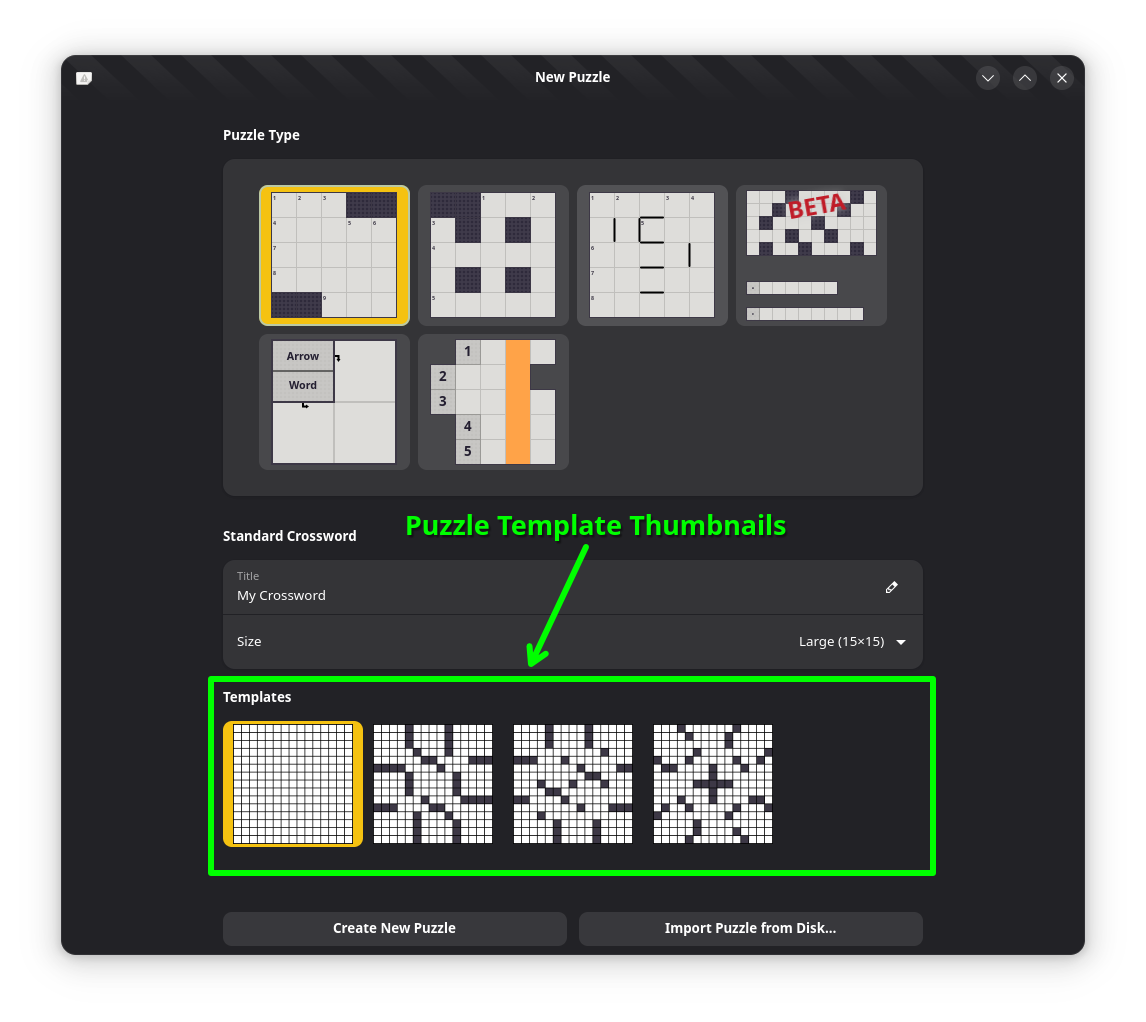
Crosswords, the game, uses the SVG code to display thumbnails of puzzles (though currently only for the Cats and Dogs puzzle set), and Crossword Editor displays thumbnails of puzzle templates in its greeter for users to create new puzzles from.
Other than the game and editor, puzzles are also rendered by the crosswords-thumbnailer utility. This renders an entire puzzle layout by generating an SVG string containing both the layout items and overlays, and rendering/writing it to a PNG or SVG file. There is also my GSoC project, which ultimately aims to add support for printing puzzles in the game and editor.
The Problem
Whenever a sizeable, yet practical number of puzzles are to be displayed at the same time, or in quick succession, there is a noticeable lag in the user interface resulting from the rendering of thumbnails. In other words, thumbnails take too long to render!
There are also ongoing efforts to add thumbnails to the list view in the game, for every puzzle, but the current rendering facility just can’t cut it. As for printing, this doesn’t really affect it since it’s not particularly a performance-critical operation.
The Task
My task was to profile the puzzle rendering pipeline to determine what the bottleneck(s) was/were. We would later use this information to determine the way forward, whether it be optimising the slow stages of the pipeline, replacing them or eliminating them altogether.
The Rendering Pipeline
The following is an outline of the main/top-level stages involved in rendering a puzzle from an IPUZ file to an image (say, an in-memory image buffer):
- ipuz_puzzle_from_file(): parses a file in the IPUZ format and returns an
IpuzPuzzleobject representing the puzzle. - grid_state_new(): creates a
GridStateinstance which represents the state of a puzzle grid at a particular instant, and contains a reference to theIpuzPuzzleobject. This class is at the core of Crosswords and is pretty quick to instantiate. - grid_layout_new(): creates a
GridLayoutinstance (as earlier described) from theGridState. - svg_from_layout(): generates an SVG string from the
GridLayout. - svg_handle_from_string(): creates an
RsvgHandle(from librsvg) from the generated SVG string and sets a stylesheet on the handle, defining the colours of layout items and overlays. - rsvg_handle_render_document(): renders the generated SVG onto a Cairo surface (say, an image surface, which is essentially an image buffer), via a Cairo context.
Profiling
To profile the rendering pipeline specifically, I wrote up a little program to fit my purposes, which can be found here (puzzle-render-profiler.c).
The Attempt with Sysprof
Initially, I used Sysprof, executing the profiler program under it. Unfortunately, because Sysprof is a sampling profiler and probably also due to its system-wide nature, the results weren’t satisfactory. Also, the functions of interest aren’t long-running functions and each run only once per execution. So the results weren’t accurate enough and somewhat incomplete (missed many nested calls).
Don’t get me wrong, Sysprof has its strengths and stands strong amongst profilers of its kind. I tried a couple of others, and Sysprof is the only one even worthy of mention here. Most importantly, I’m glad I got to use and explore Sysprof. The next time I use it won’t be my first!
Using Callgrind
Callgrind + QCachegrind is sincerely such a godsend!
Callgrind is a profiling tool that records the call history among functions in a program’s run as a call-graph. By default, the collected data consists of the number of instructions executed, their relationship to source lines, the caller/callee relationship between functions, and the numbers of such calls.
QCachegrind is a GUI to visualise profiling data. It’s mainly used as a visualisation frontend for data measured by Cachegrind/Callgrind tools from the Valgrind package.
After a short while of reading through Callgrind’s manual, I pieced together the combination of options (not much at all) that I needed for the task, and the rest is a story of exploration, learning and excitement. With the following command line, I was all set.
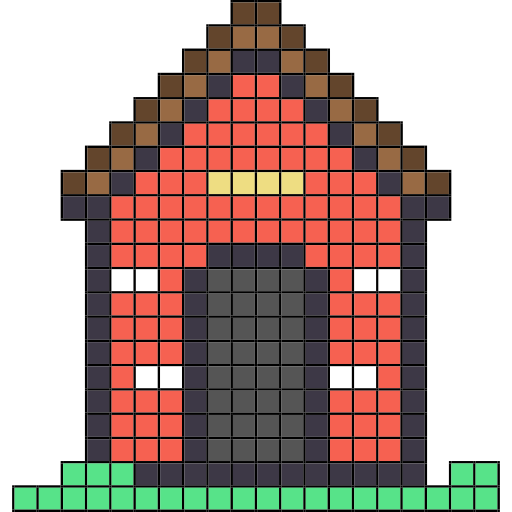
valgrind --tool=callgrind --toggle-collect=render_puzzle ./profiler puzzles/puzzle-sets/cats-and-dogs/doghouse.ipuzwhere:
valgrindis the Valgrind.--tool=callgrindselects the Callgrind tool to be run.--toggle-collect=render_puzzlesetsrender_puzzle, the core function in the profiler program, as the target for Callgrind’s data collection../profileris a symlink to the executable of the profiler program.puzzles/puzzle-sets/cats-and-dogs/doghouse.ipuzis a considerably large puzzle.
I visualised Callgrind’s output in QCachegrind, which is pretty intuitive to use. My focus is the Call Graph feature, which helps to graphically and interactively analyse the profile data. The graph can also be exported as an image or DOT (a graph description format in the Graphviz language) file. The following is a top-level view of the result of the profile run.
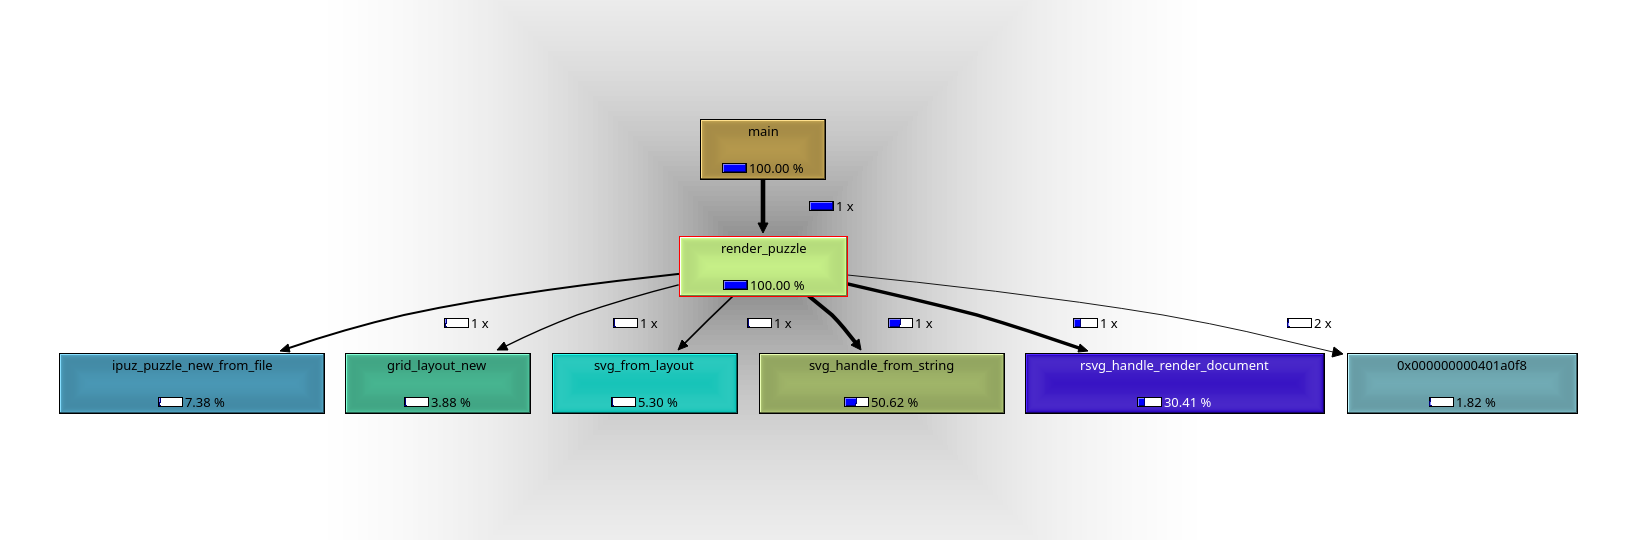
Note that Callgrind measures the number of instructions executed, not exactly execution time, but typically, the former translates proportionally to the latter. The percentages shown in the graph are instruction ratios, i.e the ratio of instructions executed within each function (and its callees) to the total number of instructions executed (within the portions of the program where data was collected).
This graph shows that loading the generated SVG (svg_handle_from_string) takes up the highest percentage of time, followed by rendering the SVG (rsvg_handle_render_document). Note that the SVG is simply being rendered to an image buffer, so no encoding, compression, or IO is taking place. The call with the HEX number, instead of a name, simply calls g_object_unref, under which dropping the rsvg::document::Document (owned by the RsvgHandle) takes the highest percentage. Probing further into svg_handle_from_string and rsvg_handle_render_document:
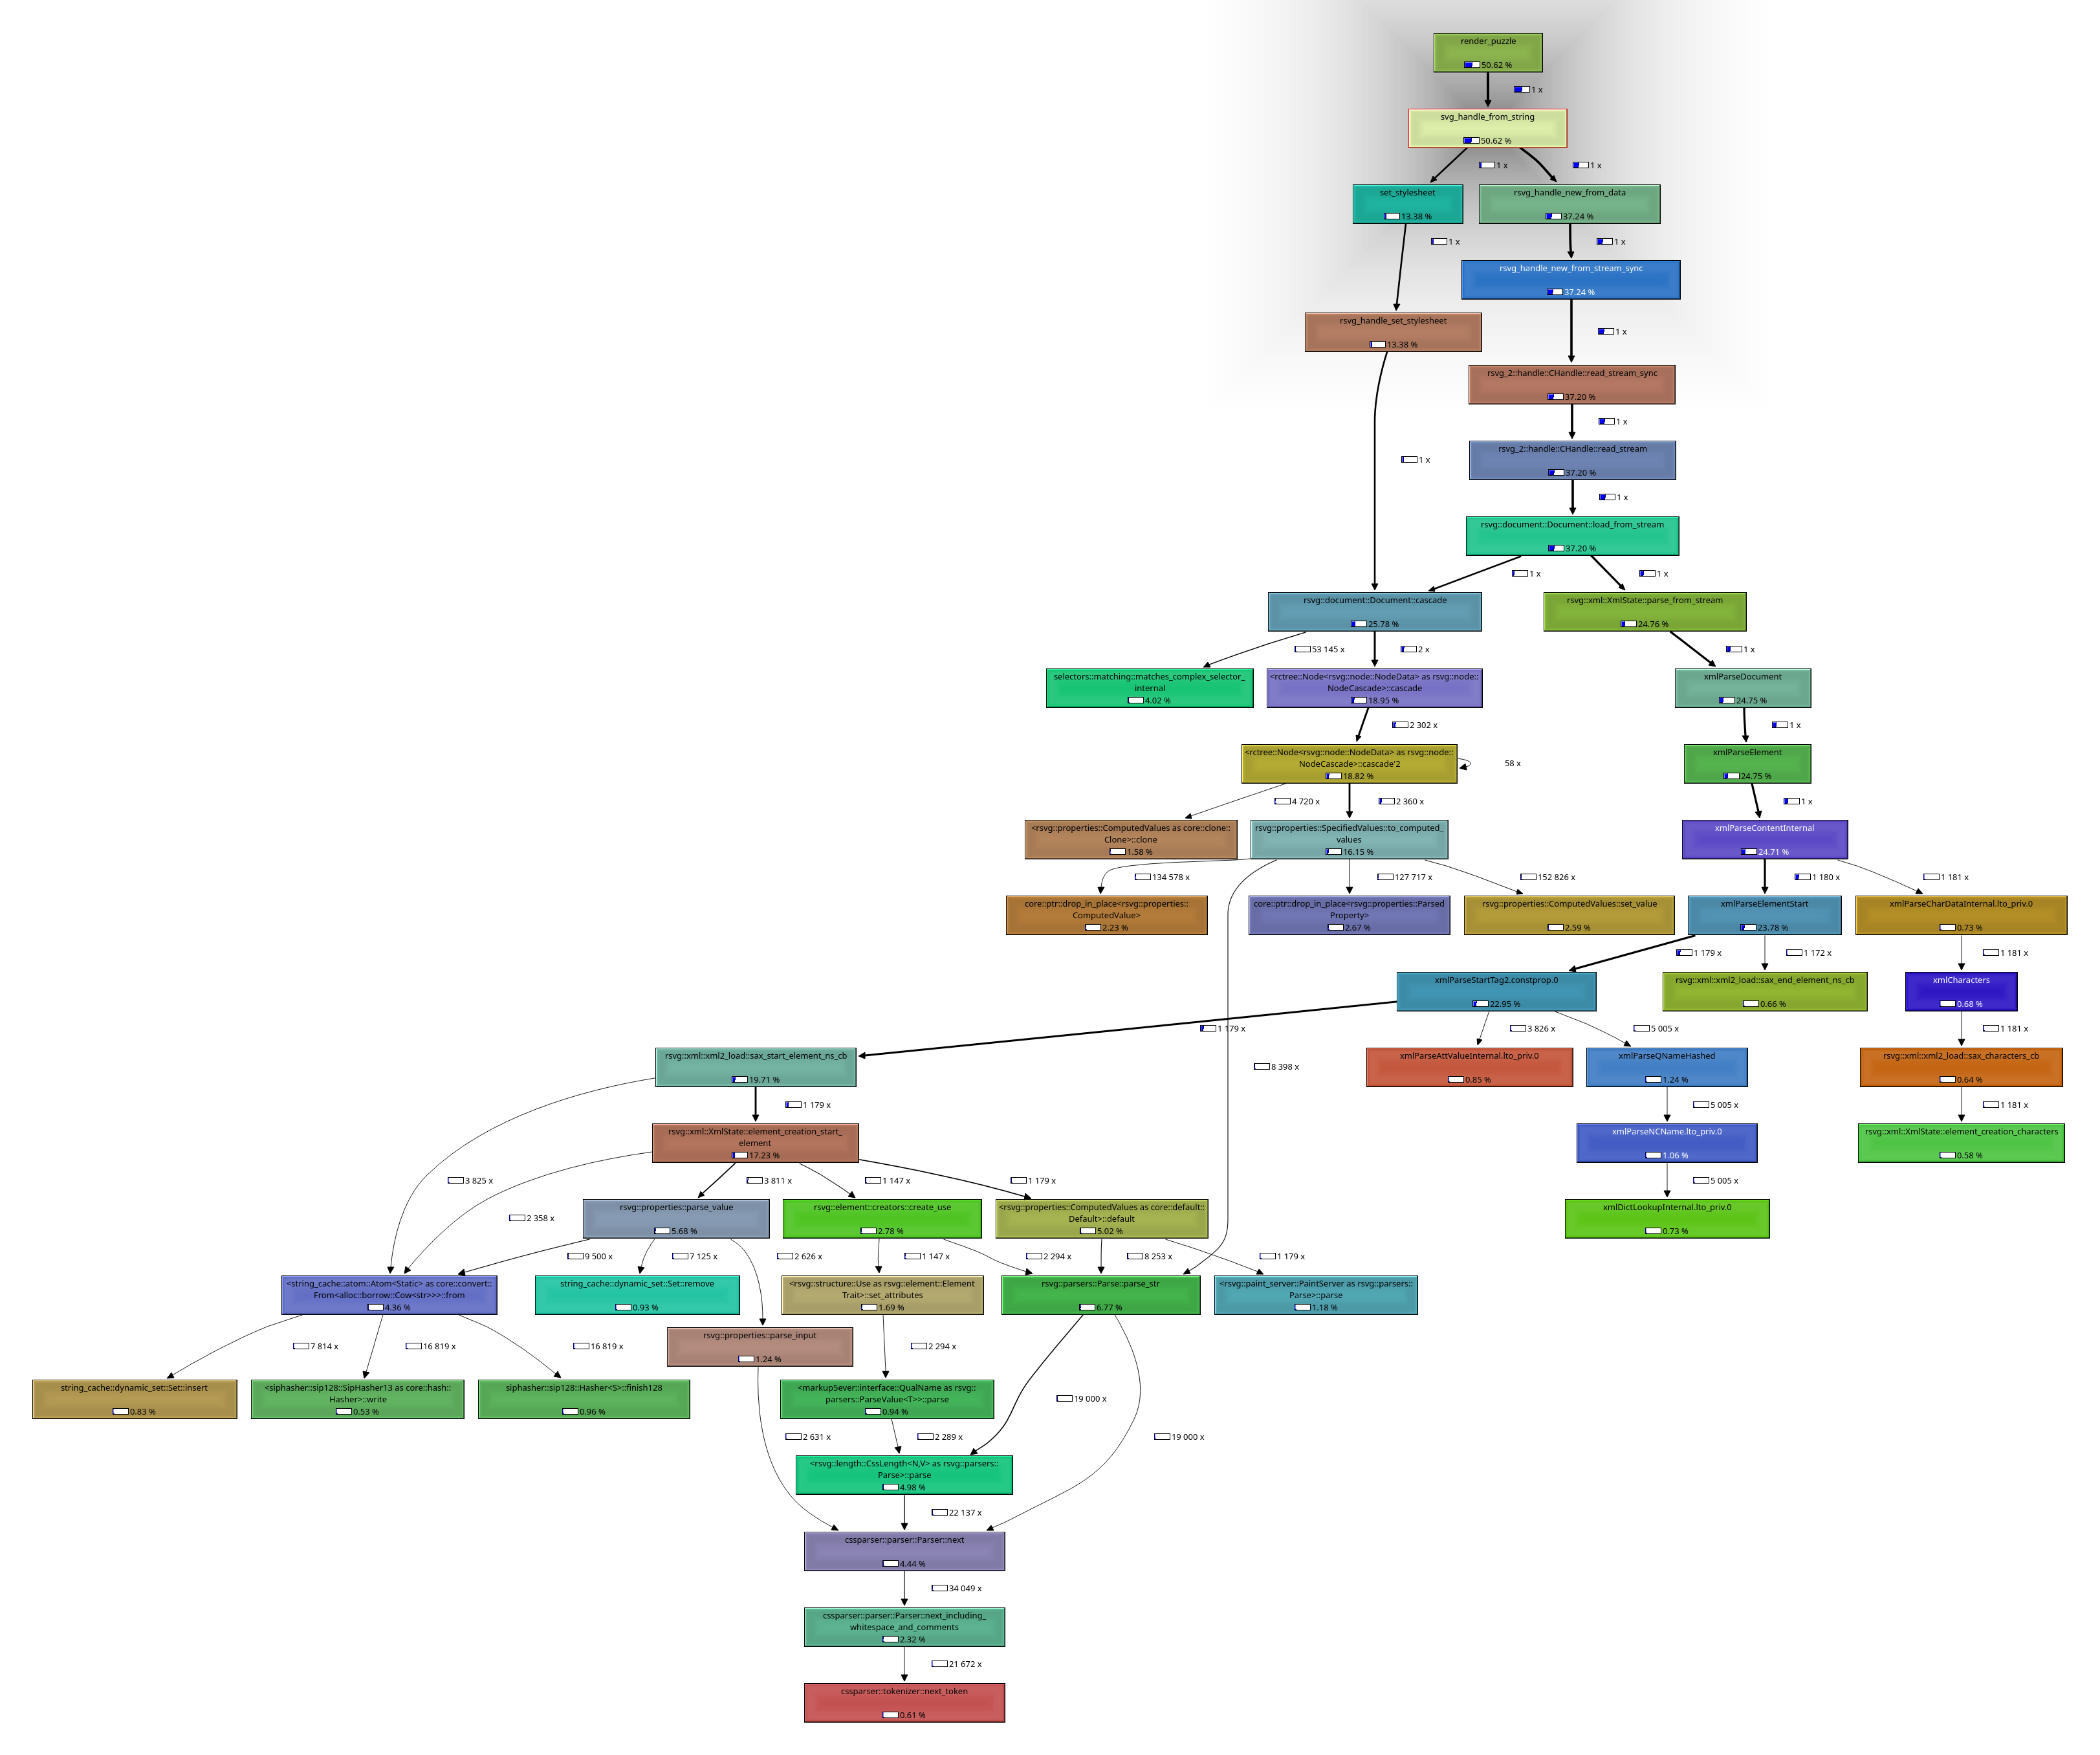
svg_handle_from_string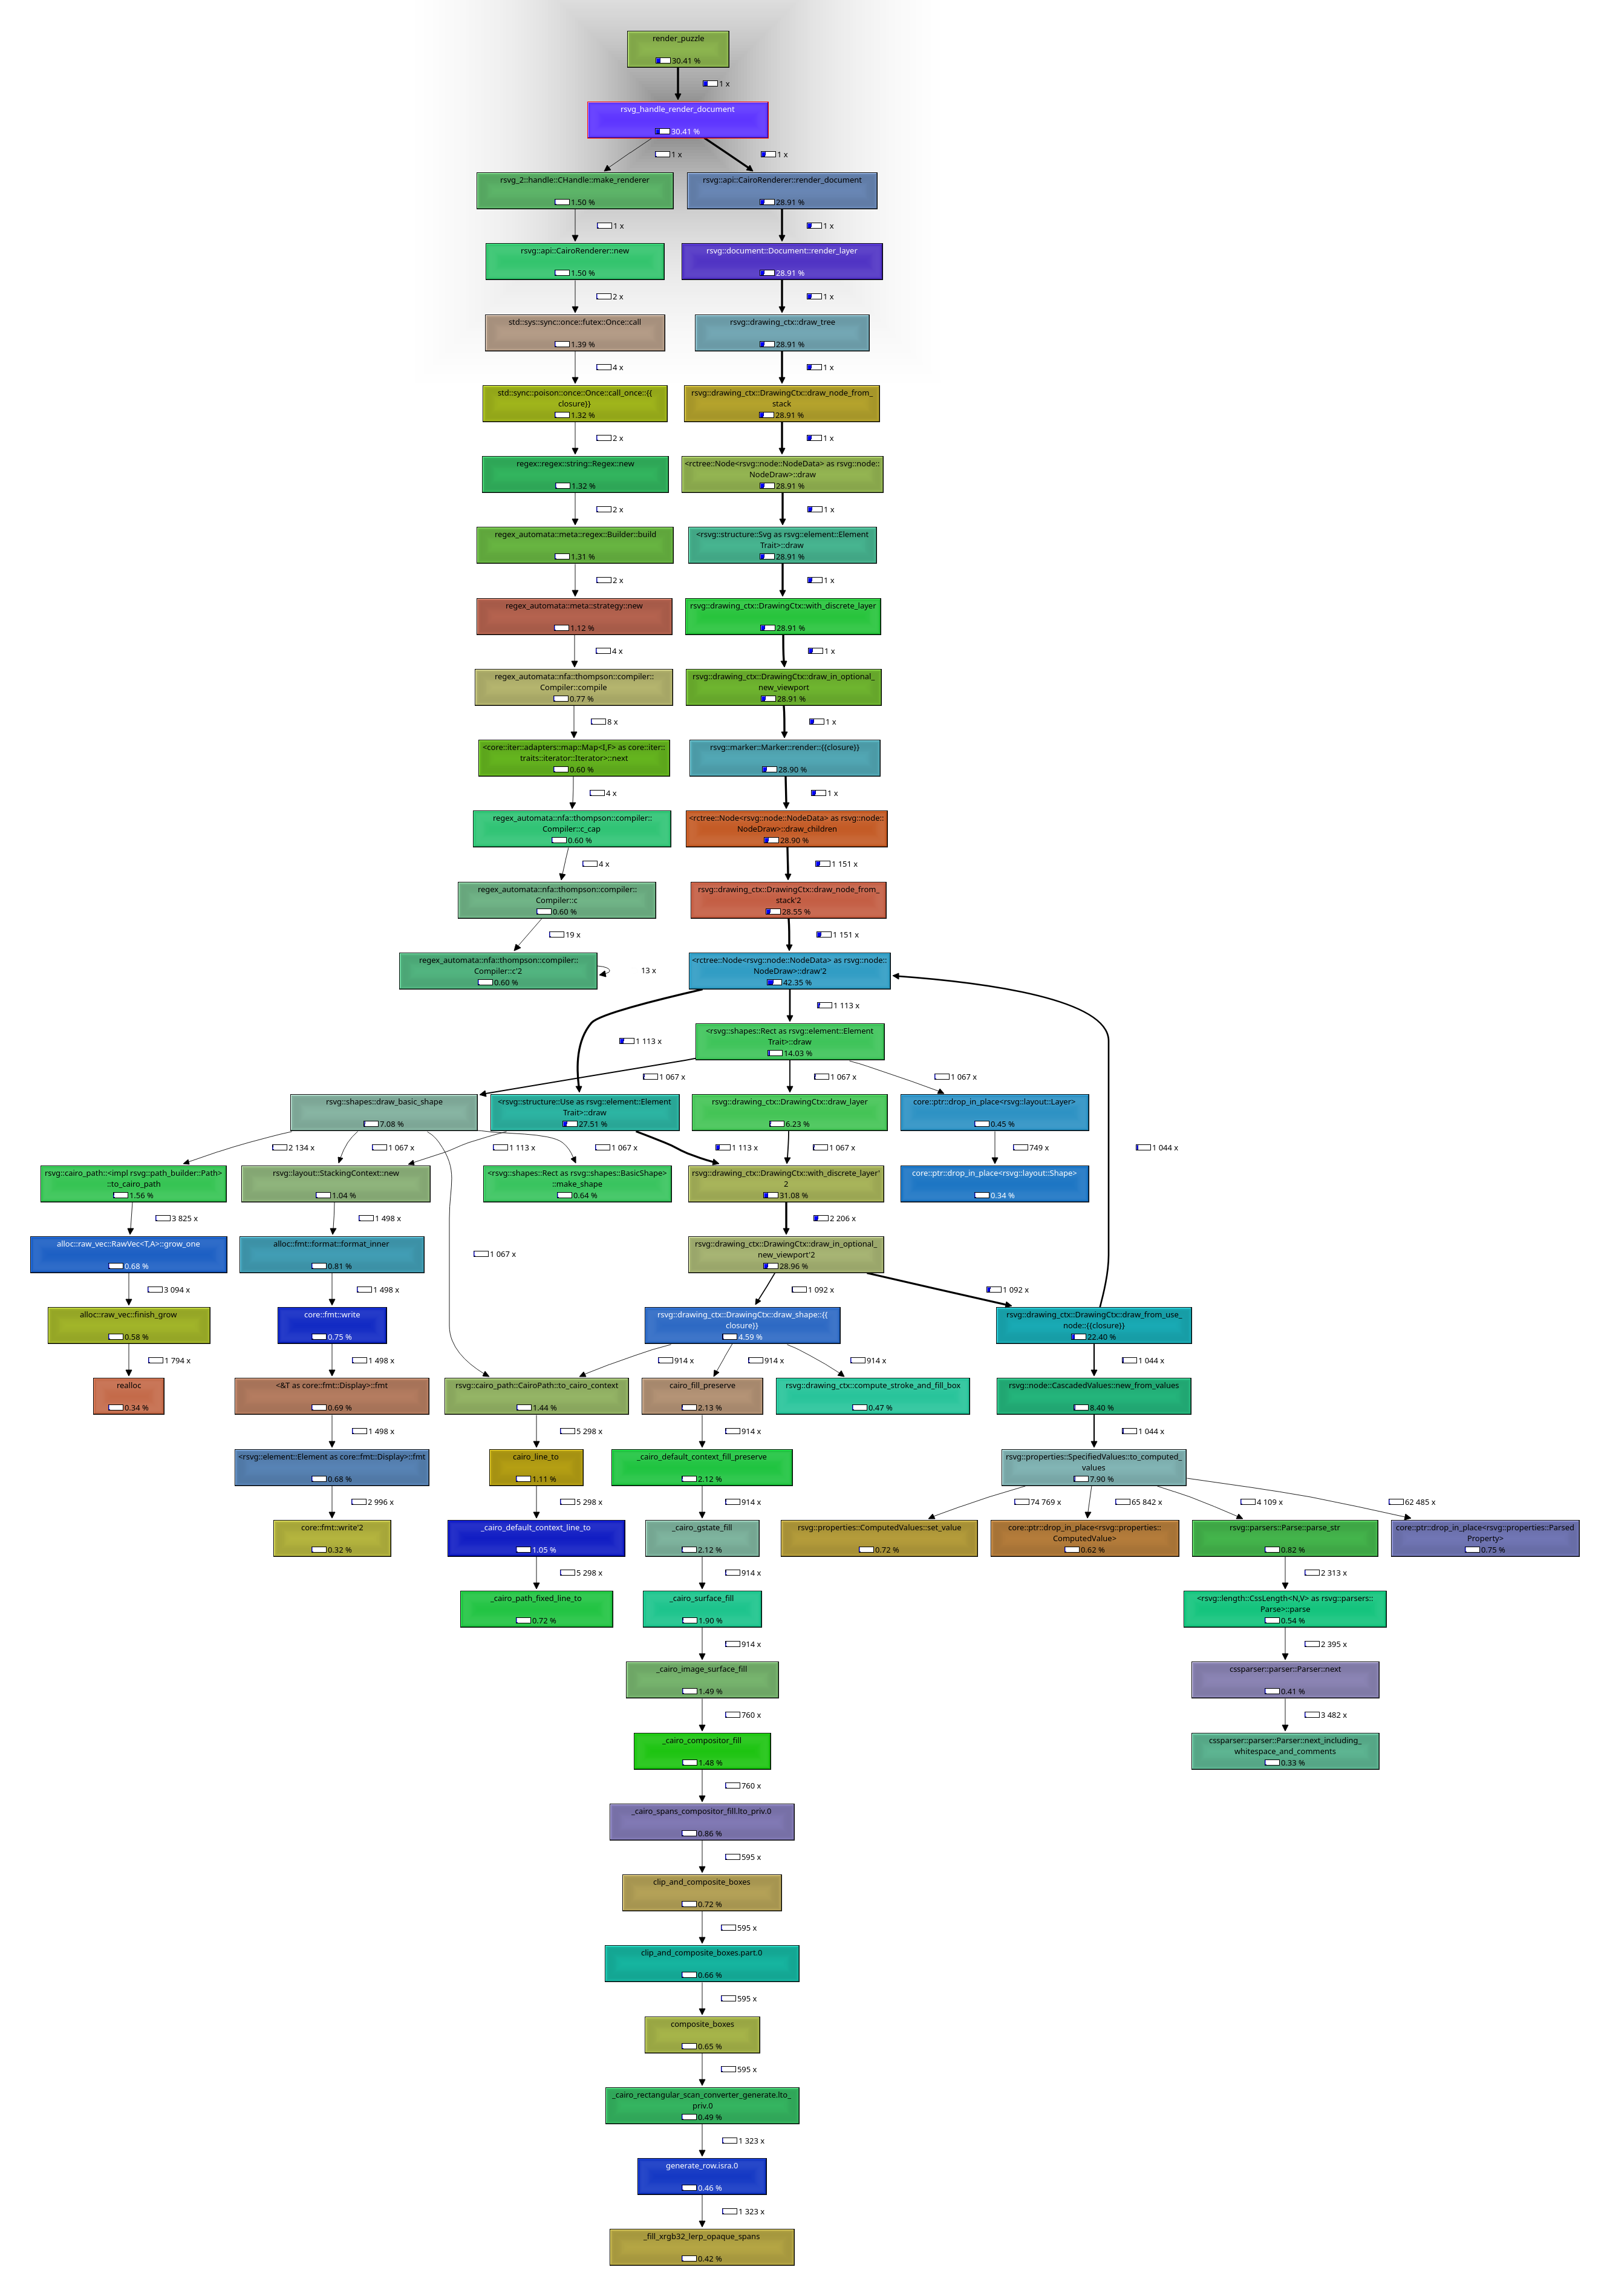
rsvg_handle_render_documentThe performance of rsvg_handle_render_document improves very slightly after its first call within a program due to some one-time initialisation that occurs in the first call, but it is almost insignificant. From these results, it can be seen that the root of the problem is beyond the scope of Crosswords, as it is something to fix in librsvg. My mentors and I thought it would be quicker and easier to replace or eliminate these stages, but before making a final decision, we needed to see real timings first. For anyone who cares to see a colourful, humongous call graph, be my guest:
Getting Real Timings
The next step was to get real timings for puzzles of various kinds and sizes to make sense of Callgrind’s percentages, determine the relationship between puzzle sizes and render times, and know the maximum amount of time we can save by replacing or eliminating the SVG stages of the pipeline.
To achieve this, I ran the profiler program over a considerably large collection of puzzles available to the GNOME Crosswords project and piped the output (it’s in CSV format) to a file, the sorted version of which can be found here (puzzle_render_profile-sorted_by_path.csv). Then, I wrote a Python script (visualize_results.py), which can also be found at the same URL, to plot a couple of graphs from the results.
Both show a very similar profile from which I made the following deductions:
- Total render times increase almost linearly with puzzle size, and so do the component stages of the rendering pipeline. The exceptions (those steep valleys in the graphs) are puzzles with significant amounts of NULL cells, the corresponding layout items of which are omitted during SVG generation since NULL cells are not to be rendered.
- The stages of loading the generated SVG and rendering it take most of the time, significantly more than the other stages, just as the Callgrind graphs above show.
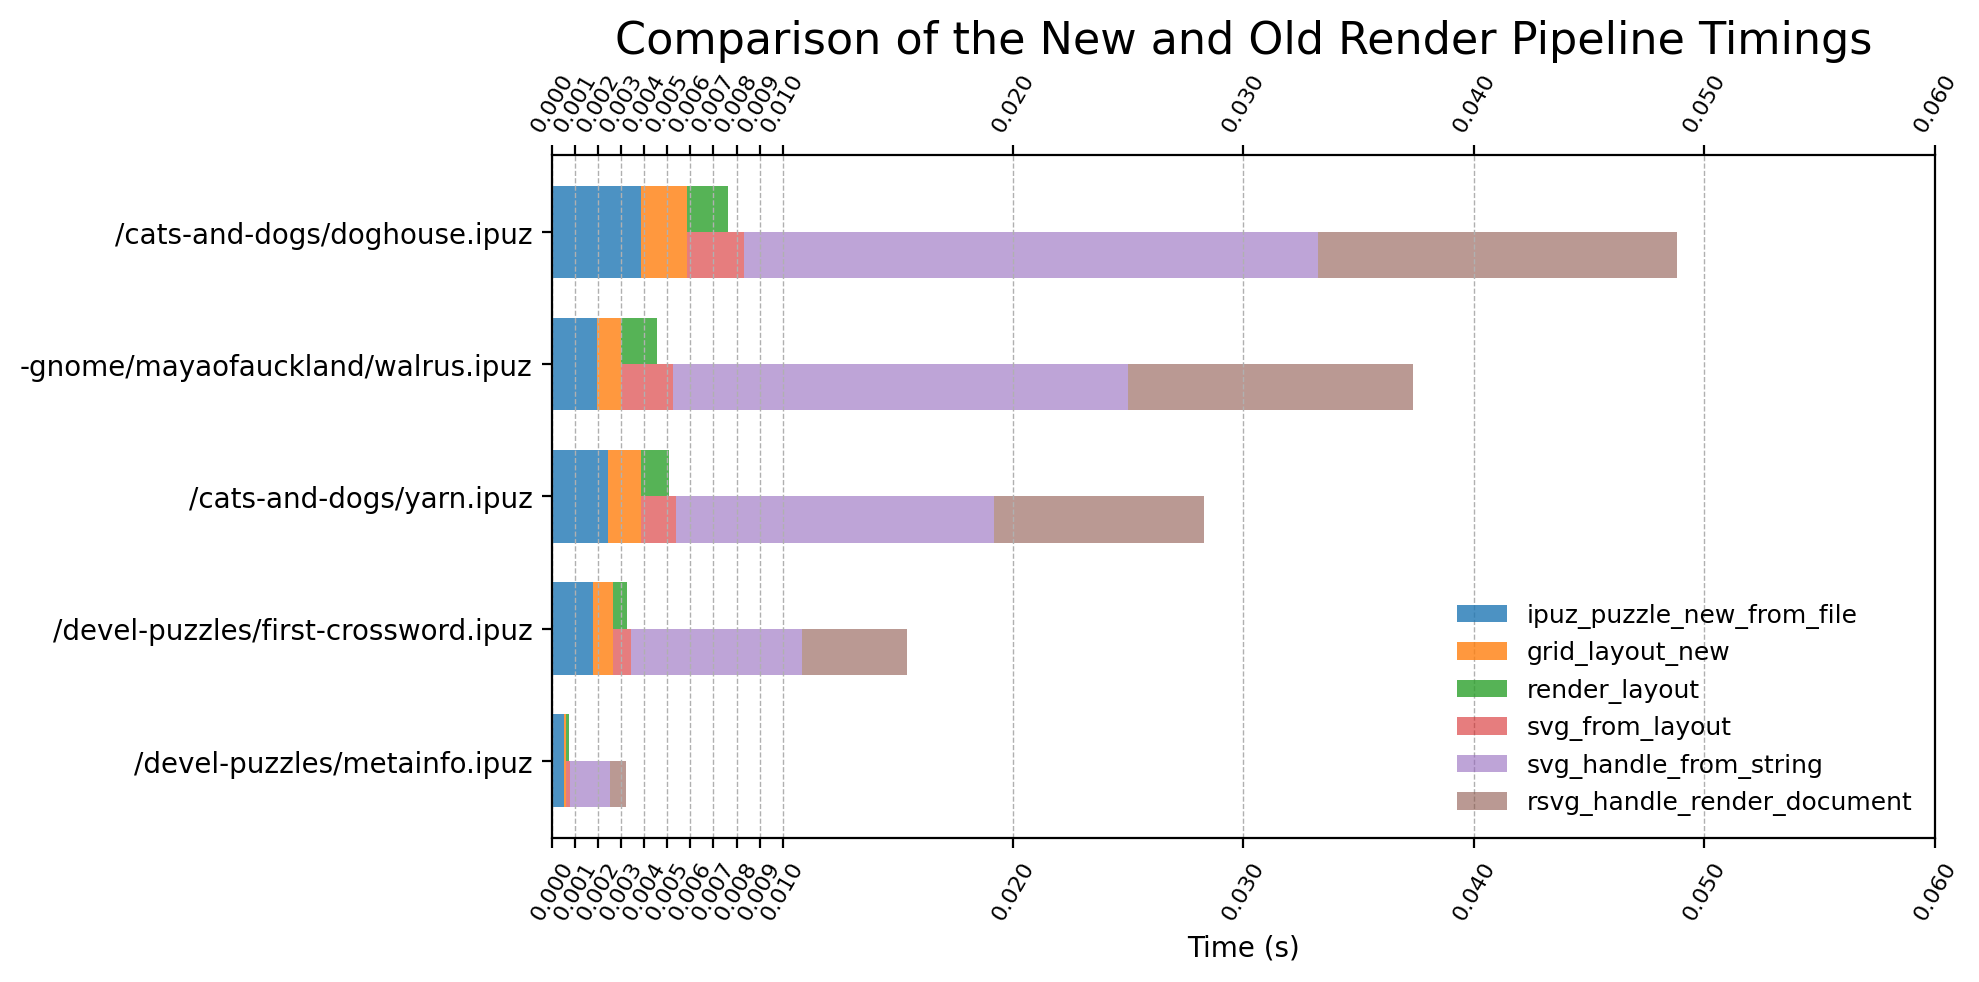
Below is a stacked bar chart showing the cumulative render times for all puzzles. Note that these timings are only valid relative to one another; comparison with timings from another machine or even the same machine under different conditions would be invalid.
The Way Forward
Thankfully, the maintainer of librsvg, Federico Mena Quintero, happens to be one of my mentors. He looked into the profiling results and ultimately recommended that we cut out the SVG stages (svg_from_layout, svg_handle_from_string and rsvg_handle_render_document) entirely and render using Cairo directly. For context, librsvg renders SVGs using Cairo. He also pointed out some specific sources of the librsvg bottlenecks and intends to fix them. The initial work in librsvg is in !1178 and the MR linked from there.
This is actually no small feat, but is already in the works (actually more complete than the SVG rendering pipeline is, at the point of writing this) and is showing great promise! I’ll be writing about this soon, but here’s a little sneak peek to keep your taste buds wet.

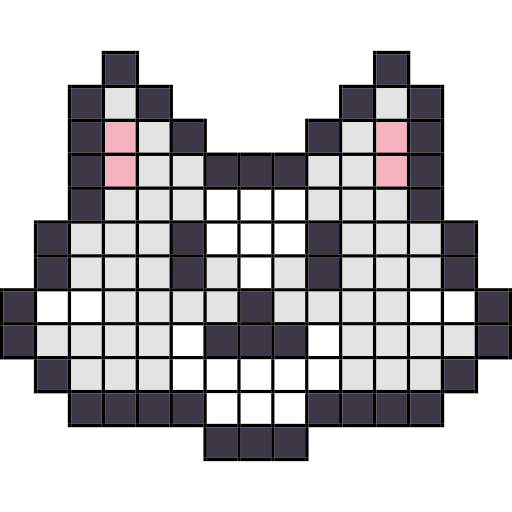

I’ll leave you to figure it out in the meantime.
Conclusion
Every aspect of the task was such a great learning experience. This happened to be my first time profiling C code and using tools like Valgrind and Sysprof; the majority of C code I had written in the past was for bare-metal embedded systems. Now, I’ve got these under my belt, and nothing is taking them away.
That said, I will greatly appreciate your comments, tips, questions, and what have you; be it about profiling, or anything else discussed herein, or even blog writing (this is only my second time ever, so I need all the help I can get).
Finally, but by far not the least important, a wise man once told me:
The good thing about profiling is that it can overturn your expectations :-)
Thanks
Very big thank yous to my mentors, Jonathan Blandford and Federico Mena Quintero, for their guidance all through the accomplishment of this task and my internship in general. I’ve learnt a great deal from them so far.
Also, thank you (yes, you reading) so much for your time. Till next time… Anticipate!!!
For mad scientist stuff, the results look dope! Love that there is room for aesthetics in that big brain.
Thank you so much. 🙏😄
So sorry it took a while for me to reply 🙏. Just saw the notification of your comment a few minutes ago. Still getting used to this platform. 🤦♂️