It’s been a while since I originally created this page. I’ve been planning for a while (over a year) to write an article like this, but have been putting this off for one reason or another. With GUADEC going on while writing this, listening to some interesting talks on YouTube, I thought this is a good time as ever to actually to submit my first post on this page. In this article, I’ll simply lie down the history of Graphs, how it came to be, how it evolved to an actually useful program for some, and what is on the horizon. Be aware that any opinions expressed are my own, and do not necessarily reflect those of my employer, any contributors or the GNOME Foundation itself.
I would also like to acknowledge that while I founded Graphs, the application I’m mainly talking about, I’m not the only one working on the project. We’ve got a lot of input from the community. And I maintain the project with Christoph, the co-maintainer of the project. Any credit towards this particular program, is shared credit.
Motivations
As many open source projects, I originally developed Graphs because I had a personal itch to scratch. At the time I was working on my PhD, and I regularly had to plot data to prepare for presentations. As well as to do some simple manipulations. Things like cutting away the first few degrees from a X-ray reflectivity measurement, normalizing data, or shifting data to show multiple measurements on the same graph.
At the time, I had a license for OriginLabs. Which was an issue for multiple reasons. Pragmatically, it only works on Windows and even if it had a Linux client, we had a single license coupled to my work PC in my office which I didn’t tend to use a lot. Furthermore, the software itself is an interface nightmare and doing simple operations like cutting data or normalization is not exactly intuitive.
My final issue was more philosophical, which is that I have fundamental problems with using proprietary software in scientific work. It is bluntly absurd how we have rigorous and harsh rules about showing your work and making your research replicable in scientific articles (which is fair), but as soon as software is involved it’s suddenly good enough when a private entity tells us “just trust me bro“. Let it be clear that I have no doubt that a proprietary application actually implements the algorithms that it says it does according to their manual. But you are still replacing a good chunk of your article with a black box, which in my view is fundamentally unscientific. There could be bugs, and subtlety could be missed. Let alone the fact that replicability is just completely thrown out of the window if you delegate all your data processing to a magic black box. This is an issue where a lot of people I talk to tend to agree with me on principle, yet very few people actually care enough to move away from proprietary solutions. Whenever people use open-source software for their research, I found it’s typically a coincidence based on the merits that it was free, rather than a philosophical or ideological choice.
Either way, philosophically, I wanted to do my data-reduction using complete transparency. And pragmatically I simply needed something that just plots my data, and allows me to do basic transformations. For years I had asked myself questions like “why can’t I just visually select part of the data, and then press a “cut” button?” and “Why do all these applications insist on over-complicating this?” Whilst I still haven’t found an answer to the second question, I had picked up programming as a hobby at that stage, so I decided to answer my first question with a “fine, I’ll do it myself”. But first, let’s start at what drove me to start working on applications such as these.
Getting into application development
Whilst I had developed a lot in MatLab during my master’s (as well as TI-Basic at high-school), my endeavor in application-development started mostly during my PhD. Starting with some very simple applications, like a calculator tool for growth rate in magnetron sputtering based on calibration measurements. Another application that I wrote during that time was a tool that simply plotted logs that we got from our magnetron sputtering machine. Fun fact here is that my logging software also kept track of how the software running our magnetron sputtering chambers slowed down over time. Basically, our machine was steered using LabView, and after about 1000 instructions or so it started to slow down a bit. So if we tell it to do something for 24 seconds, it started to take 24.1 seconds for instance. At one point we had a reviewer comment that didn’t believe that we could get such a delay with modern computers, so it was nice to have the receipts to back this up. Still the conclusion here should be that LabView is not exactly great to steer hardware directly, but it’s not me that’s calling the shots.
My first “bigger” project was something in between a database (all stored in a csv file), as well as a plotting program. Basically for every sample I created in the lab, I added an item where I stored all relevant information, including links to the measurements I did on the sample (like sane people would do in an excel sheet). Then using a simple list of all samples, I could quickly just plot my data for the measurements I wanted. I also had some functionality like cutting away the start of the data, normalizing the data, or the ability to calculate sample thickness based on the measurement. In a sense, this was Graphs 0.1. The code is still online, if someone wants to laugh at a physicists code without any real developer experience.
The second “big” tool that I created during that time was GIScan. This lied the foundation of my very favourite article that I wrote during my PhD. Essentially, we got 24 hours to measure as many samples as we can at a Synchrotron facility. So that’s exactly what we did, almost blindly. Then we came home with thousands of measurements on a few hundred samples, and it was time to analyze. At the very first stage, I did some basic analysis using Python. Basically all filenames were tagged somewhat strategically, so I could use regex to isolate the measurement series, and then I could quite quickly find the needle in the haystack. Basically, I found which 20 measurements or so where interesting for us and where to look further. The only problem, the work we were doing was extremely niche and the data reduction software available, which would do things like background subtraction and coordinate conversion for us (from pixels to actually physical coordinates), was barely functional and not made for our type of measurements. So here I wrote my own data reduction software, GIScan. Explaining what makes it actually incredibly useful would require an article series about the physics behind this, but my entire analysis hinged on this data analysis software. GIScan is also available as GPLv3 licensed software, but also here I will use my right to remain silent on any questions about the crimes committed in the code quality itself. Fun fact, all graphs in the mentioned article were made using Graphs and Inkscape. Most of the figures themselves are available under a CC-BY license as part of my PhD. I asked about using a CC-BY-SA license, but the university strongly recommended against as they felt it could make it more difficult to use for others in publishing if I care about sharing my work, basically journals are the biggest parasites in academia.
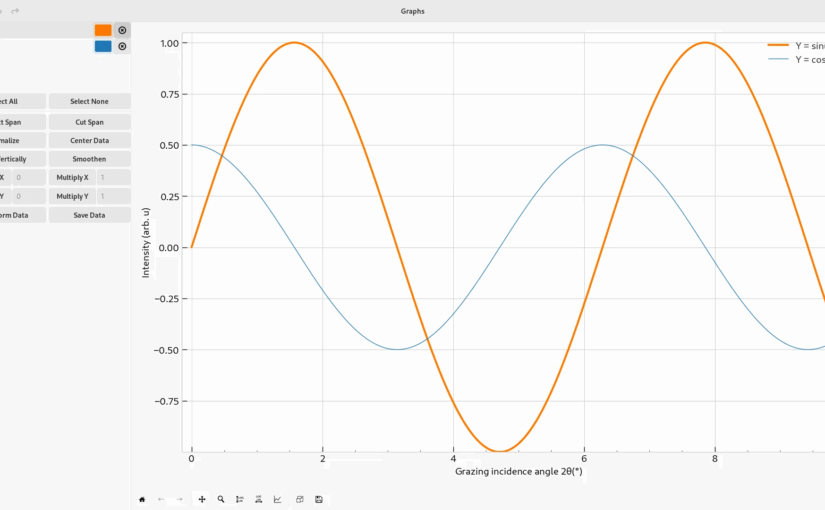
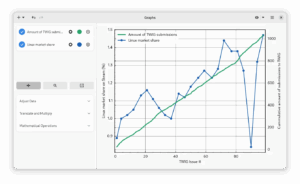
Then we get to Graphs. This was the last, and biggest program that I wrote during that time in my career. At the very beginning, I actually started in Qt. Not because I preferred it as a toolkit (I didn’t, and still don’t), but because it’s easier to port to Windows and spread to my peers. Quite quickly I got to the state where I could easily import two-column data, and do simple manipulations on this data like normalizing the data. It was barebones, but really useful for my workflow. However, as this quickly turned into a passion project, I decided to do the selfish thing and actually rewrite the entire thing in the toolkit that I personally preferred, GTK with libadwaita. It looked beautiful (well, in the same way a newborn baby is beautiful to their parents), and it integrated very nicely into my own desktop. In fact, I was so pleased with it, that I felt like I wanted to share this online, the original Reddit post can still be found here. This marked the very first release of Graphs 1.0, which can be seen in its full glory below, and this is essentially where the fun began
The power of community
When I originally developed this for my personal use, I simply called it “Data Manipulator”, which I had shortened to DatMan. Quite early in the process, even before I shared the project to Reddit, Hari Rana (aka TheEvilSkeleton) filed an issue asking me to consider naming the project in accordance with the GNOME HIG. After some small discussions there, we settled on Graphs. This was my first experience with feedback or contributions from the community, and something I am still grateful for. It’s a much nicer name that fits in with GNOME applications. They also helped me with a few other design patterns like modal windows and capitalization. Shoutout to Skelly here, for the early help to a brand new project. It did push me to look more into the HIG, and thus helped a lot in getting that ball rolling. I don’t take any donations, but feel free to help them out with the work on several projects that are significantly more high-stress than Graphs. There’s a donation page on their webpage.
After sharing the initial release to Reddit, I continued development and slowly started tweaking things and polishing existing features. I added support for multiple axes, added some more transformations and added basic options like import settings. It was also around this time that Tobias Bernard from the GNOME Design team dropped by with some help. At first with the generous offer to design a logo for the project, which is still the logo of Graphs today. The old logo, followed by the newly designed logo can be found here:
Yet again, I was very pleasantly surprised by complete strangers just dropping by and offering help. Of course, they’re not just helping me personally, but rather helping out the community and ecosystem as a whole. But this collaborative feeling that we’re all working on a system that we collectively own together is something that really attracted me to GNOME and FOSS in general.
It was also around these early days that Christoph, who now maintains Graphs with me came by with some pull requests. This went on to the point that he pretty naturally ended up in the role of maintainer. I can confidently say that him joining this endeavor is the best thing that ever happened to Graphs. Both in terms of a general elevation of the code quality, but also in terms of motivation and decision making. Not only did the introduction of a second maintainer mean that new code actually got reviewed, but someone else contributing is a really strong motivator and super contagious for me. In these somewhat early days things were moving fast, and we really saw strong improvement both in terms of the quality of the code, but also in the general user experience of the app.
In terms of UX, I’d really like to thank Tobias again. Even before we even had GNOME Circle on our radar as goal, he helped us a lot with general feedback about the UX. Highlighting papercuts, and coming up with design patterns that made more sense. Here we really saw a lot of improvements, and I really learned a lot at the time about having design at the core of the development process. The way the application works is not just a means to get something done, the design is the program. Not to say that I’d classify myself as an expert UI-designer these days, but a lot of lessons have been learned thanks to the involvement of people that have more expertise than me. The GNOME Design team in general has been very helpful with suggestions and feedback during the development. Whenever I got in touch with the GNOME Developer community, it’s been nothing but helpfulness and honest advice. The internet stereotype about GNOME Developers being difficult to work with simply does not hold up. Not in my experience. It’s been a fantastic journey. Note that nobody is obliged to fix your problems for you, but you will find that if you ask nicely and listen to feedback from others, people are more than willing to help you out!
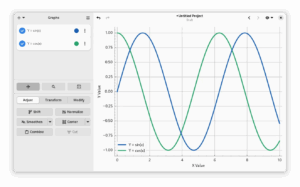
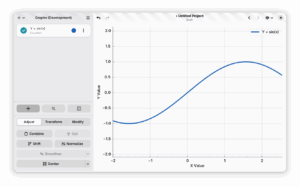
I couldn’t talk about the history of Graphs, without at least mentioning the process of getting to GNOME Circle. It’s there for me, that Graphs really went from a neat hobbyist tool to a proper useful application. When we initially applied there, I was pretty happy about the state we were at, but we’ve actually undergone quite a bit of a transformation since Graphs got accepted. If someone feels inclined following the process, the entire process is still available on the GitLab page. I won’t go too much about joining GNOME Circle here, there’s a nice talk scheduled at GUADEC2025 from the developer of Drum Machine about that. But here’s what Graphs looked like before, and after the GNOME Circle Application:
Two particular changes that stuck to me where the introduction of touchpad gesture support, and the change in the way we handle settings. Starting with touchpad gestures, I had always considered this to be out of our control. We use Matplotlib to render the plots themselves, which by itself doesn’t support touch gestures. It’s mostly thanks to Tobias naming it as part of the GNOME Cirle Review that I actually went ahead and try to implement it myself. After a week or so digging into documentations and testing some different calculations for the different axes, I actually got this working. It’s a moment that stuck with me, partly because of the dopamine hit when things finally worked, but also because it again showed the value of starting with intended the user experience first and then working backwards to fit the technology with that. Rather than starting with the technology, and then creating a user experience from that.
The change in settings is something I wanted to highlight, because this is such a common theme in discussions about GNOME in general. Over time, I’ve been leaning more and more towards the idea that preferences in many cases are simply just an excuse to avoid making difficult choices. Before submitting, we had settings for basically everything. We had a setting for the default plotting style in dark mode and light mode, we had a setting for the clipboard size. We had a setting for the default equation when creating a new equation, and I could on for a bit. Most of these settings could simply be replaced by making the last alternative persistent between sessions. The default equation now is simply the last used equation, same for import settings where we just added a button to reset these settings to default. For the styling we don’t have a separate dark and light style that can be set, instead you just set one style total and one of the options is just “System”, which essentially resembles Adwaita and Adwaita-dark in light and dark mode respectively. This really, really streamlined the entire user experience. Things got much easier to use, and options got much easier to find. I would strongly recommend anyone that develops applications (within the GNOME ecosystem or elsewhere), to read the “Choosing our preferences” article, it’s a real eye-opener.
Where we are now, and where we’re going
These days Graphs is relatively mature and works pretty well. Since being accepted to the GNOME Circle, we haven’t had such a major overhaul as presented here. We’ve had some performance upgrades under the hood, fixed quite a bit of bugs and made some improvements with the layout system. We’ve since also added full support for touchscreen devices (thanks to me getting a Steam Deck, allowing me to test on touch), improved the rubberband on the canvas, and improved equation parsing a bit.
Despite the somewhat slower pace, there is a major release in the brewing with some exiting features already in the main branch. Some of the features that you can expect in the next stable release:
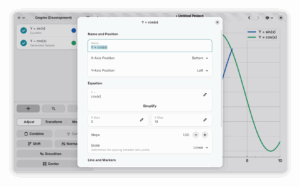
Full equation support on an infinite canvas
At the moment, you cannot really add an “equation” to Graphs. Instead, what you do is that you generate data based on an equation. In the next release, we actually support “equations”. These span the entire canvas, and can be changed afterwards as well. Operations you do on the equation (such as derivatives), actually affect the equation accordingly, and you can actually change the equation also now after adding it.
Generated data can now be changed afterwards
You can still generate data from an equation like you could previously (so it doesn’t have to be an infinite equation). But generated data can now also be changed afterwards by changing the input equation.
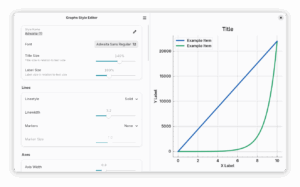
A fully revamped style editor
In the upcoming release, you can actually open .mplstyle files using Graphs, which opens the style editor itself instead of the main application. Furthermore, you can now import styles from the GUI, and open Graphs styles in another application (like your text editor) to do some advanced changes in the style that are not supported by our GUI. Likewise, you can now export your Graphs style-file so you can share it with others. (Maybe even with us, as a merge request, if it’s really nice 😉 )
Another really nice touch is that you now get a live preview of the actual style you’re working on, so you don’t need to go back and forth every time when you make incremental changes.
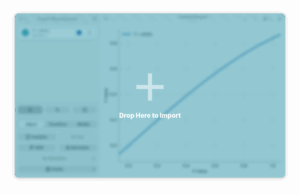
Drag and drop support
You can now import data by simply drag and dropping data into the As usual, there’s more features that I probably forgot. But the next release is bound to be a banger. I won’t dare to pin a release date here. But all the mentioned changes are already working (sqlite support is still in MR) and can be tested from the main branch. There’s still work to do though with regard to a planned rework on the way we import data, and the way we access the style editor which is currenlty a bit buried in the stable release. main application
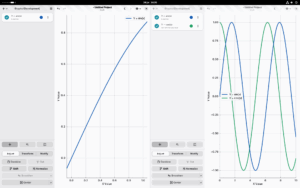
Multiple sessions
You can now finally have multiple sessions of Graphs open at the same time. Allowing you to view and work on data side-by-side.
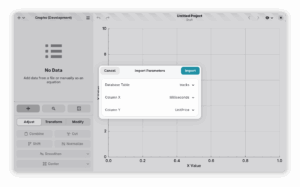
Support for sqlite databases
We now added support for sqlite databases. So you can import data from your .db file
And more
As usual, there’s more features that I probably forgot. But the next release is bound to be a banger. I won’t dare to pin a release date here. But all the mentioned changes are already working (sqlite support is still in MR) and can be tested from the main branch. There’s still work to do though with regard to a planned rework on the way we import data, and the way we access the style editor which is currently a bit buried in the stable release.
Conclusion
This post got a bit longer than I anticipated. But I hope in general this could give people some insight on how it is for a newcomer to get into application development. I really encourage people to test the waters. It really shows that you really can get involved, even if it involves learning along the way. These days I no longer work in academia, and I am willing to bet that I’d probably wouldn’t have my current position working with software if it wasn’t for these adventures.
Again, I would really like to thank the GNOME Community as a whole. The adventure so far has been great, and I promise that it’s far from over 🙂
This is a wonderful writeup, thank you for sharing!