If you work with patches and git am, then you’re probably used to seeing patches fail to apply. For example:
$ git am CVE-2025-14512.patch
Applying: gfileattribute: Fix integer overflow calculating escaping for byte strings
error: patch failed: gio/gfileattribute.c:166
error: gio/gfileattribute.c: patch does not apply
Patch failed at 0001 gfileattribute: Fix integer overflow calculating escaping for byte strings
hint: Use 'git am --show-current-patch=diff' to see the failed patch
hint: When you have resolved this problem, run "git am --continue".
hint: If you prefer to skip this patch, run "git am --skip" instead.
hint: To restore the original branch and stop patching, run "git am --abort".
hint: Disable this message with "git config set advice.mergeConflict false"
This is sad and frustrating because the entire patch has failed, and now you have to apply the entire thing manually. That is no good.
Here is the solution, which I wish I had learned long ago:
$ git config --global am.threeWay true
This enables three-way merge conflict resolution, same as if you were using git cherry-pick or git merge. For example:
$ git am CVE-2025-14512.patch
Applying: gfileattribute: Fix integer overflow calculating escaping for byte strings
Using index info to reconstruct a base tree...
M	gio/gfileattribute.c
Falling back to patching base and 3-way merge...
Auto-merging gio/gfileattribute.c
CONFLICT (content): Merge conflict in gio/gfileattribute.c
error: Failed to merge in the changes.
Patch failed at 0001 gfileattribute: Fix integer overflow calculating escaping for byte strings
hint: Use 'git am --show-current-patch=diff' to see the failed patch
hint: When you have resolved this problem, run "git am --continue".
hint: If you prefer to skip this patch, run "git am --skip" instead.
hint: To restore the original branch and stop patching, run "git am --abort".
hint: Disable this message with "git config set advice.mergeConflict false"
Now you have merge conflicts, which you can handle as usual. This seems like a better default for pretty much everybody, so if you use git am, you should probably enable it.
I’ve no doubt that many readers will have known about this already, but it’s new to me, and it makes me happy, so I wanted to share. You’re welcome, Internet!
WebKitGTK 2.50.3 contains a workaround for CVE-2025-13947, an issue that allows websites to exfiltrate files from your filesystem. If you’re using Epiphany or any other web browser based on WebKitGTK, then you should immediately update to 2.50.3.
Websites may attach file URLs to drag sources. When the drag source is dropped onto a drop target, the website can read the file data for its chosen files, without any restrictions. Oops. Suffice to say, this is not how drag and drop is supposed to work. Websites should not be able to choose for themselves which files to read from your filesystem; only the user is supposed to be able to make that choice, by dragging the file from an external application. That is, drag sources created by websites should not receive file access.
I failed to find the correct way to fix this bug in the two afternoons I allowed myself to work on this issue, so instead my overly-broad solution was to disable file access for all drags. With this workaround, the website will only receive the list of file URLs rather than the file contents.
Opportunity is upon us! For the past few years, the desktop Linux user base has been growing at a historically high rate. StatCounter currently has us at 4.14% desktop OS market share for Q2 2025. For comparison, when Fedora Workstation was first released in Q4 2014, desktop Linux was at 1.38%. Now, StatCounter measures HTTP requests, not computers, but it’s safe to say the trend is highly encouraging. Don’t trust StatCounter? Cloudflare reports 2.9% for Q2 2025. One of the world’s most popular websites reports 5.1%. And although I was unable to figure out how to make a permanent link to the results, analytics.usa.gov is currently reporting a robust 6.2% for the past 90 days, and increasing. The Linux user base is already much larger than I previously suspected would ever be possible, and it seems to be increasing quickly. I wonder if we are perhaps nearing an inflection point where our user base may soon increase even more considerably. The End of 10 and enthusiastic YouTubers are certainly not hurting.
Compared to its peers, Fedora is doing particularly well. It’s pretty safe to say that Fedora is now one of the 2 or 3 most popular and successful desktop Linux operating systems, a far cry from its status 10 years ago, when Fedora suffered from an unfortunate longstanding reputation that it was an unstable “test bed” OS only suitable for experienced technical users. Those days are long gone; nowadays, Fedora has an army of social media users eager to promote it as a reliable, newcomer-friendly choice.
But we cannot stop here. If we become complacent and content ourselves with the status quo, then we will fail to take maximum advantage of the current opportunity.
Although Fedora Workstation works well for most users, and although quality and reliability has improved considerably over the past decade, it is still far too easy for inexperienced users to break the operating system. Today’s Fedora Workstation is fundamentally just a nicer version of the same thing we already had 10 years ago. The original plan called for major changes that we have thus far failed to deliver, like “Robust Upgrades,” “Better upgrade/rollback control,” and “Container based application install.” These critical goals are notably all already achieved by Fedora Silverblue, the experimental image-based alternative to Fedora Workstation, but few Fedora users benefit because only the most experienced and adventurous users are willing to install Silverblue. I had long assumed that Silverblue would eventually become the next Fedora Workstation, and that the Silverblue code name would eventually be retired. This is now an explicit project goal of Fedora’s Strategy 2028, and it is critical for Fedora’s success. The Fedora Workstation of the future must be:
Safe and image-based by default: an atomic operating system composed of RPMs built on bootc. Most users should stick with image-based mode because it’s much harder to break the OS, and easier to troubleshoot when something does go wrong.
Flexible if you so choose: converting the image-based OS into the traditional package-based OS managed by RPM and dnf must be allowed, for users who prefer or require it. Or alternatively, if converting is not possible, then installing a traditional non-atomic Fedora must remain possible. Either way, we must not force users to use image-based desktops if they do not want to, so no need to panic. But image-based must eventually become the new default.
Silverblue is not ready yet, but Fedora has a large community of developers and should be able to eventually resolve the remaining problems.
But wait, wasn’t this supposed to be a blog post about Flathub? Well, consider that with an image-based OS, you cannot easily install traditional RPM packages. Instead, in Fedora Silverblue, desktop applications are installed only via Flatpak. (This is also true of Fedora Kinoite and Fedora’s other atomic desktop variants.) So Fedora must have a source of Flatpaks, and that source must be enabled by default, or there won’t be any apps available.
(Don’t like Flatpak? This blog post is long enough already, so I’ll ask you to just make a leap of faith and accept that Flatpak is cool. Notably, Flatpak applications that keep their bundled dependencies updated and do not subvert the sandbox are much safer to use than traditional distro-packaged applications.)
In practice, there are currently only two interesting sources of Flatpaks to choose from: Fedora Flatpaks and Flathub. Flathub is the much better choice, and enabling it by default should be our end goal. Fedora is already discussing whether to do this. But Flathub also has several disadvantages, some of which ought to be blockers.
Why Flathub?
There are important technical differences between Fedora’s Flatpaks, built from Fedora RPMs, vs. Flathub’s Flatpaks, which are usually built on top of freedesktop-sdk. But I will not discuss those, because the social differences are more important than the technical differences.
Users Like Flathub
Feedback from Fedora’s user base has been clear: among users who like Flatpaks, Flathub is extremely popular. When installing a Flatpak application, users generally expect it to come from Flathub. In contrast, many users of Fedora Flatpaks do not install them intentionally, but rather by accident, only because they are the preferred software source in GNOME Software. Users are often frustrated to discover that Fedora Flatpaks are not supported by upstream software developers and have a different set of bugs than upstream Flatpaks do. It is also common for users and even Fedora developers to entirely remove the Fedora Flatpak application source.
Not so many users prefer to use Fedora Flatpaks. Generally, these users cite some of Flathub’s questionable packaging practices as justification for avoiding use of Flathub. These concerns are valid; Flathub has some serious problems, which I will discuss in more detail below. But improving Flathub and fixing these problems would surely be much easier than creating thousands of Fedora Flatpak packages and attempting to compete with Flathub, a competition that Fedora would be quite unlikely to win.
This is the most important point. Flathub has already won.
Cut Out the Middleman
In general, upstream software developers understand their software much better than downstream packagers. Bugs reported to downstream issue trackers are much less likely to be satisfactorily resolved. There are a variety of ways that downstream packagers could accidentally mess up a package, whether by failing to enable a feature flag, or upgrading a dependency before the application is compatible with the new version. Downstream support is almost never as good as upstream support.
Adding a middleman between upstream and users really only makes sense if the middleman is adding significant value. Traditional distro-packaged applications used to provide considerable value by making it easy to install the software. Nowadays, since upstreams can distribute software directly to users via Flathub, that value is far more limited.
Bus Factor is Critical
Most Flatpak application developers prefer to contribute to Flathub. Accordingly, there are very few developers working on Fedora Flatpaks. Almost all of the Fedora Flatpaks are actually owned by one single developer who has packaged many hundreds of applications. This is surely not a healthy situation.
I suspect this situation is permanent, reflecting a general lack of interest in Fedora Flatpak development, not just a temporary shortfall of contributors. Quality is naturally going to be higher where there are more contributors. The quality of Fedora Flatpak applications is often lower than Flathub applications, sometimes significantly so. Fedora Flatpaks also receive significantly less testing than Flathub Flatpaks. Upstream developers do not test the Fedora Flatpaks, and downstream developers are spread too thin to have plausible hope of testing them adequately.
Focus on What Really Matters
Fedora’s main competency and primary value is the core operating system, not miscellaneous applications that ship on top of it for historical reasons.
When people complain that “distros are obsolete,” they don’t mean that Linux operating systems are not needed anymore. Of course you need an OS on which to run applications. The anti-distro people notably all use distros.
But it’s no longer necessary for a Linux distribution to attempt to package every open source desktop application. That used to be a requirement for a Linux operating system to be successful, but nowadays it is an optional activity that we perform primarily for historical reasons, because it is what we have always done rather than because it is still truly strategic or essential. It is a time-consuming, resource-intensive side quest that no longer makes sense and does not add meaningful value.
The Status Quo
Let’s review how things work currently:
By default, Fedora Workstation allows users to install open source software from the following sources: Fedora Flatpaks, Fedora RPMs, and Cisco’s OpenH264 RPM.
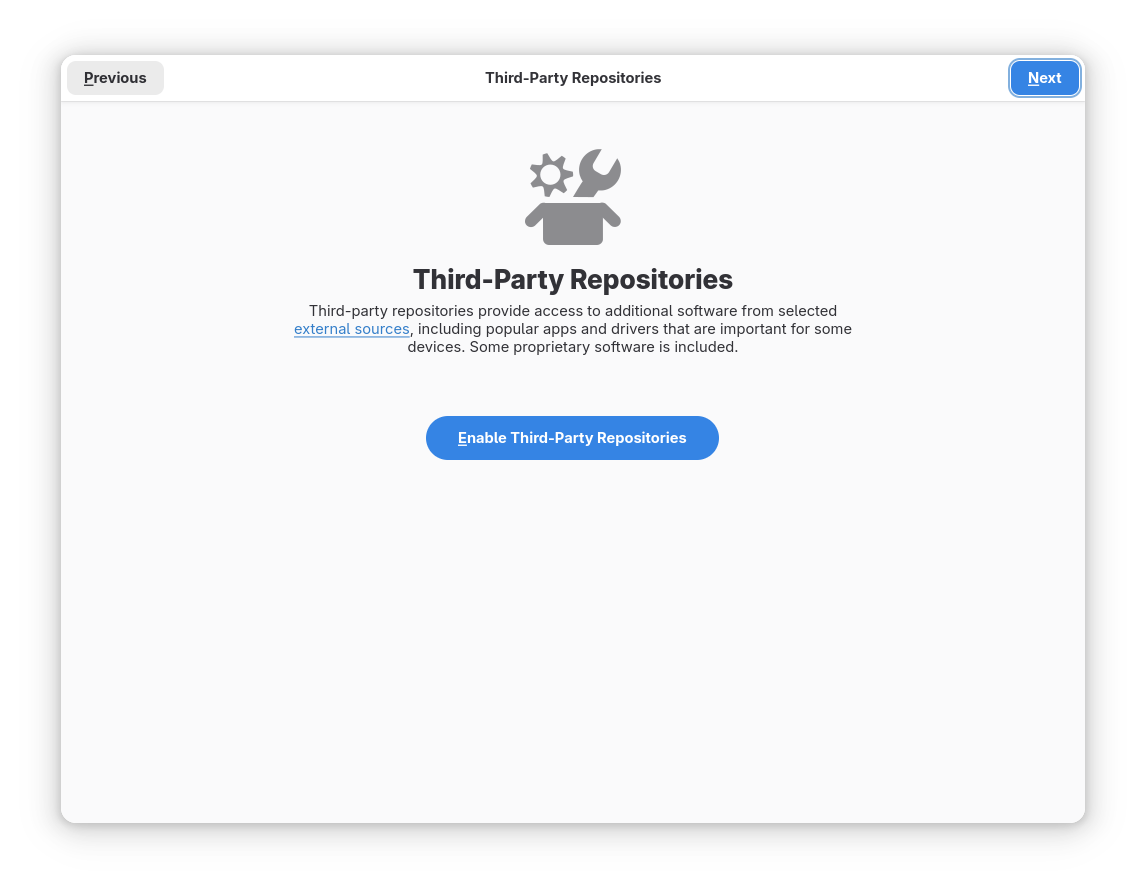
The post-install initial setup workflow, gnome-initial-setup, suggests enabling third-party repositories. If the user does not click the Enable button, then GNOME Software will make the same suggestion the first time it is run. Clicking this button enables all of Flathub, plus a few other RPM repositories.
Fedora will probably never enable software sources that contain proprietary software by default, but it’s easy to enable searching for proprietary software if desired.
(Technically, Fedora actually has a filter in place to allow hiding any Flathub applications we don’t want users to see. But since Fedora 38, this filter is empty, so no apps are hidden in practice. The downstream filter was quite unpopular with users, and the mechanism still exists only as a safety hatch in case there is some unanticipated future emergency.)
The Future
Here are my proposed requirements for Fedora Workstation to become a successful image-based OS.
This proposal applies only to Fedora Workstation (Fedora’s GNOME edition). These proposals could just as well apply to other Fedora editions and spins, like Fedora KDE Plasma Desktop, but different Fedora variants have different needs, so each should be handled separately.
Flathub is Enabled by Default
Since Flathub includes proprietary software, we cannot include all of Flathub by default. But Flathub already supports subsets. Fedora can safely enable the floss subset by default, and replace the “Enable Third-Party Repositories” button with an “Enable Proprietary Software Sources” button that would allow users to switch from the floss subset to the full Flathub if they so choose.
This goal can be implemented today, but we should wait because Flathub has some problems that we ought to fix first. More on that below.
All Default Applications are Fedora Flatpak Applications
All applications installed by default in Fedora Workstation should be Fedora Flatpaks. (Or almost all. Certain exceptions, like gnome-control-center, would make more sense as part of the OS image rather than as a Flatpak.)
Notice that I said Fedora Flatpaks, not Flathub. Fedora surely does need to control the handful of applications that are shipped by default. We don’t want to be at the mercy of Flathub to provide the core user experience.
With the exception of the default Fedora Flatpak applications, Flathub should be the only source of applications in GNOME Software.
It will soon be time to turn off GNOME Software’s support for installing RPM applications, making it a Flatpak-only software center by default. (Because GNOME Software uses a plugin architecture, users of traditional package-based Fedora who want to use GNOME Software to install RPM applications would still be able to do so by installing a subpackage providing a plugin, if desired.)
This requirement is an end goal. It can be done today, but it doesn’t necessarily need to be an immediatenext step.
Flathub Must Improve
Flathub has a few serious problems, and needs to make some policy changes before Fedora enables it by default. I’ll discuss this in more detail next.
Fedora Must Help
We should not make demands of Flathub without helping to implement them. Fedora has a large developer community and significant resources. We must not barge in and attempt to take over the Flathub project; instead, let’s increase our activity in the Flathub community somewhat, and lend a hand where requested.
The Case for Fedora Flatpaks
Earlier this year, Yaakov presented The Case for Fedora Flatpaks. This is the strongest argument I’ve seen in favor of Fedora Flatpaks. It complains about five problems with Flathub:
Lack of source and build system provenance: on this point, Yaakov is completely right. This is a serious problem, and it would be unacceptable for Fedora to embrace Flathub before it is fixed. More on this below.
Lack of separation between FOSS, legally encumbered, and proprietary software: this is not a real problem. Flathub already has a floss subset to separate open source vs. proprietary software; it may not be a separate repository, but that hardly matters because subsets allow us to achieve an equivalent user experience. Then there is indeed no separate subset for legally-encumbered software, but this also does not matter. Desktop users invariably wish to install encumbered software; I have yet to meet a user who does not want multimedia playback to work, after all. Fedora cannot offer encumbered multimedia codecs, but Flathub can, and that’s a major advantage for Flathub. Users and operating systems can block the multimedia extensions if truly desired. Lastly, some of the plainly-unlicensed proprietary software currently available on Flathub does admittedly seem pretty clearly outrageous, but if this is a concern for you, simply stick to the floss subset.
Lack of systemic upgrading of applications to the latest runtime: again, Yaakov is correct. This is a serious problem, and it would be unacceptable for Fedora to embrace Flathub before it is fixed. More on this below.
Lack of coordination of changes to non-runtime dependencies: this is a difference from Fedora, but it’s not necessarily a problem. In fact, allowing applications to have different versions of dependencies can be quite convenient, since upgrading dependencies can sometimes break applications. It does become a problem when bundled dependencies become significantly outdated, though, as this creates security risk. More on this below.
Lack of systemic community engagement: it’s silly to claim that Flathub has no community. Unresponsive Flathub maintainers are a real problem, but Fedora has an unresponsive maintainer problem too, so this can hardly count as a point against Flathub. That said, yes, Flathub needs a better way to flag unresponsive maintainers.
So now we have some good reasons to create Fedora Flatpaks. But maintaining Flatpaks is a tremendous effort. Is it really worth doing if we can improve Flathub instead?
Flathub Must Improve
I propose the following improvements:
Open source software must be built from source on trusted infrastructure.
Applications must not depend on end-of-life runtimes.
Applications must use flatpak-external-data-checker to monitor bundled dependencies wherever possible.
Sandbox holes must be phased out, except where this is fundamentally technically infeasible.
Let’s discuss each point in more detail.
Build Open Source from Source
Open source software can contain all manner of vulnerabilities. Although unlikely, it might even contain malicious backdoors. Building from source does nothing to guarantee that the software is in any way safe to use (and if it’s written in C or C++, then it’s definitely not safe). But it sets an essential baseline: you can at least be confident that the binary you install on your computer actually corresponds to the provided source code, assuming the build infrastructure is trusted and not compromised. And if the package supports reproducible builds, then you can reliably detect malicious infrastructure, too!
In contrast, when shipping a prebuilt binary, whoever built the binary can easily insert an undetectable backdoor; there is no need to resort to stealthy obfuscation tactics. With proprietary software, this risk is inherent and unavoidable: users just have to accept the risk and trust that whoever built the software is not malicious. Fine. But users generally do not expect this risk to extend to open source software, because all Linux operating systems fortunately require open source software to be built from source. Open source software not built from source is unusual and is invariably treated as a serious bug.
Flathub is different. On Flathub, shipping prebuilt binaries of open source software is, sadly, a common accepted practice. Here are several examples.Flathub itself admits that around 6% of its software is not built from source, so this problem is pervasive, not an isolated issue. (Although that percentage unfortunately considers proprietary software in addition to open source software, overstating the badness of the problem, because building proprietary software from source is impossible and not doing so is not a problem.)Update: I’ve been advised that I misunderstood the purpose of extra-data. Most apps that ship prebuilt binaries do not use extra-data. I’m not sure how many apps are shipping prebuilt binaries, but the problem is pervasive.
Security is not the only problem. In practice, Flathub applications that do not build from source sometimes package binaries only for x86_64, leaving aarch64 users entirely out of luck, even though Flathub normally supports aarch64, an architecture that is important for Fedora. This is frequently cited by Flathub’s opponents as major disadvantage relative to Fedora Flatpaks.
A plan to fix this should exist before Fedora enables Flathub by default. I can think of a few possible solutions:
Create a new subset for open source software not built from source, so Fedora can filter out this subset. Users can enable the subset at their own risk. This is hardly ideal, but it would allow Fedora to enable Flathub without exposing users to prebuilt open source software.
Declare that any software not built from source should be treated equivalent to proprietary software, and moved out of the floss subset. This is not quite right, because it is open source, but it has the same security and trust characteristics of proprietary software, so it’s not unreasonable either.
Set a flag date by which any open source software not built from source must be delisted from Flathub. I’ll arbitrarily propose July 1, 2027, which should be a generous amount of time to fix apps. This is my preferred solution. It can also be combined with either of the above.
Some of the apps not currently built from source are Electron packages. Electron takes a long time to build, and I wonder if building every Electron app from source might overwhelm Flathub’s existing build infrastructure. We will need some sort of solution to this. I wonder if it would be possible to build Electron runtimes to provide a few common versions of Electron. Alternatively, Flathub might just need more infrastructure funding.
Tangent time: a few applications on Flathub are built on non-Flathub infrastructure, notably Firefox and OBS Studio. It would be better to build everything on Flathub’s infrastructure to reduce risk of infrastructure compromise, but as long as this practice is limited to only a few well-known applications using trusted infrastructure, then the risk is lower and it’s not necessarily a serious problem. The third-party infrastructure should be designed thoughtfully, and only the infrastructure should be able to upload binaries; it should not be possible for a human to manually upload a build. It’s unfortunately not always easy to assess whether an application complies with these guidelines or not. Let’s consider OBS Studio. I appreciate that it almost follows my guidelines, because the binaries are normally built by GitHub Actions and will therefore correspond with the project’s source code, but I think a malicious maintainer could bypass that by uploading a malicious GitHub binary release? This is not ideal, but fortunately custom infrastructure is an unusual edge case, rather than a pervasive problem.
Penalize End-of-life Runtimes
When a Flatpak runtime reaches end-of-life (EOL), it stops receiving all updates, including security updates. How pervasive are EOL runtimes on Flathub? Using the Runtime Distribution section of Flathub Statistics and some knowledge of which runtimes are still supported, I determined that 994 out of 3,438 apps are currently using an EOL runtime. Ouch. (Note that the statistics page says there are 3,063 total desktop apps, but for whatever reason, the number of apps presented in the Runtime Distribution graph is higher. Could there really be 375 command line apps on Flathub?)
Using an EOL runtime is dangerous and irresponsible, and developers who claim otherwise are not good at risk assessment. Some developers will say that security does not matter because their app is not security-critical. It’s true that most security vulnerabilities are not actually terribly important or worth panicking over, but this does not mean it’s acceptable to stop fixing vulnerabilities altogether. In fact, security matters for most apps. A few exceptions would be apps that do not open files and also do not use the network, but that’s really probably not many apps.
I recently saw a developer use the example of a music player application to argue that EOL runtimes are not actually a serious problem. This developer picked a terrible example. Our hypothetical music player application can notably open audio files. Applications that parse files are inherently high risk because users love to open untrusted files. If you give me a file, the first thing I’m going to do is open it to see what it is. Who wouldn’t? Curiosity is human nature. And a music player probably uses GStreamer, which puts it at the veryhighesttier of security risk (alongside your PDF reader, email client, and web browser). I know of exactly one case of a GNOME user being exploited in the wild: it happened when the user opened a booby-trapped video using Totem, GNOME’s GStreamer-based video player. At least your web browser is guaranteed to be heavily sandboxed; your music player might very well not be.
The Flatpak sandbox certainly helps to mitigate the impact of vulnerabilities, but sandboxes are intended to be a defense in depth measure. They should not be treated as a primary security mechanism or as an excuse to not fix security bugs. Also, too Flatpak many apps subvert the sandbox entirely.
Of course, each app has a different risk level. The risk of you being attacked via GNOME Calculator is pretty low. It does not open files, and the only untrusted input it parses is currency conversion data provided by the International Monetary Fund. Life goes on if your calculator is unmaintained. Any number of other applications are probably generally safe. But it would be entirely impractical to assess 3000 different apps individually to determine whether they are a significant security risk or not. And independent of security considerations, use of an EOL runtime is a good baseline to determine whether the application is adequately maintained, so that abandoned apps can be eventually delisted. It would not be useful to make exceptions.
The solution here is simple enough:
It should not be possible to build an application that depends on an EOL runtime, to motivate active maintainers to update to a newer runtime. Flathub already implemented this rule in the past, but it got dropped at some point.
An application that depends on an EOL runtime for too long should eventually be delisted. Perhaps 6 months or 1 year would be good deadlines.
A monitoring dashboard would make it easier to see which apps are using maintained runtimes and which need to be fixed.
Monitor Bundled Dependencies
Flatpak apps have to bundle any dependencies not present in their runtime. This creates considerable security risk if the maintainer of the Flathub packaging does not regularly update the dependencies. The negative consequences are identical to using an EOL runtime.
Fortunately, Flathub already has a tool to deal with this problem: flatpak-external-data-checker. This tool automatically opens pull requests to update bundled dependencies when a new version is available. However, not all applications use flatpak-external-data-checker, and not all applications that do use it do so for all dependencies, and none of this matters if the app’s packaging is no longer maintained.
I don’t know of any easy ways to monitor Flathub for outdated bundled dependencies, but given the number of apps using EOL runtimes, I assume the status quo is pretty bad. The next step here is to build better monitoring tools so we can better understand the scope of this problem.
Phase Out Most Sandbox Holes (Eventually)
Applications that parse data are full of security vulnerabilities, like buffer overflows and use-after-frees. Skilled attackers can turn these vulnerabilities into exploits, using carefully-crafted malicious data to gain total control of your user account on your computer. They can then install malware, read all the files in your home directory, use your computer in a botnet, and do whatever else they want with it. But if the application is sandboxed, then a second type of exploit, called a sandbox escape, is needed before the app can harm your host operating system and access your personal data, so the attacker now has to exploit two vulnerabilities instead of just one. And while app vulnerabilities are extremely common, sandbox escapes are, in theory, rare.
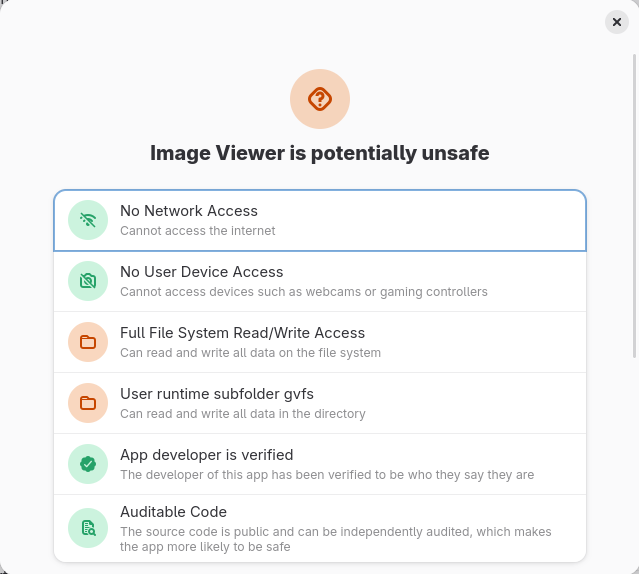
In theory, Flatpak apps are drastically safer than distro-packaged apps because Flatpak provides a strong sandbox by default. The security benefit of the sandbox cannot be understated: it is amazing technology and greatly improves security relative to distro-packaged apps. But in practice, Flathub applications routinely subvert the sandbox by using expansive static permissions to open sandbox holes. Flathub claims that it carefully reviews apps’ use of static permissions and allows only the most narrow permissions that are possible for the app to function properly. This claim is dubious because, in practice, the permissions of actual apps on Flathub are extremely broad, as often as not making a total mockery of the sandbox.
While some applications use sandbox holes out of laziness, in many cases it’s currently outright impossible to sandbox the application without breaking key functionality. For example, Sophie has documented many problems that necessitate sandbox holes in GNOME’s image viewer, Loupe. These problems are fixable, but they require significant development work that has not happened yet. Should we punish the application by requiring it to break itself to conform to the requirements of the sandbox? The Flathub community has decided that the answer is no: application developers can, in practice, use whatever permissions they need to make the app work, even if this entirely subverts the sandbox.
This was originally a good idea. By allowing flexibility with sandbox permissions, Flathub made it very easy to package apps, became extremely popular, and allowed Flatpak itself to become successful. But the original understanding of the Flatpak community was that this laxity would be temporary: eventually, the rules would be tightened and apps would be held to progressively higher standards, until sandbox holes would eventually become rare. Unfortunately, this is taking too long. Flatpak has been around for a decade now, but this goal is not within reach.
Tightening sandbox holes does not need to be a blocker for adopting Flathub in Fedora because it’s not a problem relative to the status quo in Fedora. Fedora Flatpaks have the exact same problem, and Fedora’s distro-packaged apps are not sandboxed at all (with only a few exceptions, like your web browser). But it’s long past time to at least make a plan for how to eventually phase out sandbox holes wherever possible. (In some cases, it won’t ever be possible; e.g. sandboxing a file manager or disk usage analyzer does not make any sense.) It’s currently too soon to use sticks to punish applications for having too many sandbox holes, but sticks will be necessary eventually, hopefully within the next 5 years. In the meantime, we can immediately begin to use carrots to reward app developers for eliminating holes. We will need to discuss specifics.
We also need more developers to help improve xdg-desktop-portal, the component that allows sandboxed apps to safely access resources on the host system without using sandbox holes. This is too much work for any individual; it will require many developers working together.
Software Source Prioritization
So, let’s say we successfully engage with the Flathub project and make some good progress on solving the above problems. What should happen next?
Fedora is a community of doers. We cannot tell Fedora contributors to stop doing work they wish to do. Accordingly, it’s unlikely that anybody will propose to shut down the Fedora Flatpak project so long as developers are still working on it. Don’t expect that to happen.
However, this doesn’t mean Fedora contributors have a divine right for their packaged applications to be presented to users by default. Each Fedora edition (or spin) should be allowed to decide for itself what should be presented to the user in its software center. It’s time for the Fedora Engineering Steering Committee (FESCo) to allow Fedora editions to prefer third-party content over content from Fedora itself.
We have a few options as to how exactly this should work:
We could choose to unconditionally prioritize all Flathub Flatpaks over Fedora Flatpaks, as I proposed earlier this year (Workstation ticket, LWN coverage). The precedence in GNOME Software would be Flathub > Fedora Flatpaks.
Alternatively, we could leave Fedora Flatpaks with highest priority, and instead apply a filter such that only Fedora Flatpaks that are installed by default are visible in GNOME Software. This is my preferred solution; there is already an active change proposal for Fedora 43 (proposal, discussion), and it has received considerable support from the Fedora community. Although the proposal only targets atomic editions like Silverblue and Kinoite for now, it makes sense to extend it to Fedora Workstation as well. The precedence would be Filtered Fedora Flatpaks > Flathub.
When considering our desired end state, we can stop there; those are the only two options because of my “All Other Applications are Flathub Flatpaks” requirement: in an atomic OS, it’s no longer possible to install RPM-packaged applications, after all. But in the meantime, as a transitional measure, we still need to consider where RPMs fit in until such time that Fedora Workstation is ready to remove RPM applications from GNOME Software.
We have several possible precedence options. The most obvious option, consistent with my proposals above, is: Flathub > Fedora RPMs > Fedora Flatpaks. And that would be fine, certainly a huge improvement over the status quo, which is Fedora Flatpaks > Fedora RPMs > Flathub.
But we could also conditionally prioritize Flathub Flatpaks over Fedora Flatpaks or Fedora RPMs, such that the Flathub Flatpak is preferred only if it meets certain criteria. This makes sense if we want to nudge Flathub maintainers towards adopting certain best practices we might wish to encourage. Several Fedora users have proposed that we prefer Flathub only if the app has Verified status, indicating that the Flathub maintainer is the same as the upstream maintainer. But I do not care very much whether the app is verified or not; it’s perfectly acceptable for a third-party developer to maintain the Flathub packaging if the upstream developers do not wish to do so, and I don’t see any need to discourage this. Instead, I would rather consider whether the app receives a Probably Safe safety rating in GNOME Software. This would be a nice carrot to encourage app developers to tighten sandbox permissions. (Of course, this would be a transitional measure only, because eventually the goal is for Flathub to be the only software source.)
There are many possible outcomes here, but here are my three favorites, in order:
My favorite option: Filtered Fedora Flatpaks > Probably Safe Flathub > Fedora RPMs > Potentially Unsafe Flathub. Fedora Flatpaks take priority, but this won’t hurt anything because only applications shipped by default will be available, and those will be the ones that receive the most testing. This is not a desirable end state because it is complicated and it will be confusing to explain to users why a certain software source was preferred. But in the long run, when Fedora RPMs are eventually removed, it will simplify to Filtered Fedora Flatpaks > Flathub, which is elegant.
A simple option, the same thing but without the conditional prioritization: Filtered Fedora Flatpaks > Flathub > Fedora RPMs.
Alternative option: Probably Safe Flathub > Fedora RPMs > Potentially Unsafe Flathub > Unfiltered Fedora Flatpaks. When Fedora RPMs are eventually removed, this will simplify to Flathub > Unfiltered Fedora Flatpaks. This alternative option behaves almost the same as the above, except allows users to manually select the Fedora Flatpak if they wish to do so, rather than filtering them out. But there is a significant disadvantage: if you uninstall an application that is installed by default, then reinstall the application, it would come from Flathub rather than Fedora Flatpaks, which is unexpected. So we’ll probably want to hardcode exceptions for default apps to prefer Fedora Flatpaks.
The corresponding simple option without conditional prioritization: Flathub > Fedora RPMs > Unfiltered Fedora Flatpaks.
Any of these options would be fine.
Conclusion
Flathub is, frankly, not safe enough to be enabled by default in Fedora Workstation today. But these problems are fixable. Helping Flathub become more trustworthy will be far easier than competing against it by maintaining thousands of Fedora Flatpaks. Enabling Flathub by default should be a strategic priority for Fedora Workstation.
I anticipate a lively debate on social media, on Matrix, and in the comments. And I am especially eager to see whether the Fedora and Flathub communities accept my arguments as persuasive. FESCo will be considering the Filter Fedora Flatpaks for Atomic Desktops proposal imminently, so the first test is soon.
WebKitGTK has a bunch of different confusing API versions. Here are the three API versions that are currently supported by upstream:
webkitgtk-6.0: This is WebKitGTK for GTK 4 (and libsoup 3), introduced in WebKitGTK 2.40. This is what’s built by default if you build WebKit with -DPORT=GTK.
webkit2gtk-4.1: This is WebKitGTK for GTK 3 and libsoup 3, introduced in WebKitGTK 2.32. Get this by building with -DPORT=GTK -DUSE_GTK3=ON.
webkit2gtk-4.0: This is WebKitGTK for GTK 3 and libsoup 2, introduced in WebKitGTK 2.6. Get this by building with -DPORT=GTK -DUSE_GTK3=ON -DUSE_SOUP2=ON.
webkitgtk-6.0 contains a bunch of API changes, and all deprecated APIs were removed. If you’re upgrading to webkitgtk-6.0, then you’re also upgrading your application from GTK 3 to GTK 4, and have to adapt to much bigger GTK API changes anyway, so this seemed like a good opportunity to break compatibility and fix old mistakes for the first time in a very long time.
webkit2gtk-4.1 is exactly the same as webkit2gtk-4.0, except for the libsoup API version that it links against.
webkit2gtk-4.0 is — remarkably — mostly API stable since it was released in September 2014. Some particular C APIs have been deprecated and don’t work properly anymore, but no stable C APIs have been removed during this time, and library ABI is maintained. (Caveat: WebKitGTK used to have unstable DOM APIs, some of which were removed before the DOM API was eventually stabilized. Nowadays, the DOM APIs are all stable but deprecated in webkit2gtk-4.1 and webkit2gtk-4.0, and removed in webkitgtk-6.0.)
If you are interested in history, here are the older API versions that do not matter anymore:
webkit2gtk-5.0: This was an unstable API version used during development of the GTK 4 API, intended for WebKit developers rather than application developers. It was obsoleted by webkitgtk-6.0.
webkit2gtk-3.0: original API version of WebKitGTK for GTK 3 and libsoup 2, obsoleted by webkit2gtk-4.0. This was the original “WebKit 2” API version, which was only used by a few applications before it was removed one decade ago (history).
webkitgtk-3.0: note the missing “2”, this is “WebKit 1” (predating the modern multiprocess architecture) for GTK 3. This API version was widely-used on Linux, and its removal one decade ago precipitated a security crisis which I called The Great API Break. (This crisis was worth it. Modern WebKit’s multiprocess architecture is far more secure than the old single-process architecture.)
webkitgtk-1.0: the original WebKitGTK API version, this is “WebKit 1” for GTK 2. This API version was also widely-used on Linux before it was removed in The Great API Break.
Fedora and RHEL users, are you confused by all the different confusing downstream package names? Here is your map:
webkitgtk6.0, webkit2gtk4.1, and webkit2gtk4.0: This is the current binary package naming in Fedora, corresponding precisely to the WebKitGTK API version to reduce confusion.
webkit2gtk3: old name for webkit2gtk4.0, still used in RHEL 9 and RHEL 8
webkitgtk4: even older name for webkit2gtk4.0, still used in RHEL 7
webkitgtk3: this is the webkitgtk-3.0 API version, still used in RHEL 7
webkitgtk: this is webkitgtk-1.0, used in RHEL 6
Notably, webkit2gtk4.0, webkit2gtk3, and webkitgtk4 are all the same thing.
Be cautious with unexpected private message invites. Do not accept private message invites from users you do not recognize. If you want to talk to somebody who has rejected your invite, contact them in a public room first.
I don’t normally blog about particular CVEs, but Yelp CVE-2025-3155 is noteworthy because it is quite severe, public for several weeks now, and not yet fixed upstream. In short, help files can read your filesystem and execute arbitrary JavaScript code, allowing an attacker to exfiltrate any files your Unix user has access to. Thank you to parrot409 for responsibly disclosing this issue and going above and beyond to provide patches.
By default, all major browsers allow websites to download files automatically, without user interaction, so installing a malicious help file into your Downloads directory is simple. (If you ever find an unexpected file in your Downloads directory, be careful and maybe don’t open it. Cautious users may wish to configure their browsers to prompt before saving a download.)
The malicious website would next attempt to open the special URL ghelp:///proc/self/cwd/Downloads. This relies on the assumption that the web browser runs with your home directory as current working directory, which in practice will generally be true when launched from your desktop environment.
Chrome and Firefox prompt the user for permission before launching Yelp. If you grant permission, then Yelp launches and you lose. Don’t grant permission. Beware: both browsers have an “always allow” checkbox, and you won’t be prompted for permission if you’ve ever checked it when opening a ghelp URL in the past.
Epiphany does not prompt the user for permission before opening the URL. Minimal user interaction is required for the attacker to win. If you use Epiphany or any other browser that opens links in external programs without user confirmation, you should immediately uninstall Yelp, or at least change your Downloads directory to something nonstandard.
February 24: The reporter proposes these patches to fix the issue.
March 26: The 90 day disclosure deadline is reached, so I make the issue report public even though it is not yet fixed. At this point, due to insufficient creativity, I incorrectly assume the issue is likely to be used only in targeted attacks, because it seems to require the attacker to know the path to your downloads directory, which will normally include your Unix username.
April 5: The bug reporter posts a detailed write-up including a nice GIF to demonstrate the attack exfiltrating ~/.ssh/id_rsa in Chrome. This attack uses /proc/self/cwd/Downloads, bypassing the requirement to know your Unix username.
April 13: GNOME Security is notified of the write-up.
If you are a Linux operating system vendor, please consider applying the provided patches even though they have not yet been accepted upstream. They’re probably not worse than the status quo!
Update: On June 12, 2025, Yelp 42.3 and yelp-xsl 42.3 were released, fixing this issue. Also, on April 21 I released Epiphany 48.1, which prevents downloaded files from being opened automatically.
It has been a year and a half since my previous GNOME core apps update. Last time, for GNOME 45, GNOME Photos was removed from GNOME core without replacement, and Loupe and Snapshot (user-facing names: Image Viewer and Camera) entered, replacing Eye of GNOME and Cheese, respectively. There were no core app changes in GNOME 46 or 47.
Now for GNOME 48, Decibels (Audio Player) enters GNOME core. Decibels is intended to close a longstanding flaw in GNOME’s core app set: ever since Totem (Videos) hid its support for opening audio files, there has been no easy way to open an audio file using GNOME core apps. Totem could technically still do so, but you would have to know to attempt it manually. Decibels fixes this problem. Decibels is a simple app that will play your audio file and do nothing else, so it will complement GNOME Music, the music library application. Decibels is maintained by Shema Angelo Verlain and David Keller (thank you!) and is notably the only GNOME core app that is written in TypeScript.
Looking to the future, the GNOME Incubator project tracks future core apps to ensure there is sufficient consensus among GNOME distributors before an app enters core. Currently Papers (future Document Viewer, replacing Evince) and Showtime (future Videos or possibly Video Player, replacing Totem) are still incubating. Applications in Incubator are not yet approved to enter core, so it’s not a done deal yet, but I would expect to see these apps enter core sooner rather than later, hopefully for GNOME 49. Now is the right time for GNOME distributors to provide feedback on these applications: please don’t delay!
On a personal note, I have recently left the GNOME release team to reduce my workload, so I no longer have any direct role in managing the GNOME core apps or Incubation process. But I think it makes sense to continue my tradition of reporting on core app changes anyway!
We all think we’re smart enough to not be tricked by a phishing attempt, right? Unfortunately, I know for certain that I’m not, because I entered my GitHub password into a lookalike phishing website a year or two ago. Oops! Fortunately, I noticed right away, so I simply changed my unique, never-reused password and moved on. But if the attacker were smarter, I might have never noticed. (This particular attack website was relatively unsophisticated and proxied only an unauthenticated view of GitHub, a big clue that something was wrong. Update: I want to be clear that it would have been very easy for the attacker to simply redirect me to the real github.com after stealing my credentials, in which case I would not have noticed the attack and would not have known to change my password.)
You might think multifactor authentication is the best defense against phishing. Nope. Although multifactor authentication is a major security improvement over passwords alone, and the particular attack that tricked me did not attempt to subvert multifactor authentication, it’s actually unfortunately pretty easy for phishers to defeat most multifactor authentication if they wish to do so:
Multifactor authentication based on phone calls is also insecure (because SIM swapping isn’t going away; determined attackers will steal your phone number if it’s an obstacle to them)
Multifactor authentication based on authenticator apps (using TOTP or HOTP) is much better in general, but still fails against phishing. When you paste your one-time access code into a phishing website, the phishing website can simply “proxy” the access code you kindly provided to them by submitting it to the real website. This only allows authenticating once, but once is usually enough.
Fortunately, there is a solution: passkeys. Based on FIDO2 and WebAuthn, passkeys resist phishing because the authentication process depends on the domain of the service that you’re actually connecting to. If you think you’re visiting https://example.com, but you’re actually visiting a copycat website with a Cyrillic а instead of Latin a, then no worries: the authentication will fail, and the frustrated attacker will have achieved nothing.
The most popular form of passkey is local biometric authentication running on your phone, but any hardware security key (e.g. YubiKey) is also a good bet.
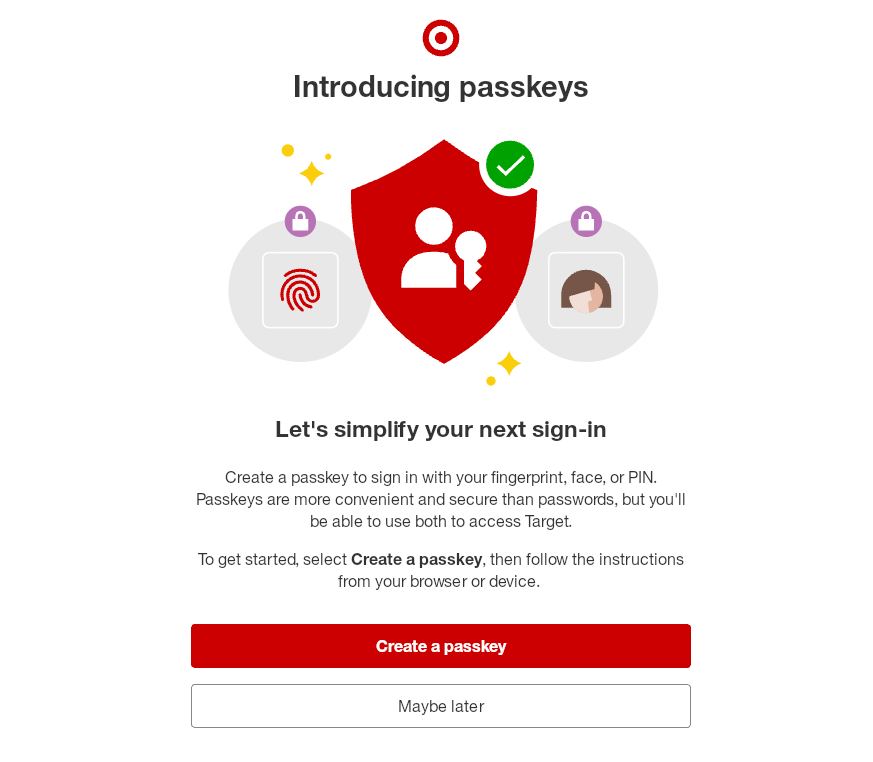
target.com Is More Secure than Your Bank!
I am not joking when I say that target.com is more secure than your bank (which is probably still relying on SMS or phone calls, and maybe even allows you to authenticate using easily-guessable security questions):
target.com is introducing passkeys!
Good job for supporting passkeys, Target.
It’s probably perfectly fine for Target to support passkeys alongside passwords indefinitely. Higher-security websites that want to resist phishing (e.g. your employer’s SSO service) should consider eventually allowing only passkeys.
No Passkeys in WebKitGTK
Unfortunately for GNOME users, WebKitGTK does not yet support WebAuthn, so passkeys will not work in GNOME Web (Epiphany). That’s my browser of choice, so I’ve never touched a passkey before and don’t actually know how well they work in practice. Maybe do as I say and not as I do? If you require high security, you will unfortunately need to use Firefox or Chrome instead, at least for the time being.
Why Was Michael Visiting a Fake github.com?
The fake github.com appeared higher than the real github.com in the DuckDuckGo search results for whatever I was looking for at the time. :(
Good news: exploiting memory safety vulnerabilities is becoming more difficult. Traditional security vulnerabilities will remain a serious threat, but attackers prefer to take the path of least resistance, and nowadays that is to attack developers rather than the software itself. Once the attackers control your computer, they can attempt to perform a supply chain attack and insert backdoors into your software, compromising all of your users at once.
If you’re a software developer, it’s time to start focusing on the possibility that attackers will target you personally. Yes, you. If you use Linux, macOS, or Windows, take a moment to check your home directory for a hidden .n2 folder. If it exists, alas! You have been hacked by the North Koreans. (Future malware campaigns will presumably be more stealthy than this.)
Attackers who target developers are currently employing two common strategies:
Fake job interview: you’re applying to job postings and the recruiter asks you to solve a programming problem of some sort, which involves installing software from NPM (or PyPI, or another language ecosystem’s package manager).
Fake debugging request: you receive a bug report and the reporter helpfully provides a script for reproducing the bug. The script may have dependencies on packages in NPM (or PyPI, or another language ecosystem’s package manager) to make it harder to notice that it’s malware. I saw a hopefully innocent bug report that was indistinguishable from such an attack just last week.
But of course you would never execute such a script without auditing the dependencies thoroughly! (Insert eyeroll emoji here.)
By now, most of us are hopefully already aware of typosquatting attacks, and the high risk that untrustworthy programming language packages may be malicious. But you might not have considered that attackers might target you personally. Exercise caution whenever somebody asks you to install packages from these sources. Take the time to start a virtual machine before running the code. (An isolated podman container probably works too?) Remember, attackers will target the path of least resistance. Virtualization or containerization raises the bar considerably, and the attacker will probably move along to an easier target.
Vala programmers probably already know that a Vala array is equivalent to a C array plus an integer size. (Unfortunately, the size is gint rather than size_t, which seems likely to be a source of serious bugs.) When you create an array in Vala, the size is set for you automatically by Vala. But what happens when receiving an array that’s created by a library?
Here is an example. I recently wanted to use the GTK function gdk_texture_new_for_surface(), which converts from a cairo_surface_t to a GdkTexture, but unfortunately this function is internal to GTK (presumably to avoid exposing more cairo stuff in GTK’s public API). I decided to copy it into my application, which is written in Vala. I could have put it in a separate C source file, but it’s nicer to avoid a new file and rewrite it in Vala. Alas, I hit an array size roadblock along the way.
Now, gdk_texture_new_for_surface() calls cairo_image_surface_get_data() to return an array of data to be used for creating a GBytes object to pass to gdk_memory_texture_new(). The size of the array is cairo_image_surface_get_height (surface) * cairo_image_surface_get_stride (surface). This is GTK’s code to create the GBytes object:
Notice it takes both the array data and its size size. But because Vala arrays already know their size, Vala bindings do not contain a separate parameter for the size of the array. The corresponding Vala API looks like this:
public Bytes.with_free_func (owned uint8[]? data, DestroyNotify? free_func, void* user_data)
Notice there is no way to pass the size of the data array, because the array is expected to know its own size.
I actually couldn’t figure out how to pass a DestroyNotify in Vala. There’s probably some way to do it (please let me know in the comments!), but I don’t know how. Anyway, I compromised by creating a GBytes that copies its data instead, using this simpler constructor:
public Bytes (uint8[]? data)
My code looked something like this:
unowned uchar[] data = surface.get_data ();
return new Gdk.MemoryTexture (surface.get_width (),
                              surface.get_height (),
                              BYTE_ORDER == ByteOrder.LITTLE_ENDIAN ? Gdk.MemoryFormat.B8G8R8A8_PREMULTIPLIED : Gdk.MemoryFormat.A8R8G8B8_PREMULTIPLIED,
                              new Bytes (data),
                              surface.get_stride ());
But this code crashes because the size of data is unset. Without any clear way to pass the size of the array to the Bytes constructor, I was initially stumped.
My first solution was to create my own array on the stack, use Posix.memcpy to copy the data to my new array, then pass the new array to the Bytes constructor. And that actually worked! But now the data is being copied twice, when the C version of the code doesn’t need to copy the data at all. I knew I had to copy the data at least once (because I didn’t know how else to manually call cairo_surface_destroy() and cairo_surface_ref() in Vala, at least not without resorting to custom language bindings), but copying it twice seemed slightly egregious.
It’s that simple. Vala arrays have a length property, and you can assign to it. In this case, the bindings didn’t know how to set the length, so it defaulted to the maximum possible value, leading to the crash. After setting the length manually, the code worked properly. Here it is.