On automatic bugreports

I’ve been looking at some nasty nautilus crashers this week, including bug 343488 which has several hundreds of duplicates in bugzilla. Thankfully the bug team has managed to mark all of these as duplicates, or this would be a major undertaking.

One problem with autogenerated bugreports like this is the lack of information in them. All they have is a backtrace (generally without debug information, i.e. pretty useless) and a short line of text saying what the reporter did at the time. You can get a better feeling for the bug by reading a lot of the duplicates and try to detect common patterns, but this only works sometimes.

Thanks to the miracle of separate debug info and debuginfo packages (which I created back in 2002) its now pretty easy to have a user create a backtrace with debug information. This makes the backtraces much more useful, and we eventually got someone to report a nice backtrace for the bug.

Sometimes that is not really enought, like in the case of this hard to reproduce bug. To verify my suspicions I really needed to see the stderr output from nautilus to verify that an assertion warning triggered. But the output from nautilus isn’t normally visible as nautilus isn’t started from a terminal. We eventually managed to find someone who could reproduce this and send us the end of ~/.xsession-errors which had the suspected output.

This got me thinking a bit. If that information had been availible in the automatic bug reports it would have been much easier to find this bug, and similarly with all crashes that spew several warnings or asserts before crashing. So, I wrote a patch for bug-buddy to output some extra information when it creates crash dumps.

The patch also adds some information on the kernel used, the X server used, whether accessibility is enabled and the selinux mode. I hope we’ll get this out to users soon so that we can do a better job fixing bugs.

Ascending from the ninth circle of X hell

I’ve spent most of yesterday and today in the ninth circle of X hell, also known as XKB onfiguration. However, I’m now starting to see the light from above.

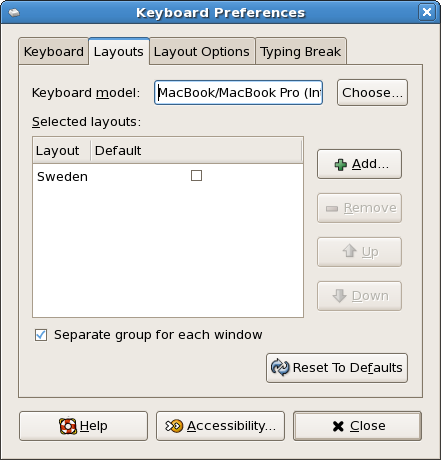
Why would anyone willingly look at XKB configuration you might ask. Well, I recently got a MacBook Pro, and the keyboard layout it used is slightly different than the regular pc105 keyboard. The main problems are that the key to the left of “1” and the key to the left of “z” somehow got their keycodes swapped, and the fact that there is no right Alt which means its hard to type certain symbols (there is a right Apple key though).

There are various places on the internet that shows you the magic xmodmap incantations you need to “fix” this, but I wanted a real fix that would let anyone set up a MacBook keyboard. So, I set out to add XKB configuration that lets you use the gnome control center to pick the right keyboard.

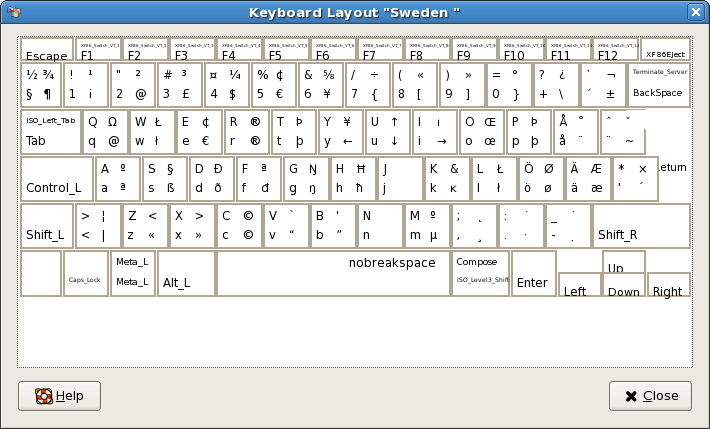
So, I proudly present the result of my labor:

I added not only fixes for the keycodes, I also added the correct symbol for the eject button, a geometry description, and an option to make the apple keys act as Alt (since they are in the normal Alt positions).

There seems to be some redraw bug in the applet, because the return key isn’t rendered right.

I’ve already build the patch in Fedora Core (development), and the upstreams patch is availible here.

Continuing adventures of bonobo and gnome-vfs

After some discussion with Michael Meeks about yesterdays post we decided to move the problematic gnome-vfs functions to libbonobo, so that we can totally avoid bonobo in gnome-vfs. This is ok, since these functions are useless unless you use bonobo yourself, so you’ll be linking to libbonobo if you use them. In fact all old apps are guaranteed to do this since gnome-vfs pulled in libbonobo.

So, what happens is that the function declarations are in the gnome-vfs headers, but the actual implementation is in libbonobo. This means we can now push gnome-vfs much lower in the gnome build stack. It now only depends on glib, dbus, gconf and libxml.

There is only one minor issue. Since we don’t want gnome-vfs to depend on bonobo I had to remove a bonobo include from the gnome-vfs headers. Its likely that apps that use these functions already include this header, but if they don’t they can just add that include, or define GNOME_VFS_INCLUDE_BONOBO to make gnome-vfs include it. The only application in Gnome that uses these functions is evolution, and it didn’t need any modification to keep building.

Bonobo support method: dlopen

Earlier today I landed the dbus-vfs branch to gnome-vfs HEAD, which uses dbus for all communications with the gnome-vfs daemon. Also, gicmo moved the gnome-vfs monikers into a separate module, so we’re ready to remove bonobo from gnome-vfs now. Unfortuntately the gnome-vfs API has these calls in the public API:

Bonobo_ServerInfo * gnome_vfs_mime_get_default_component (const char *mime_type);
GList *             gnome_vfs_mime_get_all_components    (const char *mime_type);

This is unfortunate for two reasons. First of all it calls bonobo, so we have to link to and initialize the bonobo libaries, even if most gnome-vfs applications never ever call these functions (only evolution currently uses it). Secondly, the dependency on bonobo at buildtime puts gnome-vfs at a higher level in the build chain than we would like.

To solve the first problem I added some code to (optionally at build time) lazily dlopen and initialize bonobo only when needed. This means applications don’t have to link to bonobo when they don’t use it, but bonobo is still required at build time. (Check for the “Bonobo support method” output from configure.) Its slightly better, but ideally we would just not depend on bonobo at all.

I wonder if it would be possible to move these functions into libbonobo instead (they don’t really call any other gnome-vfs functions, not do they use types or data provided by gnome-vfs). That way we could totally avoid these problems.

Gtk+ printing support

Today we finally landed the printing branch of gtk+. This means that if you build gtk+ from cvs (what will become 2.10) you get support for page setup and print dialogs.

The actual printing is done through Cairo, which recently has gotten some kick-ass work from Carl Worth on the PDF and postscript backends. On windows cairo draws using GDI, so the native print drivers are used. In fact, on windows you even get the native print dialogs.

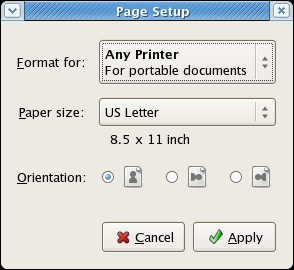
From a users perspective there are two new dialogs. First the Page Setup dialog:

This dialog lets you set up the page size, layout and the printer margins. This is enough to let the application lay out pages, and is typically used very early when writing a document.

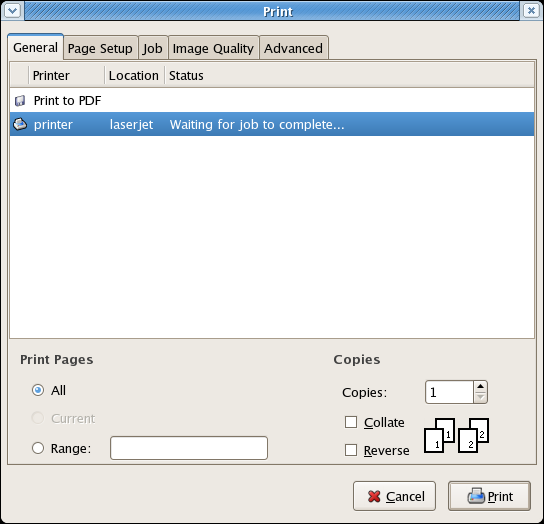
Then there is the actual print dialog:

You use this when you want to actually print the document. It lets you print to a printer or to a file. It also allows you to set all sorts of settings that control how the print job is handled. Some are generic, like what pages to print, and some are printer-specific like duplex or paper stapling.

This code is now mostly working, but we really need people to test it. So, anyone working on an application that prints, please port your app to this API and give us feedback on it. Its important that we get API feedback early so we can fix it early.

Nautilus memory use, part 2

Today I took the memory use analysis from
thursday
and started fixing the things I noticed.

First I changed the text embedded in icons so that we only read 10×5
characters normally, and re-read more only when icons are larger than
“normal”. Then I changed the PangoLayout handling in the icon
container so that PangoLayouts are cached only for icons that are
visible in the view.

I also made the icon cache a bit more aggressive in getting rid of old
old cached icons. We now free most of the cache when Nautilus has been
idle for some time. We didn’t use to do this, which means that the
cache could use quite some memory if the last thing you did was visit
a directory with lots of thumbnailed files.

With the testcase of just starting Nautilus, displaying my homedir in
a spatial icon-view window we had this before:

[alex@greebo tests]$ ./analyze-memdump -s nautilus_before.dat 
total size: 4848501
 unknown type: 1536818
 strings: 904063
 objects: 459112
 slice: 517976
 list headers: 137776
 pixbuf data: 1292756

And, after applying the patches:

[alex@greebo tests]$ ./analyze-memdump -s nautilus_after.dat 
total size: 3787194
 unknown type: 1019389
 strings: 503273
 objects: 452672
 slice: 399168
 list headers: 119936
 pixbuf data: 1292756

So, for this usecase we saved about one megabyte of heap. Not
bad. Furthermore, when you close the window most of the pixbuf data will be freed after a while.

All of this is commited to CVS, please test it out and report any
problems.

If you are interested in the current memory use status you can look at the
resulting
data file
generated after applying all the patches. (Use the
analyzer
app
).

Nautilus memory use analysis

Yesterday I hacked up a glib patch to track memory
use. Its a g_malloc replacement that has some memory type tracking features which are nicely integrated with common glib/gtk+ types.
All the app has to do is call g_mem_set_vtable(glib_mem_tracker_table)
the first thing you do in main, and then calling g_mem_track() will
write the full allocation information into a file called
“memtrack.dat” in the current directory. You can then use a separate
app to analyze this file at your leasure.

So, what does this give us for Nautilus? I started it, browsed
around a bit and ended with a window showing my homedir (which has about 600 files), then I triggered the memory dump. The
memory use summary is now:

./analyze-memdump -s nautilus-run-with-home.dat 
total size: 5201628
 unknown type: 1609963
 strings: 914293
 objects: 495264
 slice: 559180
 list headers: 165400
 pixbuf data: 1457528

So, we’re using about 5 megs of heap. Almost 1 meg of this is
strings, 1.5 meg is pixbufs. Lets look at what sort of strings we have:

./analyze-memdump -z nautilus-run-with-home.dat
file nautilus-file.c: 254163 bytes
file pango-layout.c: 180279 bytes
file gfileutils.c: 111728 bytes
file gstrfuncs.c: 63963 bytes
file gunicollate.c: 40120 bytes
file gnome-vfs-file-info.c: 32965 bytes
file gtkicontheme.c: 29314 bytes
file gnome-vfs-mime-info-cache.c: 24787 bytes
file gtkrc.c: 21428 bytes
file gconf-value.c: 20343 bytes
file gdataset.c: 20222 bytes
file nautilus-icon-canvas-item.c: 12314 bytes
...
string of size 64: 2020 (129280 bytes)
string of size 2048: 53 (108544 bytes)
string of size 1024: 106 (108544 bytes)
string of size 128: 147 (18816 bytes)
string of size 20: 868 (17360 bytes)
string of size 512: 33 (16896 bytes)
string of size 19: 869 (16511 bytes)
string of size 18: 839 (15102 bytes)
string of size 11: 1340 (14740 bytes)
string of size 60: 238 (14280 bytes)
string of size 16: 844 (13504 bytes)
string of size 14: 923 (12922 bytes)
...

Lots of strings in nautilus-file.c, lets look into that file:

 ./analyze-memdump -f nautilus-file.c nautilus-run-with-home.dat 
For the file 'nautilus-file.c':
 total size: 254163
  unknown type: 0
  strings: 254163
  objects: 0
  slice: 0
  list: 0
  pixbuf data: 0
block size 2048: 53 allocations (108544 bytes)
block size 1024: 106 allocations (108544 bytes)
block size 512: 32 allocations (16384 bytes)
block size 256: 7 allocations (1792 bytes)
block size 128: 4 allocations (512 bytes)
block size 64: 9 allocations (576 bytes)
block size 54: 1 allocations (54 bytes)
block size 48: 1 allocations (48 bytes)
line 2637: 5 bytes (1 allocations)
line 2675: 9 bytes (1 allocations)
line 4731: 32 bytes (2 allocations)
line 221: 37 bytes (8 allocations)
line 1397: 76 bytes (4 allocations)
line 284: 211 bytes (6 allocations)
line 1437: 17333 bytes (1001 allocations)
line 6063: 236460 bytes (217 allocations)

A lot of large strings, and they seem to all be from line 6063 of
nautilus-file.c. Looking at this code reveals that this is the memory
used for storing the first bit of text files so that we can show the
text in the icon. We only save the text in the first 80×24 chars of
the file, but perhaps we could save less of it and reload the data for
the uncommon case of a large icon that needs more text.

The string use in pango-layout.c isn’t suprising, as Nautilus stores
the PangoLayouts for each label in the icon view to be able to draw it
quickly without having to re-layout. Unfortunately PangoLayout also
stores a copy of the actual strings, which we don’t really need.

Looking back at the totals we have 0.5 meg of GObjects (although this
doesn’t include memory allocated by the objects). Lets have a look at
that:

./analyze-memdump -o nautilus-run-with-home.dat 
type 'NautilusVFSFile': 121080 bytes, 1009 objects
type 'PangoLayout': 88060 bytes, 1295 objects
type 'NautilusIconCanvasItem': 32256 bytes, 504 objects
type 'GtkAccelLabel': 28880 bytes, 190 objects
type 'GstPadTemplate': 27512 bytes, 362 objects
type 'PangoCairoFcFont': 24864 bytes, 111 objects
type 'GstElementFactory': 23856 bytes, 213 objects
type 'GtkImage': 15808 bytes, 152 objects
type 'GtkImageMenuItem': 15100 bytes, 151 objects
type 'GtkSeparatorMenuItem': 15072 bytes, 157 objects
type 'ClearlooksStyle': 14388 bytes, 11 objects
type 'GdkWindowImplX11': 9100 bytes, 91 objects
type 'GdkPixbuf': 8320 bytes, 160 objects
type 'GdkWindow': 8008 bytes, 91 objects
type 'GtkAction': 7208 bytes, 106 objects
type 'GtkRcStyle': 6640 bytes, 20 objects
...

Lots of NautilusFiles, PangoLayouts and icons which is hardly
surprising. However, we also have a lot of accel-labels, and menu
items. This is from the menu in the window and the hidden menu in the
desktop window. I wonder what the gstreamer objects are from though.

Another way to look at memory use is to look at what files allocate a
lot of memory:

./analyze-memdump -p nautilus-run-with-home.dat 
Per-file memory use:
No file info: 201536
file 'gdk-pixbuf.c': 1457837
file 'gtype.c': 606802
file 'glyphstring.c': 453448
file 'ghash.c': 305840
file 'pango-layout.c': 274576
file 'nautilus-file.c': 254163
file 'gnome-vfs-file-info.c': 146309
file 'glist.c': 131400
file 'gfileutils.c': 124571
file 'gtkicontheme.c': 97906
file 'nautilus-icon-canvas-item.c': 97538
file 'gclosure.c': 75316
file 'gstrfuncs.c': 71390
file 'gsignal.c': 69152
file 'gdataset.c': 63758
file 'garray.c': 63104
file 'fonts.c': 49232
file '../glib/gbsearcharray.h': 48972
file 'pango-item.c': 44640
...

Here we also see the PangoLayouts using a lot of memory. Not only in
pango-layout.c (which is the strings), but also in glyphstring.c which
is the data from the PangoLayouts that I’m actually interested in. It
seems to be about twice the size as the strings though, so its not
very compactly stored. It would be interesting if one could take a
layouted PangoLayout and turn it into a lean platform-specific render
object that you could only render, and nothing else. That way i could
throw away the PangoLayout when it was done measuring the string. It
could also possibly store the glyph strings in a more compact way
(PangoGlyphInfo looks a bit large). Or maybe I should just bite the bullet and re-layout when drawing?

To test this stuff you have to apply these patches for glib and
gtk,
and then you have to rebuild your app and all glib-using libraries it
uses. The analyzer app is
here.

If you are interested in Nautilus you can download the

memory dump
I used and play with it. It should work on any 32bit little-endian system.
Lisp pointer size?

Today I got this from emacs:

Warning: memory in use exceeds lisp pointer size
Killing some buffers may delay running out of memory.
However, certainly by the time you receive the 95% warning,
you should clean up, kill this Emacs, and start a new one.

I’ve never seen that before. The process was just 126 megs and about two months old.

Gtk+ printing on windows

This week I have continued to work on the highlevel platform independent Gtk+ printing API (availible in libegg in cvs). Its getting pretty good by now, and I have a couple of test apps that verify the API works.

I spend most of the time this week in windows, implementing the win32 version of the backends. I did that for two reasons, first of all any Gtk+ API has to be portable, so I have to make sure that the API we come up with is implementable on windows. The second reason is that windows already have a print dialog, and working with it lets me learn a lot about the general requirements of printing dialogs that we can use as input both for the highlevel API and later when implementing the unix dialog.

I’ve put up a small windows demo
here.
Its got all the dlls required to run it. Just unzip it to a directory and click on start.bat to launch it. (It spews error output sometimes because it can’t find the stock icons, I dunno why that is.)