As some astute observers may be aware, free software isn’t my only nerdy obsession. A quick perusal of my Flickr photos may reveal some of my other interests. If you guessed “taking poor pictures of wildlife”, you’d be pretty close.
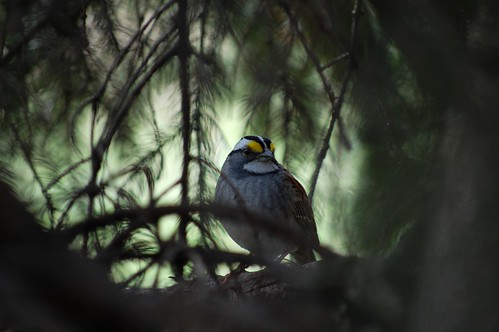
Yes, I watch birds.
To make a long story short, a couple of years ago I became quite interested in the vocalizations of birds: learning their calls and songs, learning to identify a bird by ear. It turns out that in order to really internalize a sound, it’s actually very helpful to be able to visualize it. This is generally done with a plot of frequency vs time. To generate these spectrograms, I’ve been using a slightly modified version of spek, which is a great little program. However, I’ve also found myself wishing I could have an easy visual overview of all of the files in a folder so that I could see at a glance what sort of a sound it was.
By happy coincidence, I have just learned some basics of gstreamer, so I thought it would be a nice opportunity to kill a couple of birds with a single stone[1]. So after a couple of hours of hacking, I’ve pushed a git repository for a little utility I’ve tentatively called ‘soundprint’. It generates a sort of fingerprint for sound files: a spectrogram of the first 5 seconds of audio. It also installs a .thumbnailer file so that nautilus can use it to generate thumbnails for audio files. It’s quite simplistic, but it does what I want it to do.
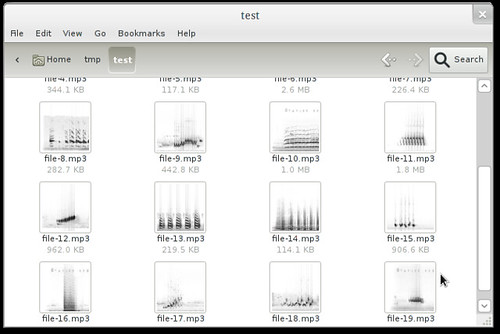
I admit that it’s a bit of a niche application. Spectrograms work best on audio that consists of relatively pure tones; music files tend to end up looking fairly similar to eachother. But in the hope that it may be useful to somebody else, there it is.
[1] no birds were actually killed during this process.