Within GNOME we use Bugzilla a bit differently than upstream. GNOME has a lot more products and components than e.g. the Bugzilla used by Mozilla (which is also used to tracks the bugs of Bugzilla itself). More than 350 products, a lot of components, versions, etc. This especially can cause performance issues that aren’t seen when you only have a few products. One of these issues is bug 372795. This is a performance bug about Bugzilla doing one query per component/version/milestones on query.cgi?format=advanced. That bug has a patch where all components/versions/milestones will use just one query per item. However, you might not always want that information and the patch could trigger instances where the information is loaded while it isn’t being used.
Performance testing Bugzilla is always annoying. You have to do something like:
DBI_PROFILE='2/DBI::ProfileDumper' time ./query.cgi 'format=advanced'
This generates a dbi.prof file which can be analyzed with the dbiprof command. Running command like shown above becomes annoying when you want to test a lot of these scripts. Plus sometimes you want the uncached timings (/proc/sys/vm/drop_caches + MySQL stuff). It is all just too slow. I wrote a script that handles this stuff and does all the work of comparing a standard Bugzilla installation to when that installation is patched. The script parses the ‘time’ and ‘dbiprof’ output and generates a few .csv files. However, having a chart would be much nicer.
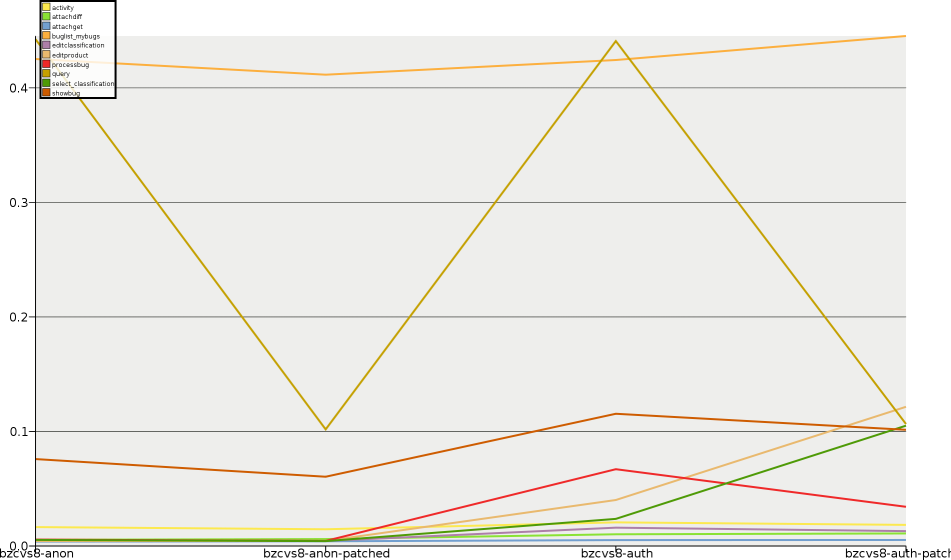
It took a while to find a nice (working) Python Cairo chart module — I ended up with a patched pycha. I had to patch it as it didn’t allow the font size to be changed and it also generated area charts instead of a real line chart. The end result is picture which is far easier to understand than a .csv with loads of figures:
I still want to make that chart clearer. However, it is a big improvement compared to the .csv files. What you see are various tests ran against 4 ‘Bugzilla installations’: -anon means that the test was ran while logged out, ‘auth’ means while logged in, ‘patched’ is when the patch was applied. To check for performance regressions you just have to compare the 1st ‘tick’ to the 2nd and the 3rd to the 4th. Which in a chart is easy, just look where the lines go up instead of down. In above chart, query.cgi is much faster. However, editproduct, ‘select_classification’ and the ‘My Bugs’ buglist are slower. The timings are in seconds btw and are for the cached cache (each test ran 5 times, the timings are for the 5th run).
Making a script to run such tests is really great (hate doing things manually). Even better is having Cairo to really do something with these results — the chart is so much clearer. I’d still like a better Cairo charting option from within Python though — perhaps some nice goffice Python bindings?

matplotlib is quite nice for producing charts with Python. It has a Cairo backend too, although it uses agg by default.