
So as I’ve spent the last year learning Melbourne as a cyclist, there’s been a few times where I’ve found myself on an absolutely staggering hill, only to go down it again, and worse find there was another way that totally avoided the hill; or I’ve chosen routes that subject me to staggering head winds only to be told I should have taken another route instead.
This got me thinking, with everyone tracking their cycles on their smartphones, why couldn’t I feed all of this data into a model, along with some data like NASA’s elevation grids, or the Bureau of Meteorology’s wind observations. As something to keep me occupied over Christmas, I started a little project on the plane to Perth.
It turns out RunKeeper has this handy API that lets you access everything stored there. Unfortunately it seems that no one has really written a good Python API for this, so I put one together.
Throw in a bit of NumPy, PyProj (to convert to rectilinear coordinates) and Matplotlib (to plot it) and you can get a graph that looks like this (which thankfully looks a lot like RunKeeper’s graph):
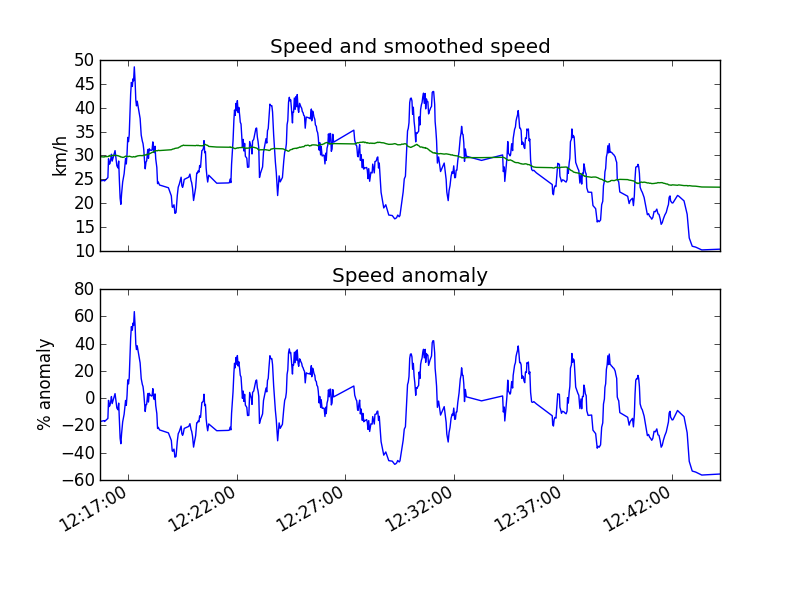
If we do some long window smoothing, we can get an idea of a cyclist’s average speed and then calculate a percentage anomaly from this average speed. This lets us compensate for different cyclists, how tired they are or if they’re riding with someone else ((This does have the side effect of reducing the signal from head/tail winds, especially on straight trips, I need to think about this more.)).
If we then do this for lots of tracks and grid the results based on whether the velocity vector at each point is headed towards or away from Melbourne ((We need this, otherwise the velocity anomaly would average out depending on which direction we’re headed up/down a hill.)) we can get spatial plots that look like this (blue is -1 and red is 1):
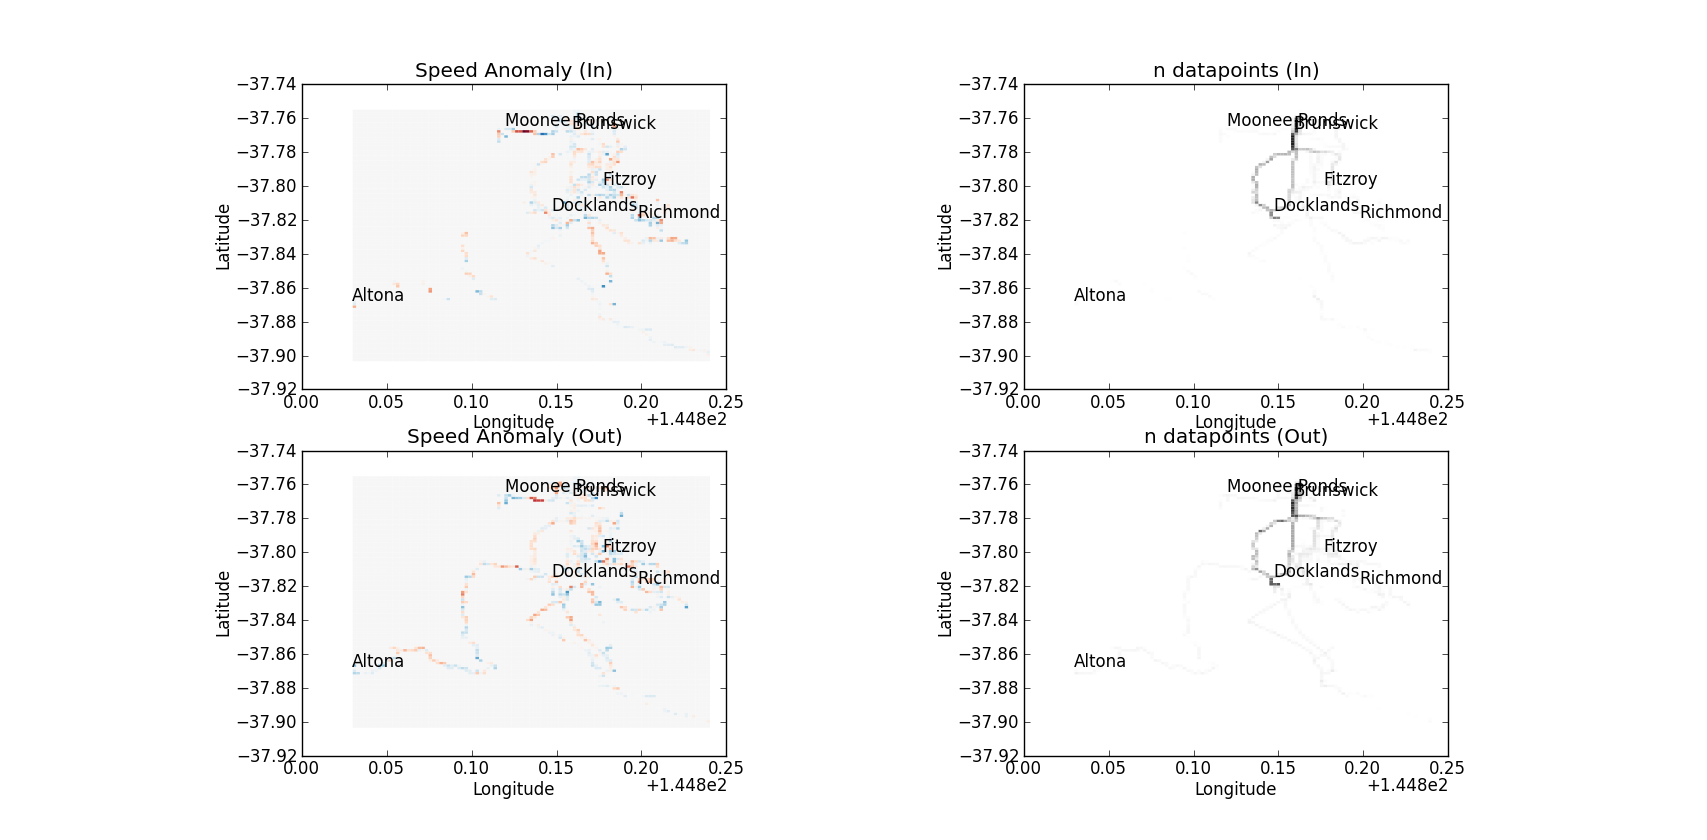
If you squint at the graphs you can sort of see that there are many places where the blue/red are inverted, which is promising, it meant something was making us faster one way and slower the other (a hill or wind or the pub). You can also see that I still don’t really have enough data, I tend to always cycle the same routes. If I want to start considering factors that are highly temporally variable, like wind, I’m going to need a lot more data to keep the number of datapoints (always want to call this fold) high in my temporal bins.
The next step I suppose is to set up the RunKeeper download as a web service, so people can submit their RunKeeper tracks to me. This means I’m going to have to fix up some hard coded assumptions in the code, like the UTM zone for rectilinear projection, and what constitutes an inbound or an outbound route. Unsurprisingly this has become a lot more ambitious than a summer project.
If you feel like having a play, there is source code.
