So I found a bit of time to hack on my project today. Today’s task was to load and validate data coming from Geoscience Australia’s SRTM digital elevation model data, which I downloaded from their elevation data portal last week. ((Note to the unwary, seems to be buggy in Chrome?)) The data is Creative Commons, so I might just upload it somewhere, if I can find a place for 2GB of elevation data.
This let me load elevation data in a 3 arcsecond (about 100m) grid, which I did using the ubiquitous GDAL via its Python API. Initial code is here. It doesn’t do anything super clever yet, like check and normalise the projection, because I don’t need to. ((I did write a skeleton context manager for gdal.Open. I say skeleton because it doesn’t actually do anything smart like turning errors from GDAL into Exceptions, because I didn’t have any errors to handle.))
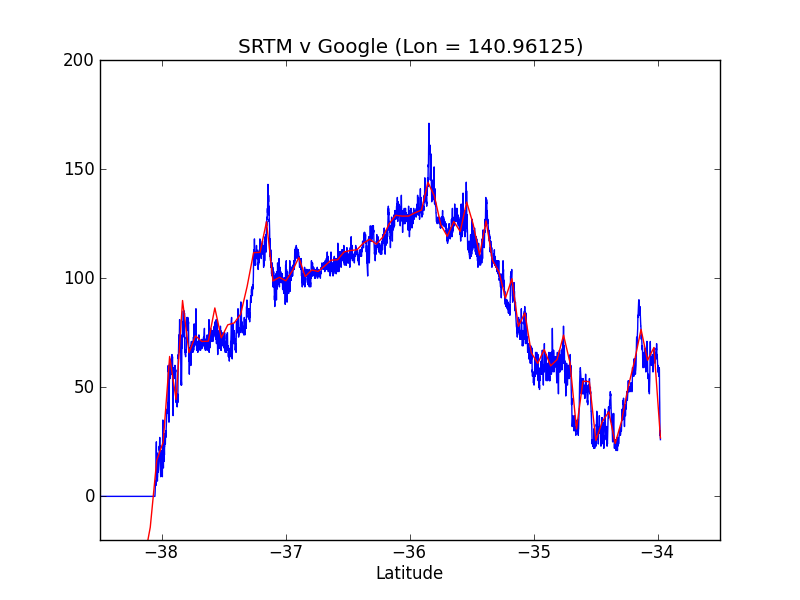
Looking at plots of values can give you a gist of what’s what (oh look, it goes out to sea, and then the data is masked out) but it doesn’t really validate anything. I could do validation runs against my GPS tracks, but for a first pass, I decided it would be easier to validate using Google’s Elevation API. This is a pretty neat web service that you make a request to, and it gives you back some JSON (or XML). There are undoubtedly Python APIs to access this, but it’s pretty easy to do a simple call with urllib2 or httplib. I chose to reuse my httplib Client wrapper from my RunKeeper/HealthGraph API. I wrote it directly in the test.
For a real unit test, I would have probably calculated the residuals, and ensured they sat within some acceptable range, but I’m lazy, so instead I just plotted them together. Google’s data, you will notice, includes bathymetry, which is actually pretty neat.


