
Sysprof is an enormously helpful tool that can be used for identifying performance problems in applications. However, there are a few things that need to be considered in order to get meaningful and useful results, especially for Rust applications.
With this blog post I want to provide a short step-by-step guide on what requirements need to be met, so that hopefully more people can make use of Sysprof.
For reference, I am using Fedora Silverblue 39, and have GNOME Builder 45 installed as a Flatpak from Flathub. Sysprof must be installed as a regular (rpm) package on the host system:
rpm-ostree install sysprofOn regular Fedora Workstation:
sudo dnf install sysprofAs an example for profiling I will use my application Fragments. The process and the results may differ on other distributions / systems, as this depends heavily on whether frame-pointers are enabled or not, for example. The latter is a hard requirement for achieving useful results with Sysprof.
Debug symbols
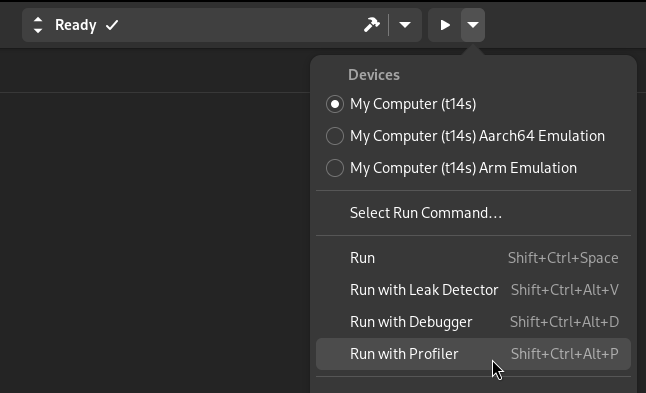
I start Fragments with Builder and select the “Run with Profiler” option.
Then I can open and inspect the generated syscap file with Sysprof:
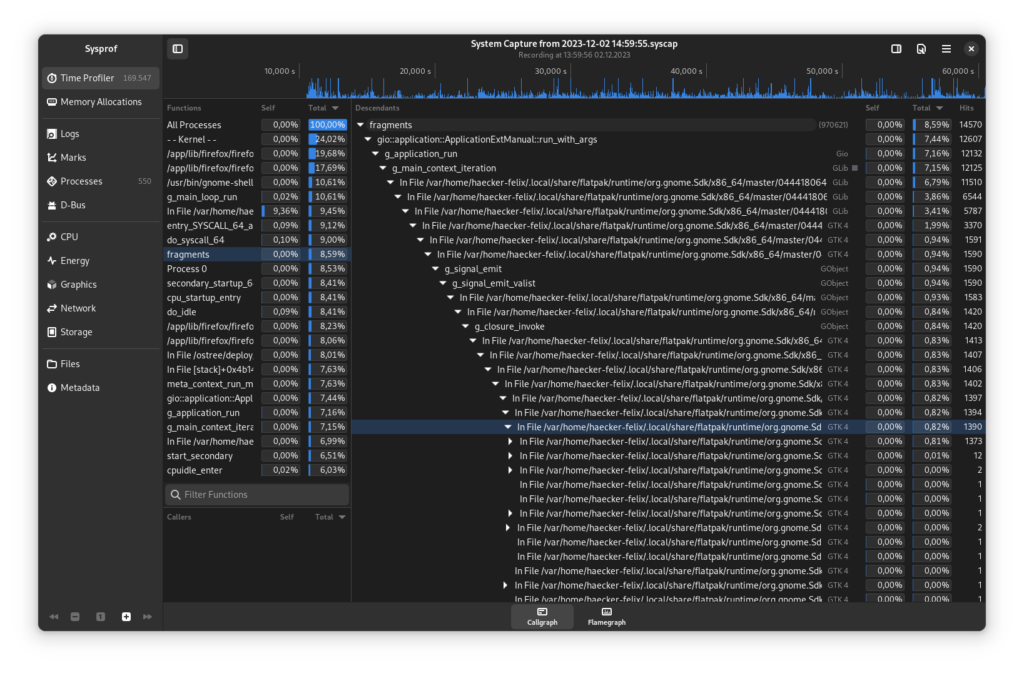
I select fragments from the left sidebar so that I can see all the associated descendants. However, the results are not really helpful yet, as instead of the method names only “In File… org.gnome.Sdk….” is shown.
This is because the required debug symbols are missing and have to be installed:
flatpak install gnome-nightly org.gnome.Sdk.Debug//masterMake sure that you install the correct .Debug runtime for the corresponding version, which you have also specified in your Flatpak manifest (runtime / runtime-version, in my case master).
Rust and frame-pointers
With the right debug symbols installed, the results look much more readable:
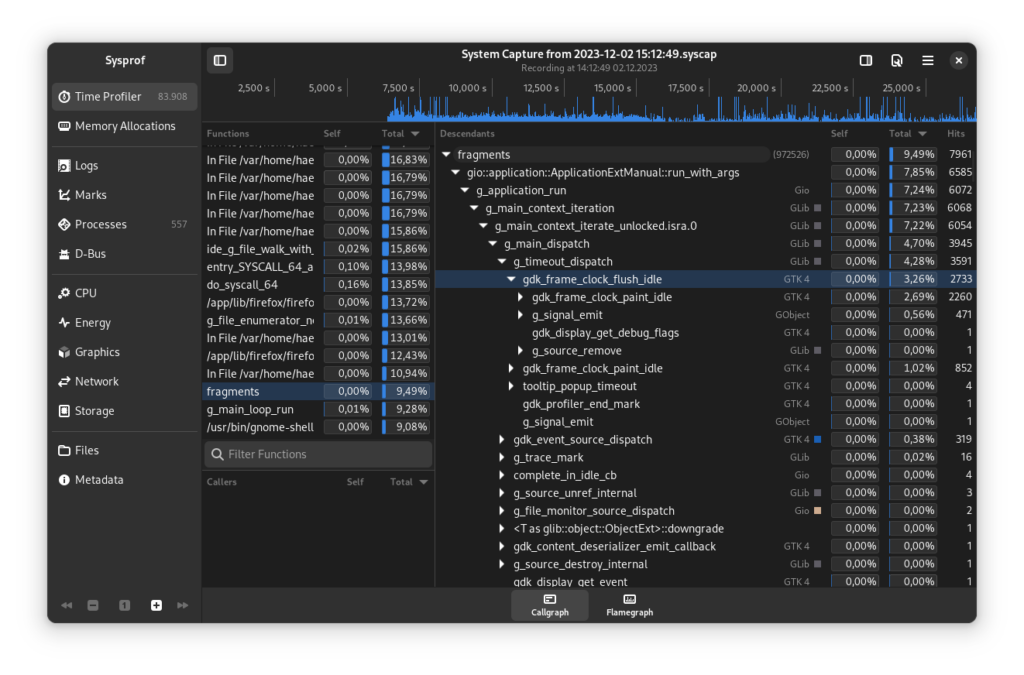
However, it is noticeable that apparently almost exclusively function names of libraries (Gio, Glib, Gtk, …) appear, and nothing of Fragments itself.
This is because Fragments itself must also be compiled with frame-pointers enabled, which we can enforce with the Rust flag force-frame-pointers=yes – so let’s do that.
With objdump we can check if the compiled binary has frame-pointers enabled (and the specific registers aren’t clobbered):
objdump -Cd fragments | grep -E '>:$|\$0x1,%bpl' | grep -B1 bplIf we have done everything correctly, this command should not return any output. But we do get output, and see some functions from the Rust standard library, even though we have frame-pointers enabled… How come?
0000000000137460 <core::slice::sort::partial_insertion_sort>:
  1374df:    40 b5 01                mov    $0x1,%bpl
  137850:    40 b5 01                mov    $0x1,%bpl
--
0000000000f6d110 <core::slice::sort::recurse>:
  f6d166:    40 b5 01                mov    $0x1,%bpl
--
0000000000f75610 <gimli::read::unit::EntriesRaw<R>::read_abbreviation>:
  f75753:    40 80 fd 01             cmp    $0x1,%bpl
--
0000000000f7cd80 <addr2line::ResUnit<R>::find_function_or_location::{{closure}}>:
  f7e770:    40 80 fd 01             cmp    $0x1,%bpl
--
[...]
The reason for this is that Rust toolchain, and thus also the standard library, have been compiled without frame-pointers enabled (the Rust SDKs from Flathub are repackaging the official Rust provided binaries).
To fix this, we can use -Zbuild-std --target=x86_64-unknown-linux-gnu . This will recompile the standard library during the build process (like a regular crate), while respecting our set compiler options/flags, especially force-frame-pointers=yes.
Since build-std is currently unstable, we have to switch from rust-stable to rust-nightly. Once build-std gets stabilised, or the Rust toolchain is compiled with frame-pointers enabled, we can switch back to rust-stable again.
If we run the same objdump command from above again, we get no output anymore. Which means, hooray, our binary has now been compiled without frame-pointers getting clobbered / optimised away!
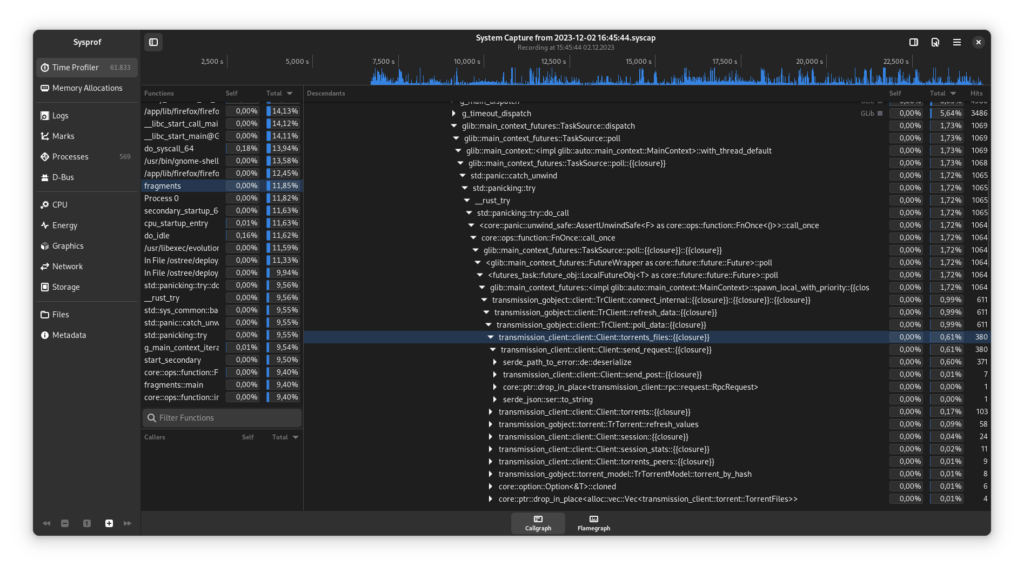
Now, for the first time, we are getting results with Sysprof from which we can derive useful information. For example, we see that the Client::torrent_files function takes quite a bit of time, which is because we have to deserialise the JSON we get from transmission-daemon, which can be quite time consuming with long responses (and unfortunately happens synchronously, and not asynchronously).
Bonus: Better function names
We can improve the display of the function names by setting the Rust flag symbol-mangling-version=v0.
This way we use the new Rust v0 mangling scheme instead of the (currently still default) legacy one. This has the advantage for us that the function names can be displayed better/more detailed in Sysprof, since Sysprof has direct support for the Rust v0 scheme and therefore does not have to fall back to the generic c++ demangler.
Before (legacy):
serde_path_to_error::de::deserializeAfter (v0):
serde_path_to_error::de::deserialize::<&mut serde_json::de::Deserializer<serde_json::read::StrRead>, transmission_client::rpc::response::RpcResponse<transmission_client::torrent::TorrentFilesList>>Conclusion
All the changes I have described in this blog post are included in this merge request: Fragments!168
For more detailed information on how to use Sysprof itself, I recommend the Sysprof GNOME Wiki page, which contains some usage examples.
Thanks to Christian for Sysprof, and for the ability to use Sysprof together with Flatpak, which is a great benefit, especially for image-based systems like Silverblue.