Here, is yet another follow up post on EDS memory consumption. For the last few days I’ve been tracking where memory is spent in EDS and our benchmarking tools, and it was a very interesting experience.
And I’m not just saying that ! it was very trying and it’s still a bit of an unsolved mystery to me (so please feel free to step in with your theories on the unsolved parts !).
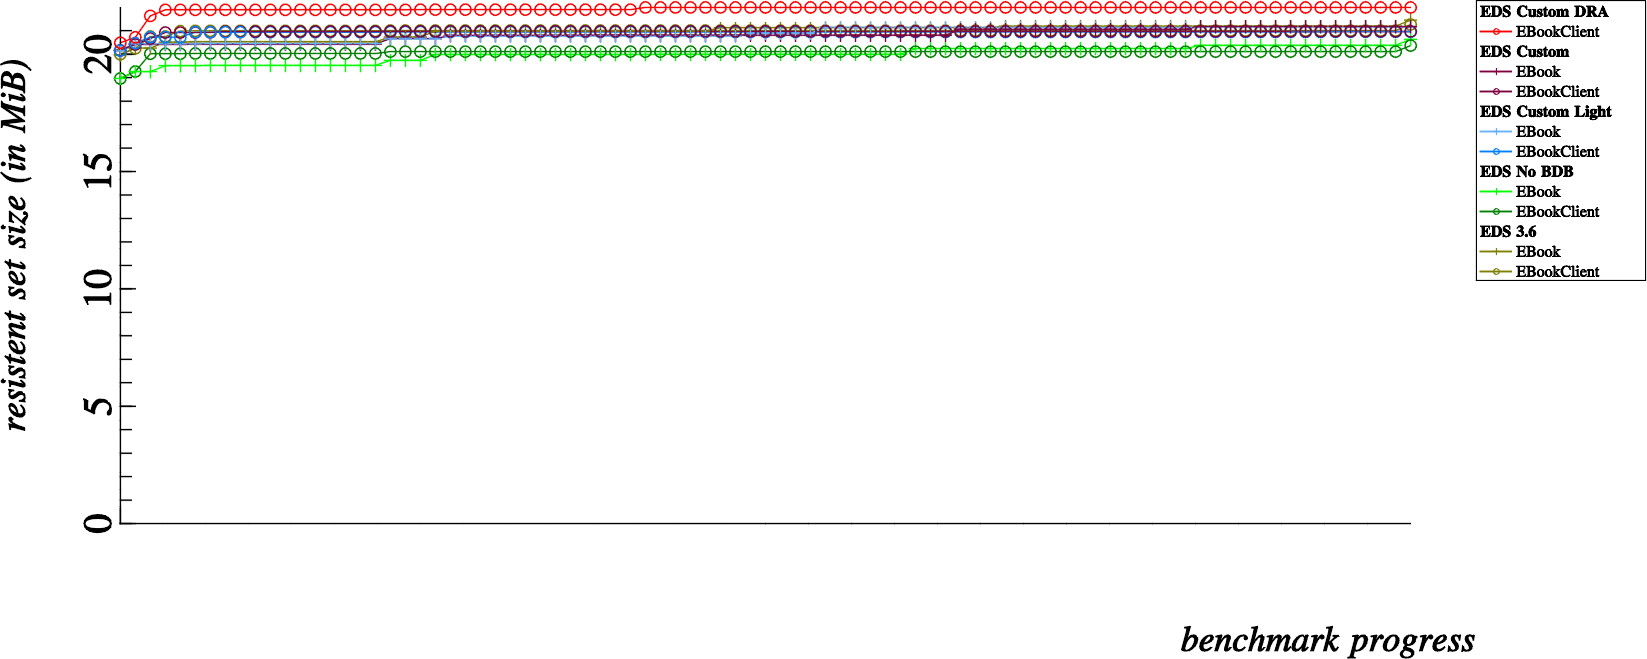
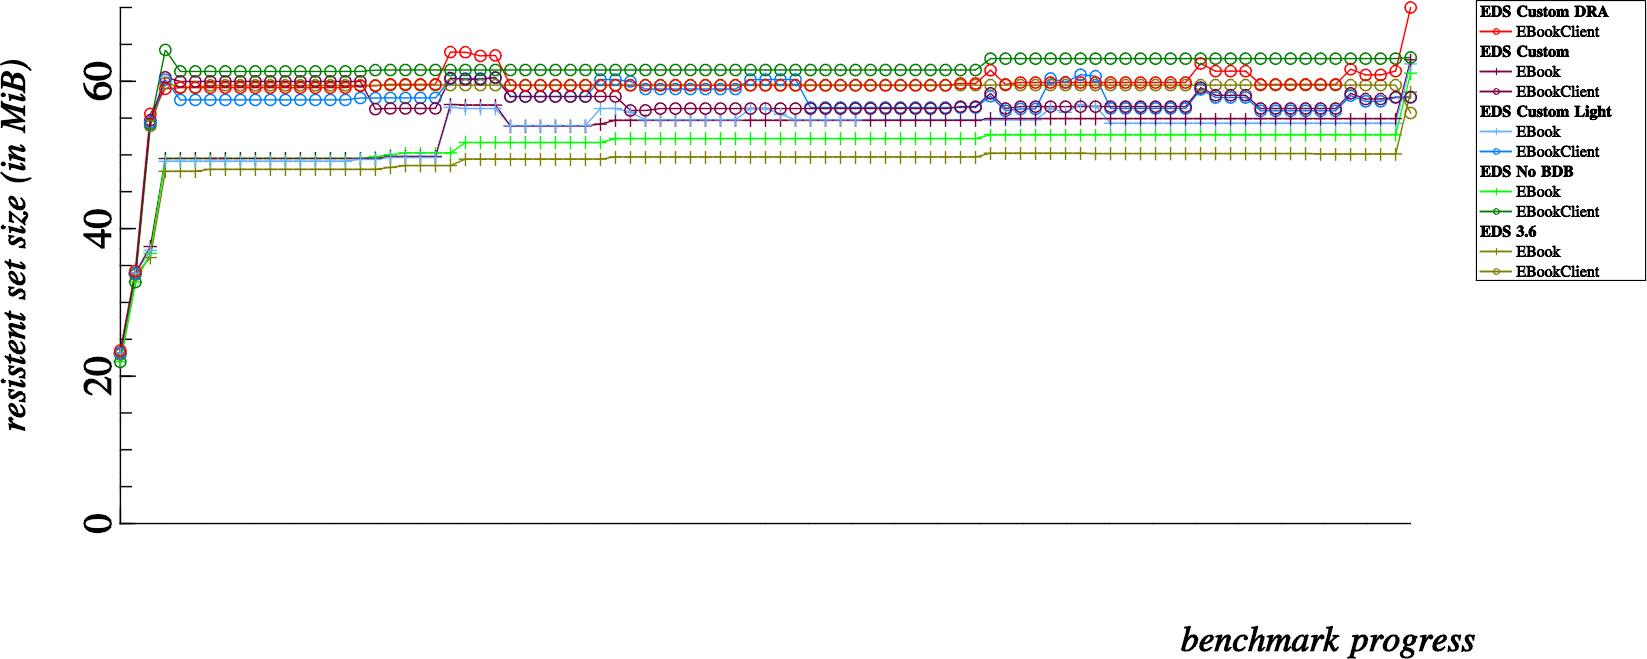
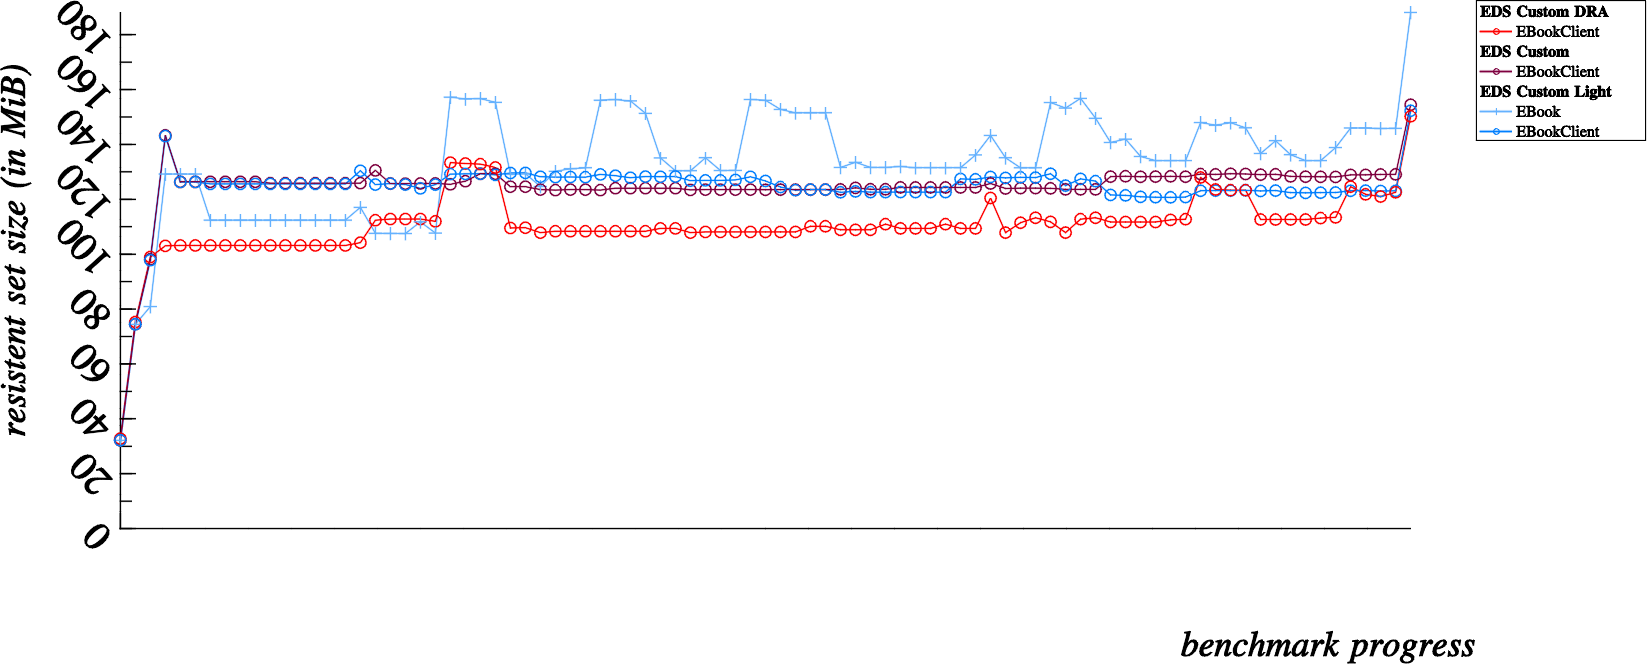
It all started when Michael asked me to explain the funny spikes in the memory usage graph presented in the previous post. The first thing I did was to produce a more “bumpy” graph by disabling the slice allocator, yielding what is in some ways a more accurate account of actual memory usage:
Interestingly, I say “in some ways” above because; one of the elements that we have to consider is memory fragmentation; memory management is generally more optimal and less fragmented when the slice allocator is active.
What we are looking at above is a left to right graph of overall memory usage; measured after each and every operation that we run on the addressbook. Each “dot” can be associated to one of the various latency tests that we run for each and every build of EDS (indicated in the legend).
First of all let’s demystify the “curious humps” which occur mostly to the “Custom Light” (light blue) benchmarks but are also noticeable in other benchmarks. These “humps” occur for four dots at a time, particularly when performing suffix searches on contact fields that are not stored in the summary SQLite tables for quick searches.
This phenomenon is partly attributable to the fact that all contacts in the addressbook need to be individually examined (and the vcards individually parsed) when the given contact field is not stored in the SQLite tables individually (or what we refer to in EDS terms as “the summary”). I’m not really very concerned by these “spikes”; obviously the memory is reclaimed later on, however it is curious that this happens specifically for suffix matching and not for prefix matching (presumably lot’s of extra string duplications and normalizations are needed for the case insensitive suffix matching routines).
Now that that’s out of the way, it leads us to some of the…
More interesting parts
I was at first not satisfied with only this explanation, sure, it kindof explains the “funny humps” in the benchmark progress but… by taking a closer look at what else is actually happening… I needed a better explanation.
The portions of the presented memory usage graphs that interest me more are the memory growth observable over the course of the first four dots, as well as the curious memory growth that also occurs at the very end of the benchmarks.
So what is happening in these stages ?
First of all, it’s positive news to know that the number of automatically generated vcards used for testing are already in memory before the benchmarks start at all, in the above graph that represents 12,800 vcards all in memory before the first benchmark is measured. And then…
- The addressbook is initialized and created, so at the point of measuring the very first dot, we have 12,800 vcards in memory and an initialized EBookClient on the client side and an addressbook counterpart (SQLite database created and active SQLite connection) in the server side memory
- Next, at the second dot we’ve created 12,800 EContact objects in memory… the 12,800 EContacts and 12,800 vcard strings remain in memory throughout the benchmark progress. This second dot is about 45MB higher on the scale than the first dot, so it’s pretty safe to say that 12,800 EContact objects cost roughly 45MB of resident memory which will not be reclaimed for the duration of the benchmark progress.
- The third dot is measured directly after adding all the contacts to the addressbook, here we start to see some divergence in memory usage; notice that this costs roughly 25MB extra for EBookClient based benchmarks, but only about 5MB for EBook based benchmarks. Being a bit naive, I overlooked this detail at the beginning of the investigation… one of the notable differences in the EBook apis is that it was lacking in batch commands. So the major difference here is that EBook tests add contacts one by one over D-Bus, while the EBookClient tests add contacts in batches of 3200 contacts at a time.
- This fourth dot, is after fetching all contacts at once from the addressbook. Here is where I became seriously alarmed. For normal clients, this shows an approximate 30MB growth in memory consumption. So where did my memory go ? A simple case of amnesia ?! Note though, that the Direct Read Access (red) benchmark hardly increases in memory for a fetch of 12,800 contacts, good show.
Naturally, feeling embarrassed about the consequences of the evil fourth dot… I frantically started my search for memory leaks… first I blamed the obscure nature of C++ code and it’s attempts to hide memory management behind smart pointers…I tried to pin it as a memory leak in the actual benchmarking code (after all, I did just lose 30MB of memory… it must have gone somewhere… right ?)… but after some tracing around, I found that those returned contacts, stored by smart pointers or not, were properly finalized and freed, leaving me with this uncomfortable mystery still on my hands.
While most of my memory leak hunt revolved around explaining the 30MB memory overhead incurred from dot 3 to dot 4, I should mention that the last memory jump was also suspicious. This last memory jump (which seems to vary between a 10MB to 25MB increase depending on the benchmark type) is incurred by deleting all contacts in the addressbook. So how about that ? I’ve just deleted all the contacts, and now I’m using MORE memory than before ?
The following day…
… I ran the benchmarks in loops, for some I’ll share below because this is how I eventually solved the mystery case, I also ran the benchmarks (server and client) under valgrind, ran some various test cases with the server and test cases running under valgrind. But the alleged memory leak was not to be tracked. Some testing of the benchmarks running in a loop seemed to indicate that there was some memory growth over time, not very much so, but enough to make me believe there must be some leak and be determined to find out.
Finally, today…
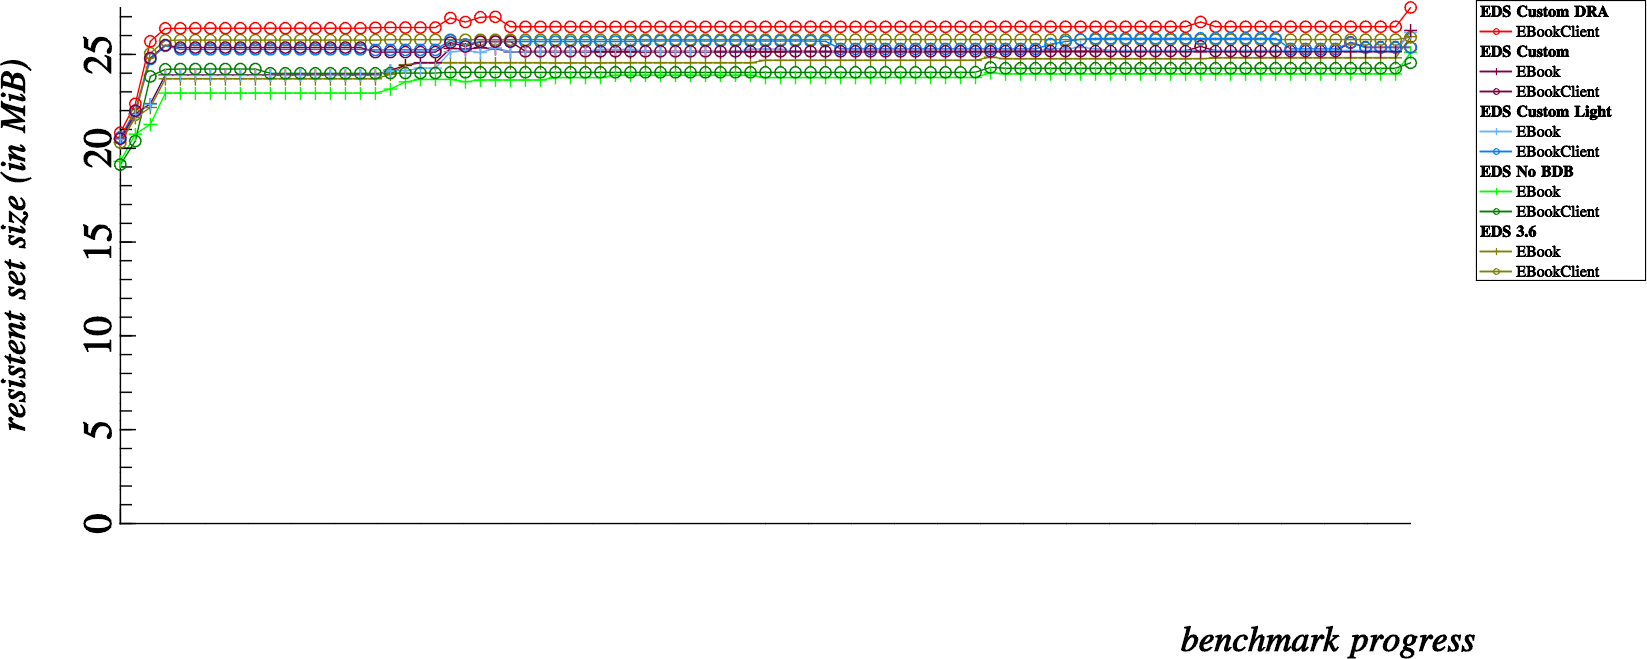
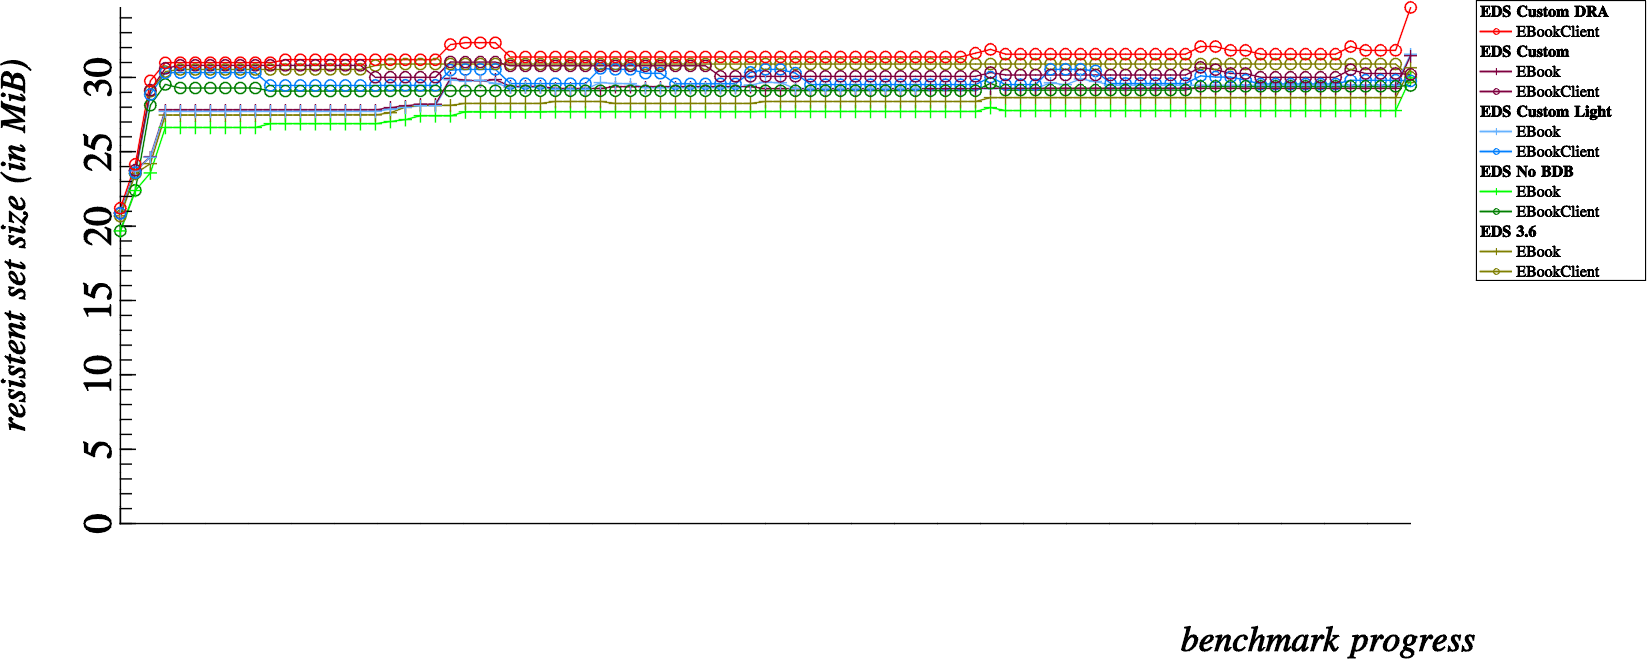
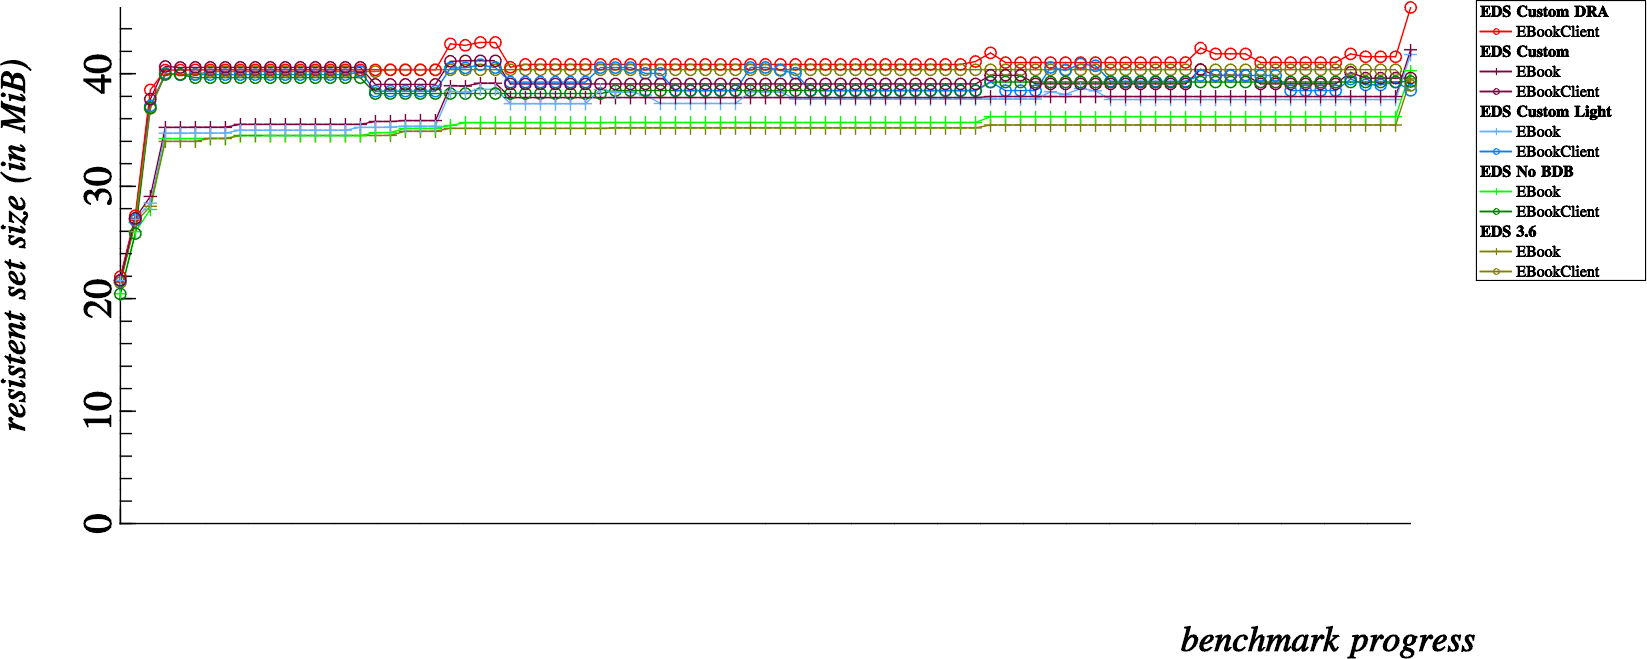
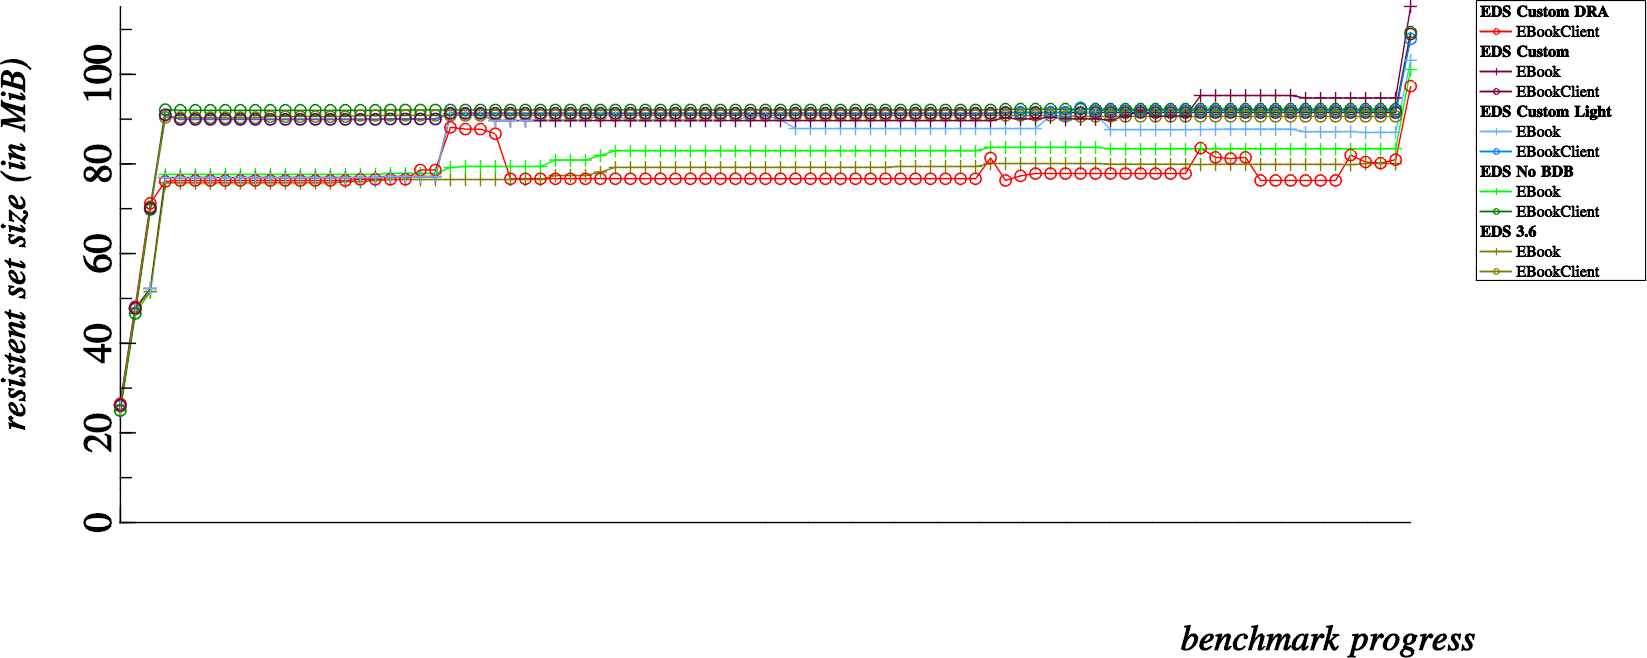
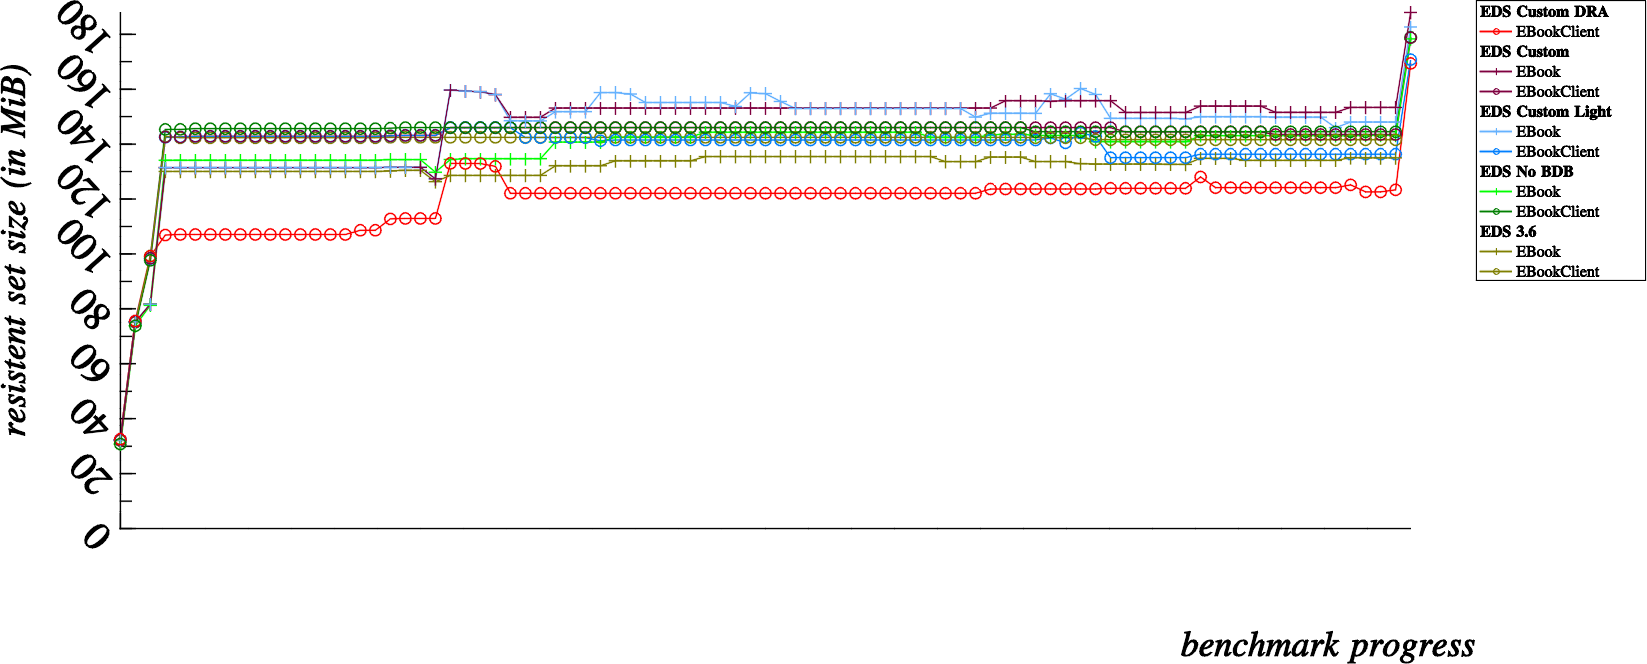
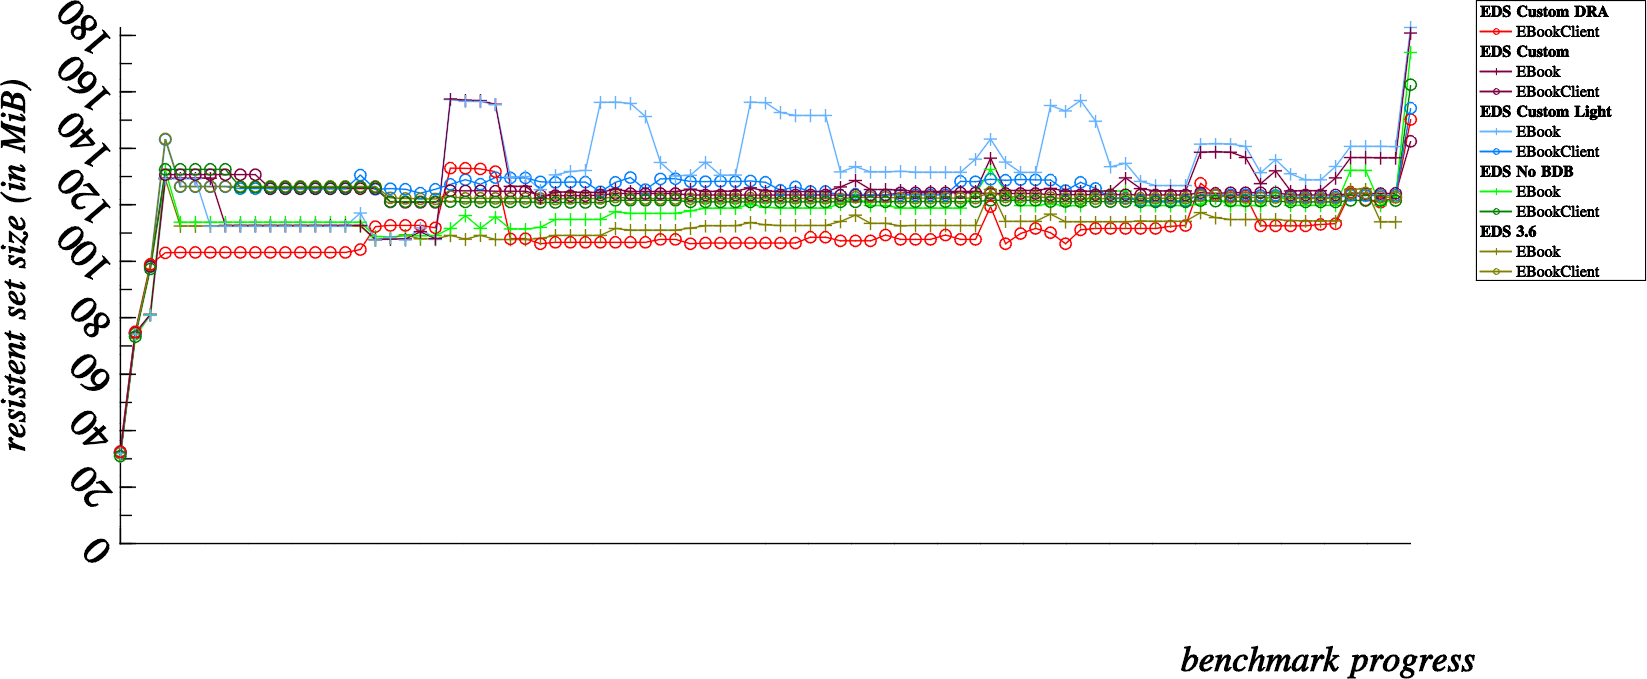
… I let my laptop chug along and loop the benchmarks (at least some of them) with a huge 12,800 contact count (that takes time), so let’s share those enlightening results here:
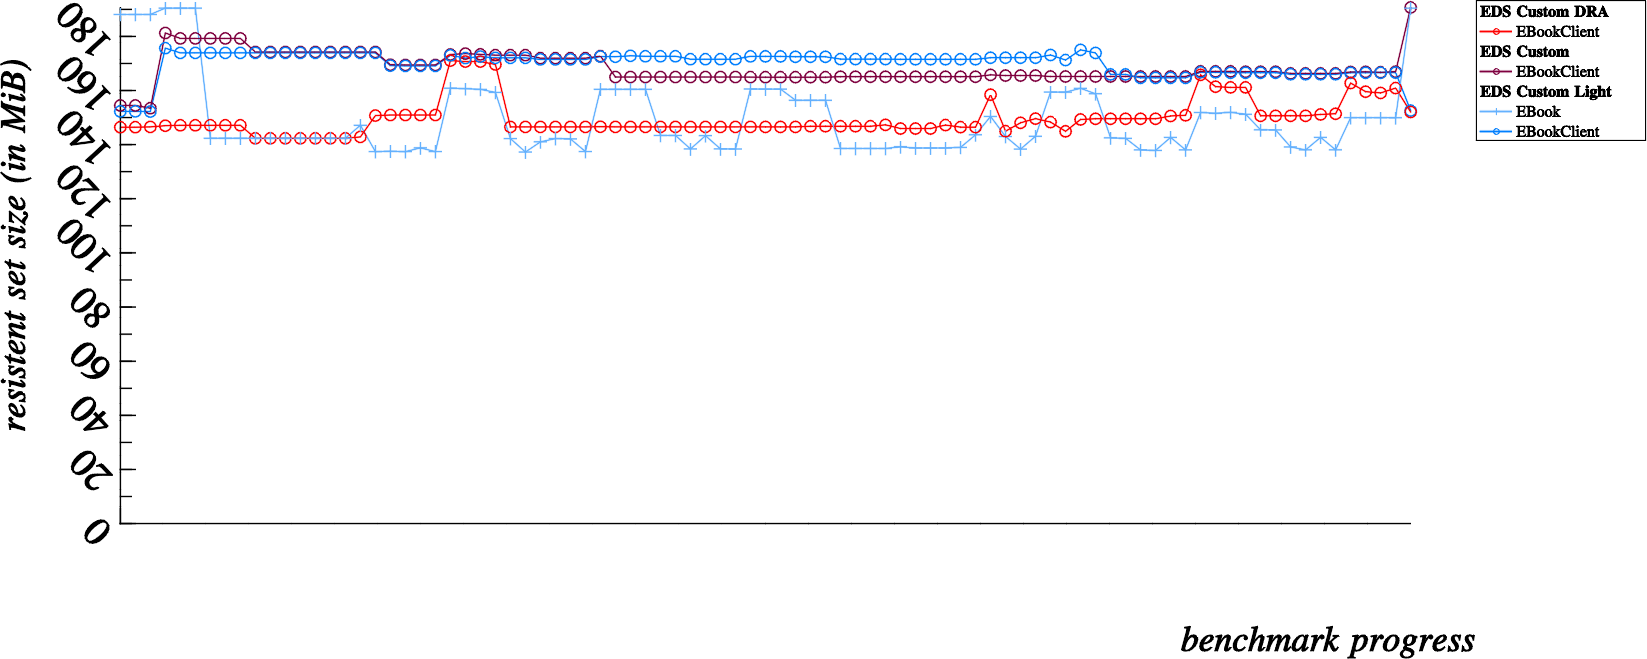
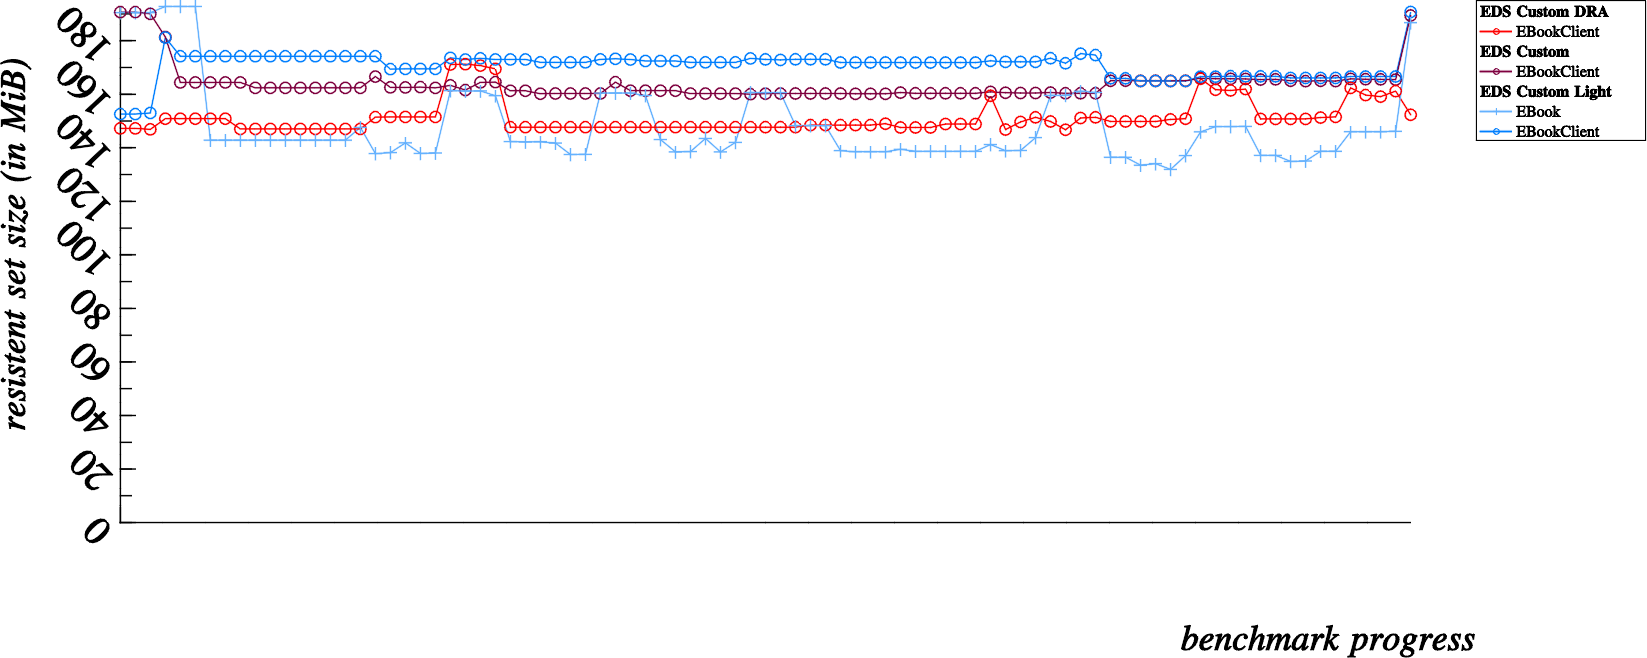
These results would be better viewed from left to right instead of one on top of the other, but you get the idea. Just consider that the last dot in the first chart happens directly before the first dot in the following chart, and so on.
So, after viewing this data… we can see that in the second and third graph, memory we presumed to be lost, is eventually returned to the system (in other words, it was indeed only a case of temporary amnesia, and not a more severe degrading case of alzheimer’s)… This is very reassuring, numerous runs with valgrind also show no real evidence of memory leakage, which is also reassuring evidence that our EDS is leak free.
But, that still doesn’t really explain…
Where is that memory actually going ?
At this point I can only give you my best guess, but all of the clues seem to point towards D-Bus traffic:
- At the second “dot” where contacts are added to the addressbook, EBook APIs adding only a single contact at a time seems to cost much much less than using EBookClient apis and adding the contacts in batches of 3200 contacts at a time.
- At the third “dot” where a brute “fetch all contacts” call is made to the addressbook, we can see a huge increase in memory consumption all except for when using Direct Read Access mode. So when fetching a list of 12,800 contacts not using D-Bus, we don’t suffer from memory loss.
- In the last suspicious “dot”, where we delete all contacts from the addresssbook at once, all benchmark types seem to suffer significant memory loss. In this case the client is sending a list of 12,800 contact UIDs over D-Bus to the addressbook (in Direct Read Access as well, since deleting contacts is a write operation).
My best guess ? this is all due to zero-copy IPC transfers implemented by D-Bus.
In other words (if you’ve read up to this point you probably don’t need any explanation), instead of the sender writing chunks of data to a socket, and the receiver reading bytes from a socket; the sender is owning some shared memory which is accessed directly by the receiver.
This shared memory is probably managed by the D-Bus daemon itself, so it would make sense that the daemon not release the shared memory straight away but instead reserve some head room in the case that further transfers might reuse that memory.
So how come the fourth dot where a batch of 12,800 vcards are passed to the client, is not reused by the last dot where all contacts are deleted ? … Because, when contacts are fetched the shared memory owner would have to be the sender, which is the addressbook server. However when contacts are deleted, it is the EBookClient user process which sends a list of 12,800 UIDs, in this case the owner of the shared memory should be the other, client process.
I’ll probably need to pursue some extra verifications to be sure, but this best guess is very compelling to me at this time.
In conclusion, this was a really interesting exercise, which I don’t hope to repeat very often… but I did learn a few things and it did put some things into perspective. First and foremost; measuring memory usage, when compared to just tracking and plugging leaks, is quite another story… a lot more tricky and probably not an exact science.
If you’ve got this far, I hope you’ve enjoyed this detective story… I did enjoy it.
Amendments
It’s probably bad form but I’ll just add this here, my theory is obviously false. As I’ve been informed (already) that D-Bus does not implement any such zero-copy mechanisms with shared memory… so there is still a huge memory fluxuation, definitely related to D-Bus usage, which I can’t readily explain.