
Endless OS contains an optional anonymous telemetry system, where installations of the OS collect usage data and periodically send it back to us at Endless OS Foundation. Although the system is open-source, has existed in various forms for close to a decade, and individual pieces of it are documented, I don’t think we’ve ever written much about how it all fits together. So here I will try to correct that by describing the current incarnation of this system in its entirety, and why we have it.
Let’s stare directly at the elephant in the room: usage metrics – telemetry, analytics, or whatever other terms one might like to use – is something that free software community members are often opposed to, with some good justification. A lot has changed in the 10 years since the first commit on this project in September 2013. The Facebook–Cambridge Analytica data scandal and other similar events have raised public awareness of the potential for abuse of personal data, and there have been massive regulatory improvements in this space, too. Of course, I have my own opinions about data collection, which you can probably guess from my having spent most of my adult life working on free software! When I joined Endless, I wasn’t comfortable with previous incarnations of our metrics system, but after it was reworked into the form described below, I am confident that it strikes a good balance.
I can’t hope to change every reader’s mind about telemetry, but I do hope to make a more optimistic case for privacy-respecting metrics that are a net positive for free software users and communities alike.
We are only human, so there may be things we have overlooked, whether conceptual or in the implementation. And, we have very limited time to work on this stack at present. If you have feedback or suggestions; if you’re interested in contributing ideas, documentation, code, or analysis; if you want to adopt or adapt these tools in your own distro or projects: please do get in touch!
Goals
Before we go into the details of this system, let’s talk about why an open-source project might want such a system in the first place. After all, the easiest metrics system to build and maintain is no metrics system at all! For Endless OS Foundation, there are two primary reasons to have this system: to demonstrate the impact our work has, and to guide our ongoing work to improve our tools.
Endless OS Foundation is a non-profit, funded by private philanthropic grants. To justify our continued funding, which enables us to keep developing tools like Endless OS and contributing to open-source projects such as Kolibri, GNOME, and Flathub, we need to be able to demonstrate the impact that our work has had in the world. We work with other social-impact organisations who have the same need to justify to their own sponsors why they are collaborating with us and investing their time and money in putting our tools in people’s hands. One way that we do this is through qualitative research, such as end-user interviews; but particularly as a small, geographically-disparate team, we can only do so much of this, so we seek to back this up with quantitative data. Quantity has a quality of its own.
In addition, we are not making software in a vacuum: we are trying to address the digital divide by designing technology for people underserved by other platforms. So at a very basic level, we wish to understand: how do people use our tools? What apps and features of the desktop do people use, or not use? Do people actually use their computer at all, or are they too intimidated by technology to even take the computer out of its box? (This is not a hypothetical example!)
Having such information about if and how people are using our software helps us to make informed decisions about how to improve it, rather than basing our actions on assumption and guesswork. In some scenarios, user testing & interviews are the best way to make such decisions; but when considering usage of a whole desktop over time rather than in a single 1-hour testing session, it’s rarely practical to carry out enough such studies to be confident that you’re not just generalising from a handful of anecdotes.
Commercial organisations have similar needs, which is why basically every website, online store, app and platform today outside the free software space has some kind of analytics capability. In Telemetry Is Not Your Enemy, Glyph Lefkowitz described the FLOSS community’s reflexive rejection of telemetry in any form as “a massive and continuing own-goal”, and imagined how the open-source process could yield telemetry that is “thoughtful, respectful of user privacy, and designed with the principle of least privilege in mind”. I tend to agree. The structure and transparency of FLOSS gives us the opportunity to gather actionable data, transparently, in order to make better decisions and improve our software without betraying our users; and by doing so we could make better use of our limited time and attention.
We also have a very important non-goal: we do not believe people’s individual usage of technology should be tracked. We don’t want or need to know what a particular person does with their computer, or any personal data about them. We are a non-profit organisation with a philanthropic mission to give people access to, and control over, technology. We do not wish to sell data about our users, deliver behaviourally-targeted advertisements to users, and so on.
OK, time to dive in!
Gory details
On Endless OS, applications use a D-Bus API (via a small C library, eos-metrics) to record metrics events locally on the device.
This API is implemented by a system-wide service, named eos-metrics-event-recorder or eos-event-recorder-daemon (no, I don’t know why it has two different names either), which buffers those events in memory, and periodically submits them anonymously to a server, Azafea, which ingests them into a PostgreSQL database (after a short layover in a Redis queue). If the computer is offline – often the case for Endless OS systems! – events are persisted to a size-limited ring buffer on disk, and submitted when the computer is online. (At one point we had a tool for exporting events to external storage on an offline system, and submitting them from a separate online system, but this has bit-rotted.)
In some cases, the events are recorded by individual applications. For example, eos-updater records an event when an OS update fails, and we have patched GNOME Shell in Endless OS to record aggregate app usage duration. There is also another system-wide service, eos-metrics-instrumentation, which records the aggregate duration of user sessions, and information about the system’s hardware.
When stored in the remote database on our server, events carry an event-specific payload (such as the updater error which occurred); a timestamp; the OS version (e.g. “5.0.4”) on which the event occurred; and the channel the system belongs to. The channel is defined by the identifier of the OS image that the system was originally installed from (such as eos-eos5.0-amd64-amd64.230510-144309.fr, which is the downloadable build of 5.0.4 with French content preinstalled), whether this is a live USB, dual-boot install or standalone install, plus an empty-by-default dictionary describing the deployment site (which may be used to distinguish different deployments of the same OS image).
The crucial point here is that the same OS image ID is reported by many systems, so while we can slice the data to a particular cohort of users, we cannot identify the specific computer that any given event came from, or even that two different events came from the same computer. Since we typically have a different OS image for each deployment partner, we are still able to filter and share a summary of only the data that relates to that partner, which might be anywhere between 50 computers and thousands of computers.
There are two types of events. Singular events are buffered and submitted to the server as-is. Aggregate events are, as the name suggests, aggregated on the local system by calendar day and calendar month, and submitted after the current day or month ends. As well as the event payload, they carry an integer counter, which is currently used only for durations (e.g. “Chromium was open for 4 hours on 20th June 2023”), but in principle could also be used to reflect multiple occurrences of the same event. One reason you might want this is to distinguish “OS update failed once due to filesystem corruption on 10,000 different computers” from “factoid actualy just statistical error. Average updater fails 0 times per year. Updaters Georg, who lives in cave & fails to update due to filesystem corruption over 10,000 times each day, is an outlier adn should not have been counted”.
You can view the complete list of events reported by the OS & accepted by the server in the Azafea documentation. (The “Deprecated Events” section documents, for posterity, events that were once recorded at some point in the history of Endless OS, but are not recorded by current OS versions.)
Since no personal data is collected, the metrics system is enabled by default. Defaults are powerful, so having the defaults this way around makes the data more representative of the user base than an opt-in system would; it also means we have a strong need to respect our users’ privacy. A page in Initial Setup allows the user to disable the metrics system; and until Initial Setup is complete, events are buffered locally but not submitted to the server. This means that events from early in the first boot process are not lost if the default is not changed, but that nothing is submitted until the device owner has been informed & given the chance to opt out. (If they do opt out, the buffered events are erased and no further events are buffered unless they later opt back in.)
There is one more component, eos-phone-home, which on the client side is completely separate, though the information flows into the same PostgreSQL database on the server. This is inspired by a system designed for Ubuntu (though I’m not sure if it is in use) and is conceptually somewhat similar to the DNF ‘countme’ system in Fedora. It sends to Endless OS Foundation:
- A one-time activation message the first time a device goes online, with channel, hardware vendor & model (e.g. “Dell Inc.”, “XPS 13 9380” for my laptop), and the current OS version (e.g. “5.0.4”). The server performs a GeoIP lookup against an offline database, stores the country code (e.g. “GB”) and location rounded to the nearest 1° of latitude & longitude, then discards the IP address without logging it.
- A ping from each online device (except live USBs), at most once every 24 hours, with channel, hardware vendor & model, current OS version, and the number of previous successful pings from this device. This allows measuring retention over time, without identifying any specific machine. The server determines a country code (and nothing more) via offline GeoIP, then discards the IP address without logging or storing it. The ping also includes a boolean for whether the user has enabled or disabled the system above. Roughly 90% of users have the full metrics system enabled.
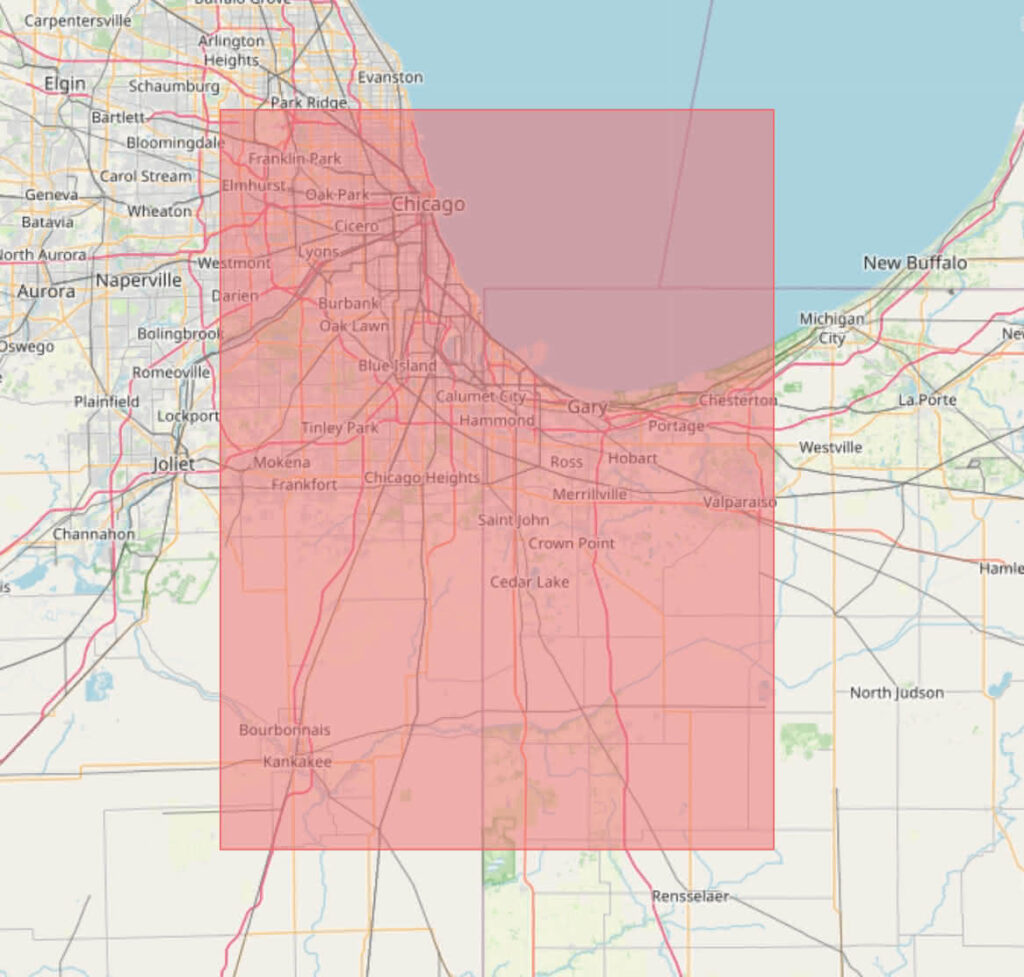
For context, 1° of latitude is roughly 111km. 1° of longitude varies between 111km at the equator and 0km at the poles; at the very north of the UK it’s about 55km. This is a 1° by 1° area over Chicago, a city of 2.7 million people:
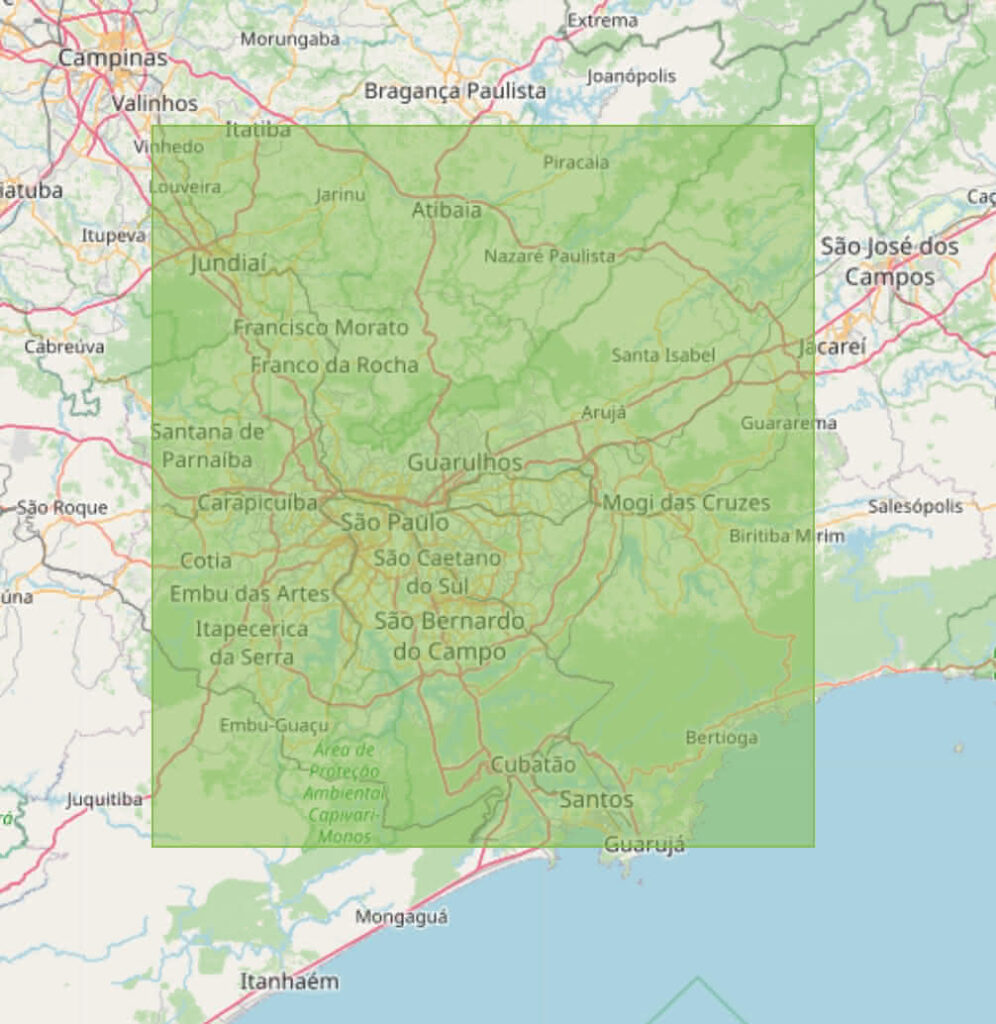
And here is São Paulo, where somewhere between 12 and 33 million people live, depending on how you count:
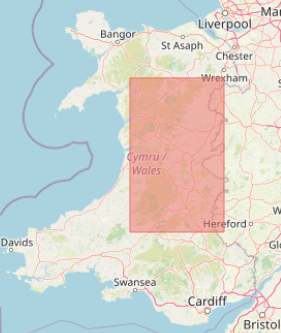
Here in the UK we sometimes describe large areas in terms of the area of Wales, so here is a 1° by 1° area that is roughly one-third of the size of Wales:
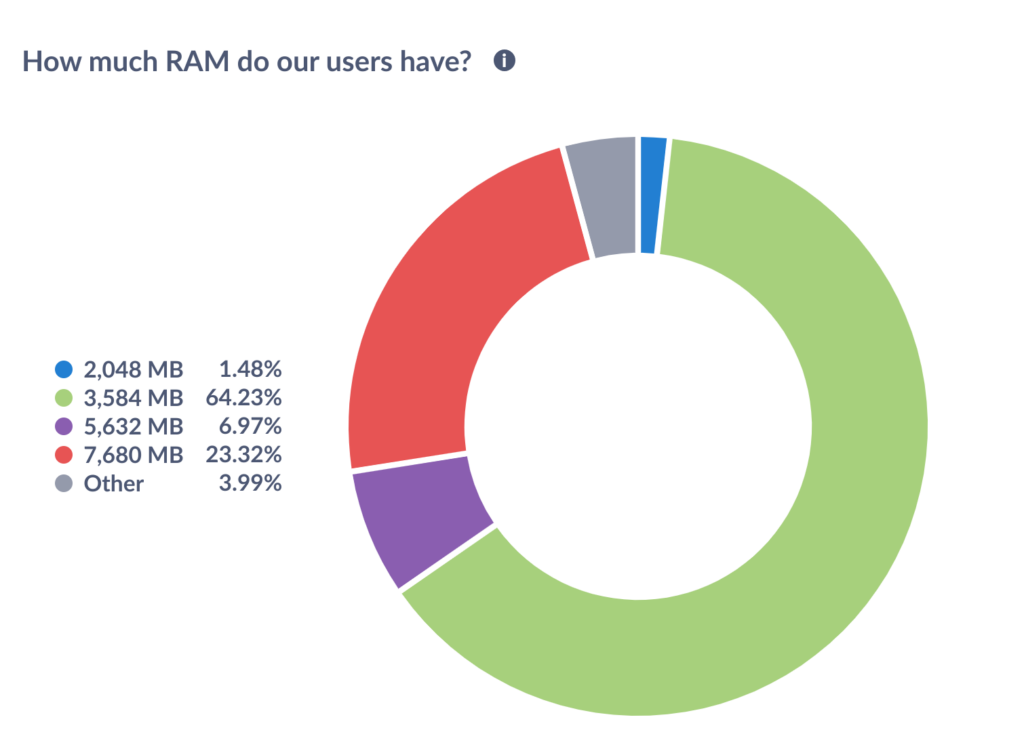
Every component described above is open-source and auditable. For completeness: it’s not an integral part of the stack, but we use a self-hosted instance of Metabase, an open-core business intelligence platform, to visualise the data stored in the PostgreSQL database. The Endless OS Foundation team has access to Metabase, and thence to the data stored by Azafea; nobody else has access to the raw data. Metabase allows us to make read-only charts and dashboards visible to the public. Here is a visualisation of the total RAM in Endless OS users’ machines in the past 24 hours at the time of writing, rounded to the nearest half-gigabyte (or rather, for my fellow pedants, gibibyte), taken from this event. You can see the live chart here. And if you mouse over one of the segments in the live chart, you can infer from the totals that there are somewhere north of 17,000 computers running Endless OS 4 or newer. (This is an underestimate of our total user count because it only considers the computers in use in a particular 24-hour window, which have not opted out of metrics, and which are not part of the ~20% of systems running an older OS version.)
And what have we actually learned?
As you can see above, at the time of writing, a large majority of Endless OS users have around 4GB of RAM. Most of the rest have rather more, but around 1.5% of our users are clinging on with just 2GB. This justifies our periodic work on better handling of low-memory conditions, and reminds us that RAM is not so plentiful as our own devices might have us believe. Perhaps if we could reduce the OS’s RAM usage, we could retain more users on such lower-end hardware.
We have a tool called eos-gates that intercepts users trying to run Windows software or install deb or RPM packages, and (where possible) guides them to the same app, or an equivalent, on Flathub. At the time of writing, by a very wide margin, the most popular Windows app our users try to install is Roblox. Sadly we can’t really recommend a straightforward way to install that particular game, but this data has helped us to find other apps that we should add to the mapping.
After the release of Endless OS 4, a few users came to our forum to report abnormally long boot times. We were able to confirm from our startup-timing metric that this was not an isolated problem, and address the issue in an OS update by moving a repository migration job that was extremely slow on spinning-disk systems with many apps installed to later in the boot process. We saw the improvement in the startup-timing data for subsequent OS releases.
We have also used this data to support decisions outside Endless OS Foundation. For a recent example, the team that develops the freedesktop SDK – used by every one of the 2,000+ apps on Flathub – were considering whether to require a CPU that supports the SSE 4.2 instructions. Because we collect anonymous hardware metrics, we were able to provide a snapshot of the CPUs in use on a given day by Endless OS users, and the freedesktop-sdk team was able to determine what proportion of those systems would be unable to run software from Flathub if this change were made. The other dataset under consideration was the Steam hardware survey, but Endless OS systems are a better representation of “regular people’s computers”, rather than gamers who you would expect to skew towards higher-end systems. (This case demonstrated that recording the CPU model name, such as Intel(R) Core(TM) i7-8565U CPU @ 1.80GHz, is not really adequate. CPU flags would be more useful. In this case, Jordan laboriously mapped the model names back to the relevant data.)
Future work
There is of course more that we could do on this system. In terms of more instrumentation: a common hypothesis is that most desktop Linux systems are single-user, in the sense that they only have one Unix user account (which may or may not be shared between multiple humans). This is supported by anecdote but it would be useful to be able to quantify this. There are many more questions like this: are multi-user systems multi-lingual? Do many users have multiple keyboard layouts configured? How common are different monitor configurations?
It would be interesting to look at ways to further anonymise the reported data. One possible approach is randomised response, where before submitting a boolean data point, you flip a coin. If it comes up heads, you report true. If it comes up tails, you report the actual boolean flag. Then, if 20% of reports are false, you can assume that the true ratio is 40%, without having to know which specific data points are valid. There are related techniques for numerical data where you bias the data with some known probability.
You could use this system as part of an opt-in user studies programme. For example, some tool could explicitly prompt a sample of users for their consent to record identifiable data over (say) a week, to perform some targeted behavioural study, perhaps in combination with a Shell extension implementing some experimental change. The site ID mechanism could be used to tag an individual system for the duration of the study, or which half of an A/B test the system fell into; and further events could be recorded for that week. After the week, the user would be prompted for some written feedback, then the ID would be removed and the additional events disabled.
While we cannot share the raw underlying data publicly – lest someone smarter than me figure out a way to de-anonymise it – I would love to see us publish dashboards of aggregated data, similar to the Steam hardware survey, Mozilla’s Hardware Across The Web, Flathub’s statistics, and so on. This hasn’t happened yet only for want of having time to do it. Please do get in touch if there is specific data of public interest.
And finally: Endless OS is just a moderate slice of the open-source desktop pie. We have somewhere in the low-to-mid tens-of-thousands of active online users – this is not insubstantial, but my guess is that it is one or two orders of magnitude smaller than larger platforms like Fedora, Ubuntu, and Steam OS. I believe the tools Endless has built are pretty good – shout-out to Kurt von Laven, Philip Chimento, Devin Ekins, Cosimo Cecchi, Mathieu Bridon, Guillaume Ayoub, Antoine Michon, and many other contributors over nearly a decade – and it would be great to see them adopted elsewhere in the desktop Linux space. Even more than that, I would love to see privacy-respecting telemetry accepted more widely in the desktop Linux space, so that we as a community can make better-informed, data-driven decisions.
great post.
I’d like this to be deployed on all distribution especially on other desktop distro to be able to guide developers to make choice not over their educated guess but rather on real-data (working on observability is I have some bias).