For a University project a spent some time working on a project to digitally track the water consumption in my shared flat. Since nowadays everything is about data collection, I wanted to give this idea a shot. In my flat we have a simple analog water meter in my house.
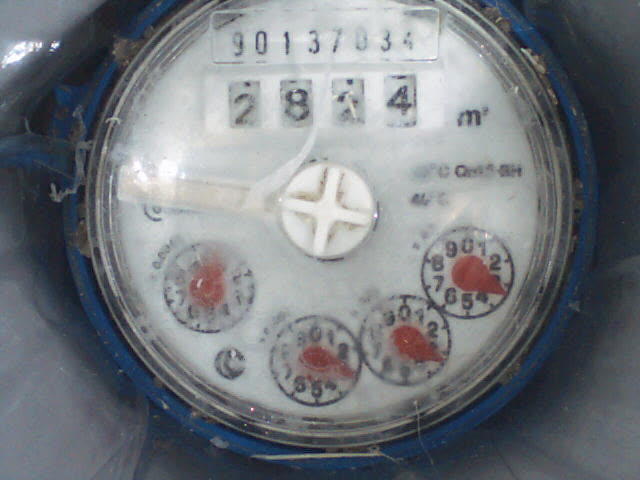
Sadly, my meter is really dirt under the glass and i couldn’t manage to clean it. This will cause problems down the road.
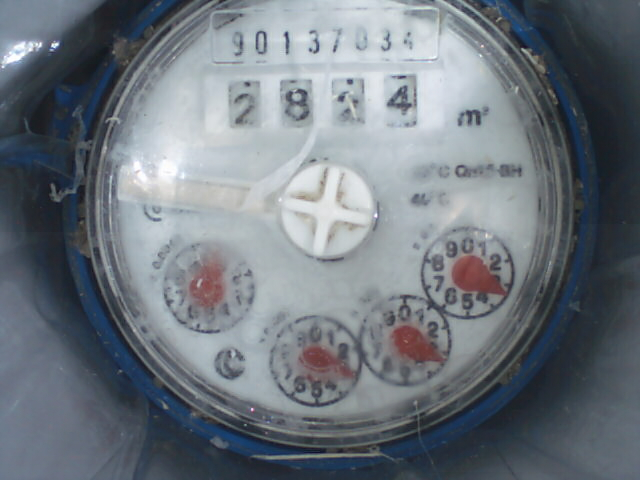
The initial idea was easy, add a webcam on top of the meter and read the number on the upper half it. But I soon realized that the project won’t be that simple. The number shows only the use of 1m^3 (1000 liters), this means that I would have a change only every couple of days, which is useless and boring. So, I had to read the analog gauges, which show the fraction in 0.0001, 0.001, 0.01 and 0.1 m^3. This discovery blocked me, and I was like “this is way to complicated”.
I have no idea how I found or what reminded me of OpenCV, but that was the solution. OpenCV is an awesome tool for computer vision, it has many features like Facial recognition, Gesture recognition … and also shape recognition. What’s a analog gauge? It’s just a circle with an triangular arrow indicating the value.
Let’s jump in to the project
I’m using a Raspberry Pi 1, a Logitech webcam, a juice bottle and some leds out of a bicycle light.
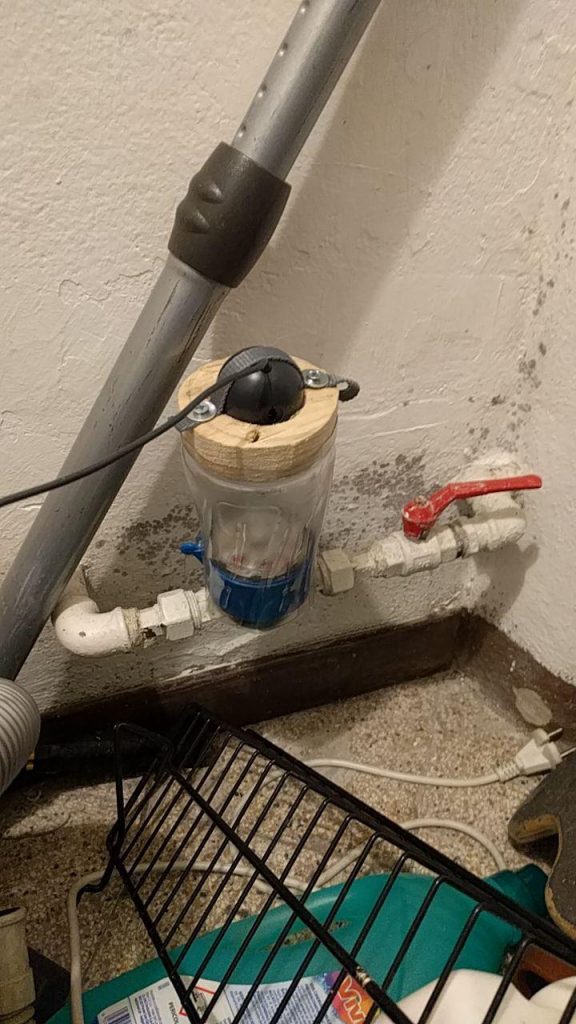
You need to find a juice bottle which fits nicely over the water meter. Cut of the top and bottom of the bottle and replace one side with a cardboard or wood with a hole in the middle. Attach the webcam centered over the hole and place a led on each side of the webcam to illuminate the water meter (you my need to cover them with paper to reduce reflection on the plastic of the meter).
First step is to set up the Raspberry Pi 1 (it doesn’t have to be a RPI, any computer running linux should work fine). You have to install a Linux Distro on the device, I used Archlinux. You can find a guide to install it on a Raspberry Pi 1 here.
After the initial setup you need to install git, python3 and opencv:
sudo pacman -S python3 git opencv
Clone the needed code to a know location:
git clone https://github.com/jsparber/water-meter-code.git
You need to create a new git repository to store the data and clone it to /home/alarm/water-meter-data/. If you want to use a different name or location you need to modify the name in measure.sh
On the RPI I have a cronjob which runs a script every minute. The script turns on the the led and then takes a picture then it turns the led off again, to save some energy.
With crontab -e you can modify the cron jobs, add * * * * * /home/alarm/code/take_photo.sh to run the take_photo.sh every minute, you may need to adjust the path depending on where you cloned the git repo.
After the picture is taken it calls a second script which then uses OpenCV to read the gauges and it appends the found values to a file which then is pushed to git repo. I had a issue with the webcam. After some time my script couldn’t access the webcam anymore, I solved it by rebooting the RPI when it wasn’t possible to take a picture. (I did a quick search on the internet, most people solved this issue by changing the cam)
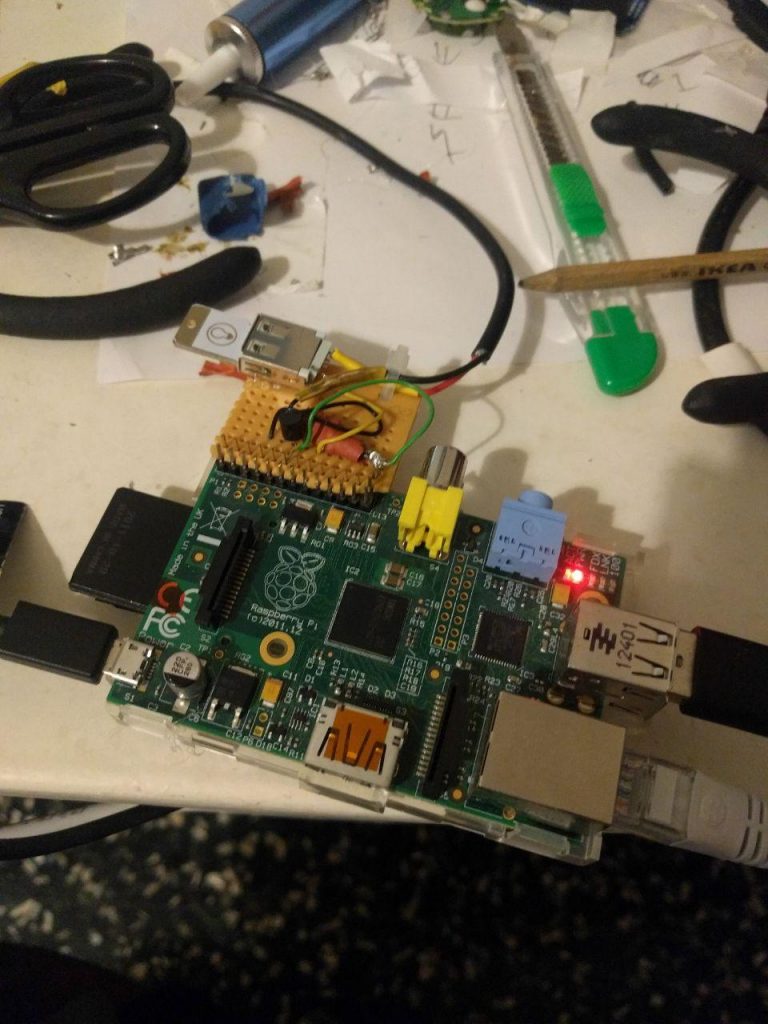
A nice optional feature is the home made switch connected to the RPI on the above picture. The schematics are really simple it’s only a 1KOhm resistor, a transistor and a USB extension cable. The transistor is switched on via the GPIO pin 18 of the Raspberry PI and gives power to the connected USB device. In this case I used it to connect the Leds.
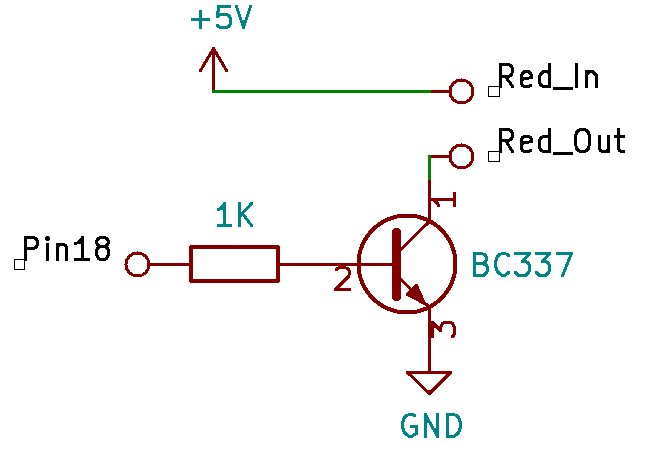
Inside the USB extension cable there should be 4 different colored cables. We need to cut only the red one and connect it the same way as the schematics above show it, where the red_in goes to the male connector and the red_out to the female side of the cable. The GND needs to be connected to the ground pin of the Raspberry Pi, if you need to power something which requires more then 500mA you should connect the ground directly to the power source the same way as you did with the +5V red cable. You need to use the same power source for the switch and the RPI or it may not work.
And now the OpenCv part
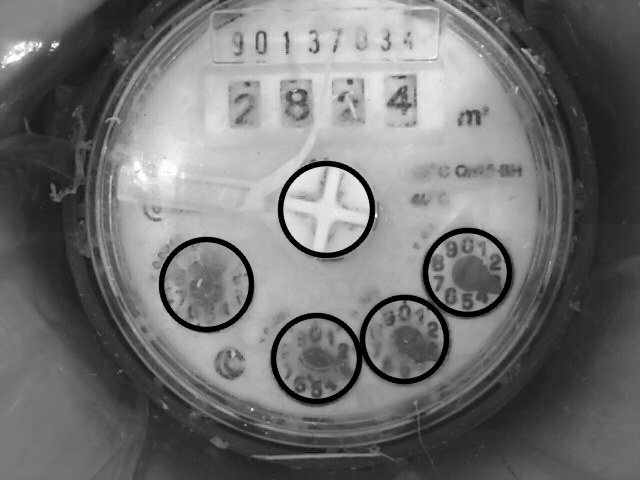
First my code finds the circles of the right size on the image, and uses the two most left ones as gauges for 0.1 m^3 and 0.01 m^3 (Sadly since my meter is so dirty I can’t reliably read the other two values).
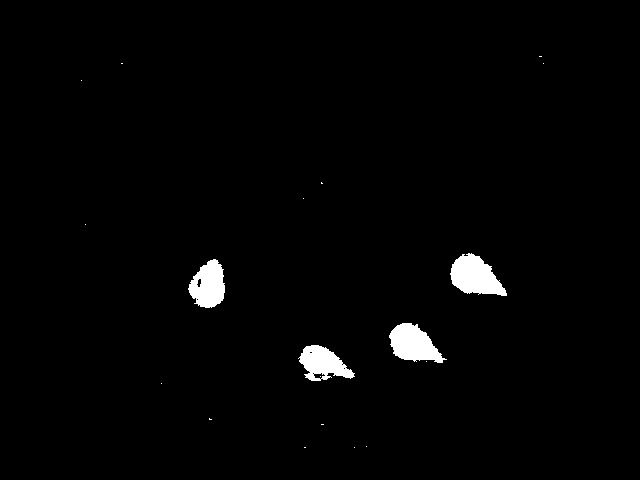
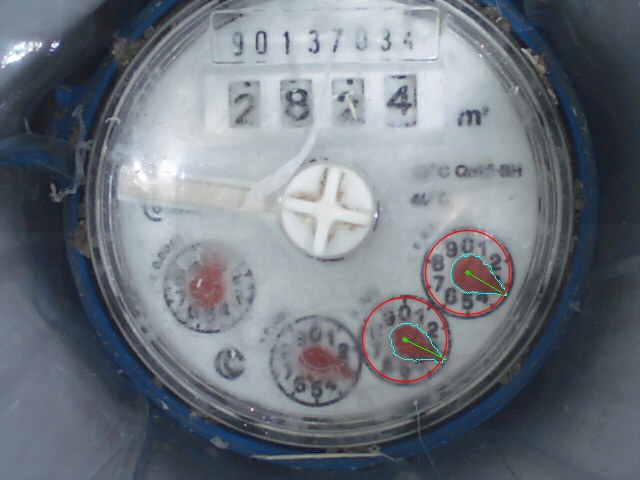
As the second step I create a mask which filters out everything what’s not red (remember the arrows are read). I take the contour of the mask which encloses the center of the circle I want to read. Then it finds the fairest point from the center of the circle which is the tip of the arrow. The software then creates a virtual line between the center and the tip, which is then used to calculate the angle which is basically the value shown on the gauge. The same thing is repeated for the other gauges.
This system sounds extremely simple, but to make everything work well together it isn’t that easy. OpenCV requires a lot of tuning, e.g selecting the right red color so that it detects it well but stays working even with light changes.
Conclusions
I learned a lot during this project, especially about OpenCV which i never used before. Sadly my water meter was really dirty so a couldn’t read all values and get also some wrong readings. So far I didn’t decide for what i want to use the collected data therefore I didn’t spend much time on finding a solution for read errors and problems I have when the gauges make a full turn. A easy solution would be to just keep an internal count of the water. And when we are unsure about a value we can go back to the memorized value.
The final plot can be found here. All values are saved directly without filter this causes the plot to have quite some noise but it allows to change the function used to filter later and adapt it to future needs.
Have you tried toothpaste? I cleared my meter screen with it .
The problem is that the dirt is inside of the meter, and i don’t want to disassemble it. Thank you for your suggestion anyways.
Cool project! Here’s a more hardware-based solution to the problem https://www.instructables.com/id/Monitoring-residential-water-usage-by-reading-muni/
Adding an ESP8266 to the mix, this gives you a very low-power sensor node that can easily be integrated into any home automation system.