I’ve been doing a bit of work for economist Andrew Leigh, who’s looking at geographical features (in particular, distance from the city, and distance from the coast). I got hold of map data from the Australian Bureau of Statistics (whose website usability could be the subject of a whole separate rant).
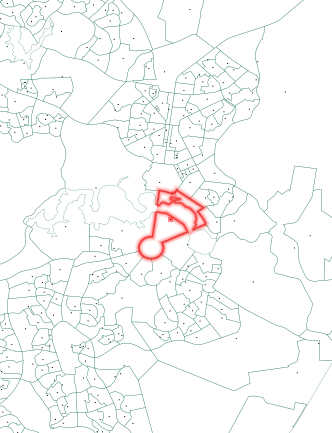
The program that comes with the dataset lets you do things like calculate average income per region (where regions come in such acronymic flavors as SD, SSD, SLA and CD), or even average income for those regions within 10km of the city, but it wouldn’t give me just the distance to the city or beach. Luckily, the data is in text format, and so having recently read about using the cairo graphics library in python, I got to work. First, a check that I can read the data properly – here is Canberra, and the highlighted region contains Parliament House.
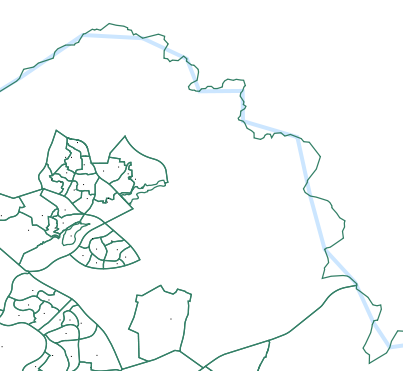
Next, coastline data comes from the state boundaries, but it’s far too detailed for nearest-point calculations. Since the co-ordinates were in plain text files, I could re-interpret them as standard SVG (Scalable Vector Graphics) files – hooray for open formats! Inkscape‘s mighty Simplify command whittled the boundaries from 220,000 nodes to a more managable 1000, whilst preserving the general shape.
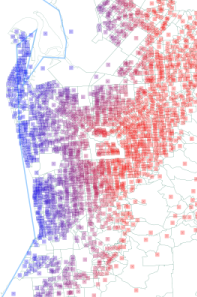
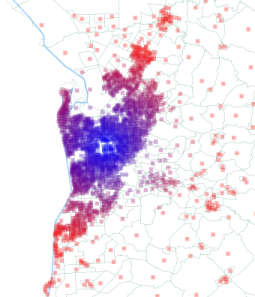
Overlay the calculated distances onto the image for a quick visual error-check, and I think I’m all done. Adelaide: distance to the coast on the left, and distance to the city on the right (zoomed out 2x relative to the left).
|
|