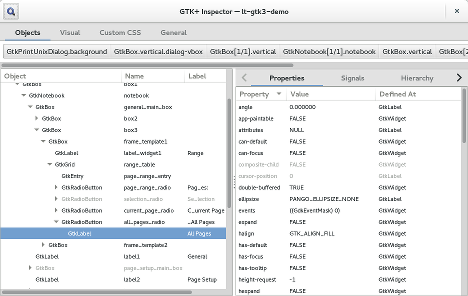
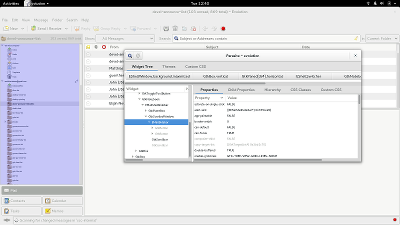
If you need to solve a tricky GTK+ problem in your application, gtkparasite is a very useful tool to have around. It lets you explore the widget hierarchy, change properties, tweak theme settings, and so on.
Unfortunately, gtkparasite is a tool for people ‘in the know’ – it is not part of GTK+, not advertised on our website, and not available out of the box on your average GTK+ installation.
At the Developer Experience hackfest in Berlin a few weeks ago, the assembled GTK+ developers discussed fixing this situation by making an interactive debugger like gtkparasite part of GTK+ itself. This way, it will be available whenever you run a GTK+ application, and we can develop and improve the debugging tools alongside the toolkit.
So, I’ve spent some of my spare time on this since the hackfest. The results are now in GTK+ master. I’ve started from the gtkparasite code, but things have changed quite a bit, and some new things have appeared.
 If you want to give it a try yourself, you can just use the Control-Shift-I or Control-Shift-D shortcuts to open an inspector window in any application that is using GTK+ master, or you can just set the GTK_DEBUG=interactive environment variable. Note that the keybinding will only work if GTK+ can find the org.gtk.Debug settings schema, so you probably want to run the application under jhbuild.
Here is a video of GtkInspector in action.
Among the things you can see in the video are interactive picking of widgets for inspection, visual debugging of graphic updates and baseline alignment, changing of widget properties, theme tweaks and general version and environment information.
I’ve also put together a page with ideas for future improvements to this debugging tool. If you are looking for a fun project to work on, this might just be it!
Thanks to Christian Hammond for creating gtkparasite and maintaining (over many years) such a useful debugging tool. The GTK+ inspector would not exist without it.


