I was in this situation recently: An application icon would not show up in GNOME shell, even after I double- and triple-checked that I did all the right things:
- Installed the desktop file with the right name in /usr/share/applications
- Installed the icon with the right name in the hicolor icon theme
- Make sure that Icon key in the desktop file has the right name
- Restart GNOME shell (this is necessary due to a bug where GNOME shell will not reliably pick up desktop file changes)
Still, I just get the generic executable icon: 
GNOME shell to the rescue
I asked GNOME shell maintainer Florian Müllner for help. He said: GNOME shell is probably picking up a stale desktop file from somewhere.
But from where ? I checked all the locations listed in XDG_DATA_DIRS to no avail. At this point, I was getting desperate, so I went back to Florian. He said: Just use looking glass to find out! If you don’t remember, looking glass is a pretty handy debugging console that is built right into GNOME shell. You open it by typing the command
lg
Into the Alt-F2 run dialog.
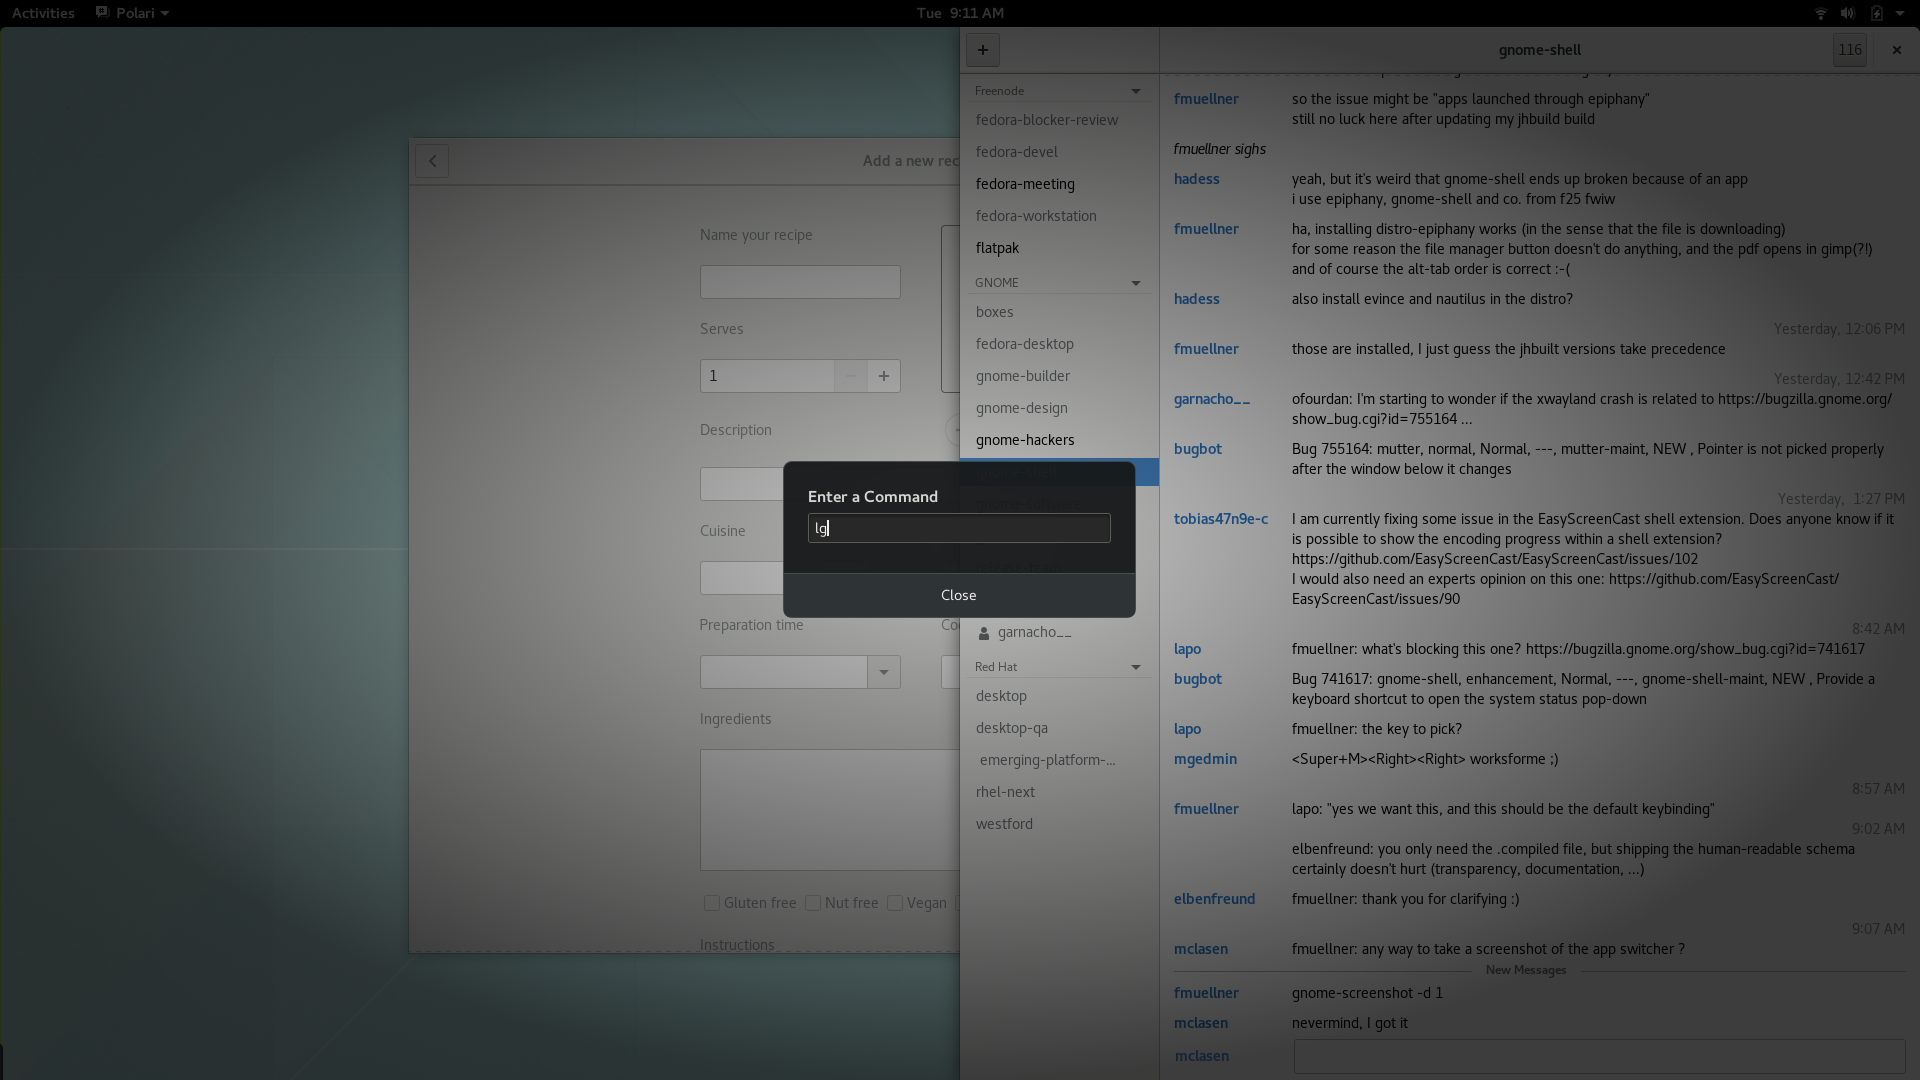 This brings up the looking glass. Here is how it helped me solve my problem:
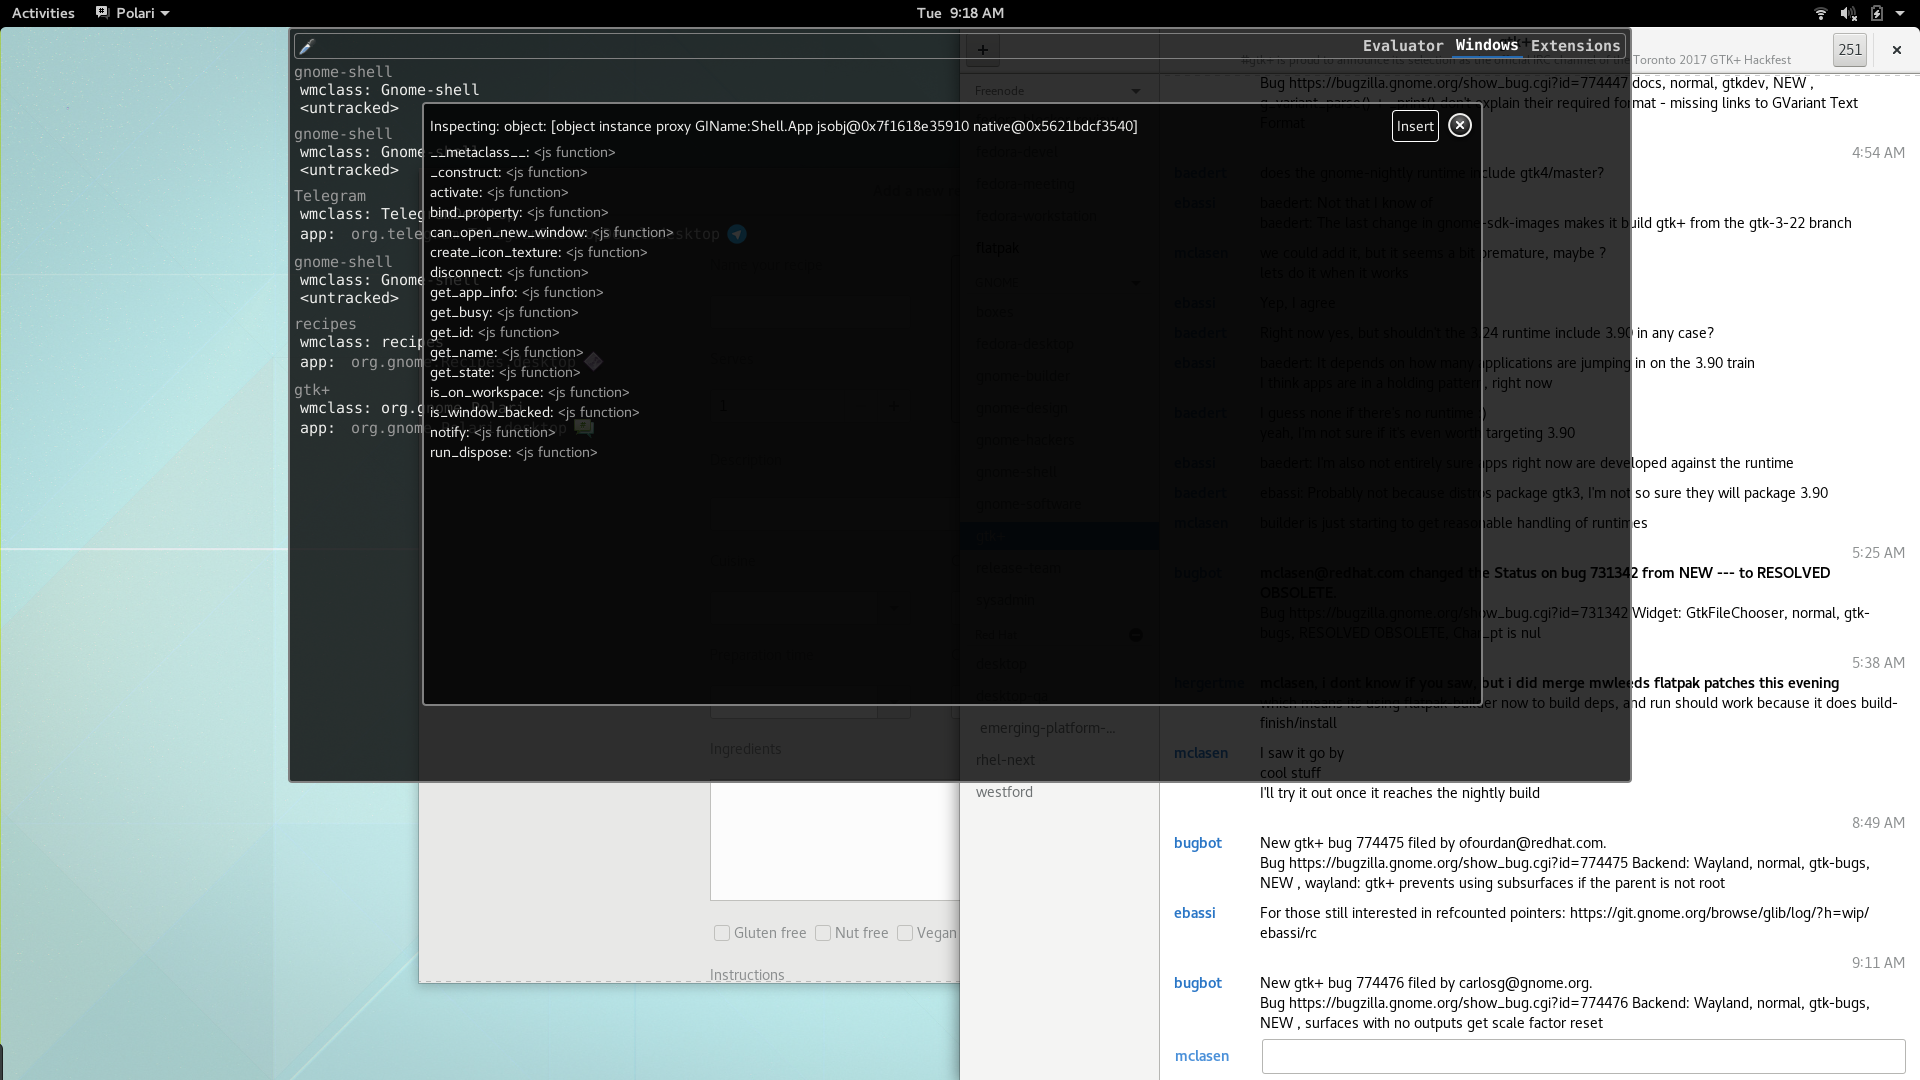 I switched to the window tab, then clicked on the application in question, and hit the ‘Insert’ button. That binds the object to a variable named r(x) (for some number x) in the Javascript evaluator.
Going there, I then typed the command
r(3).app_info.get_filename()
And that showed the problematic desktop file:
 I removed that file and restarted the shell once more, and now everything is working as it should:
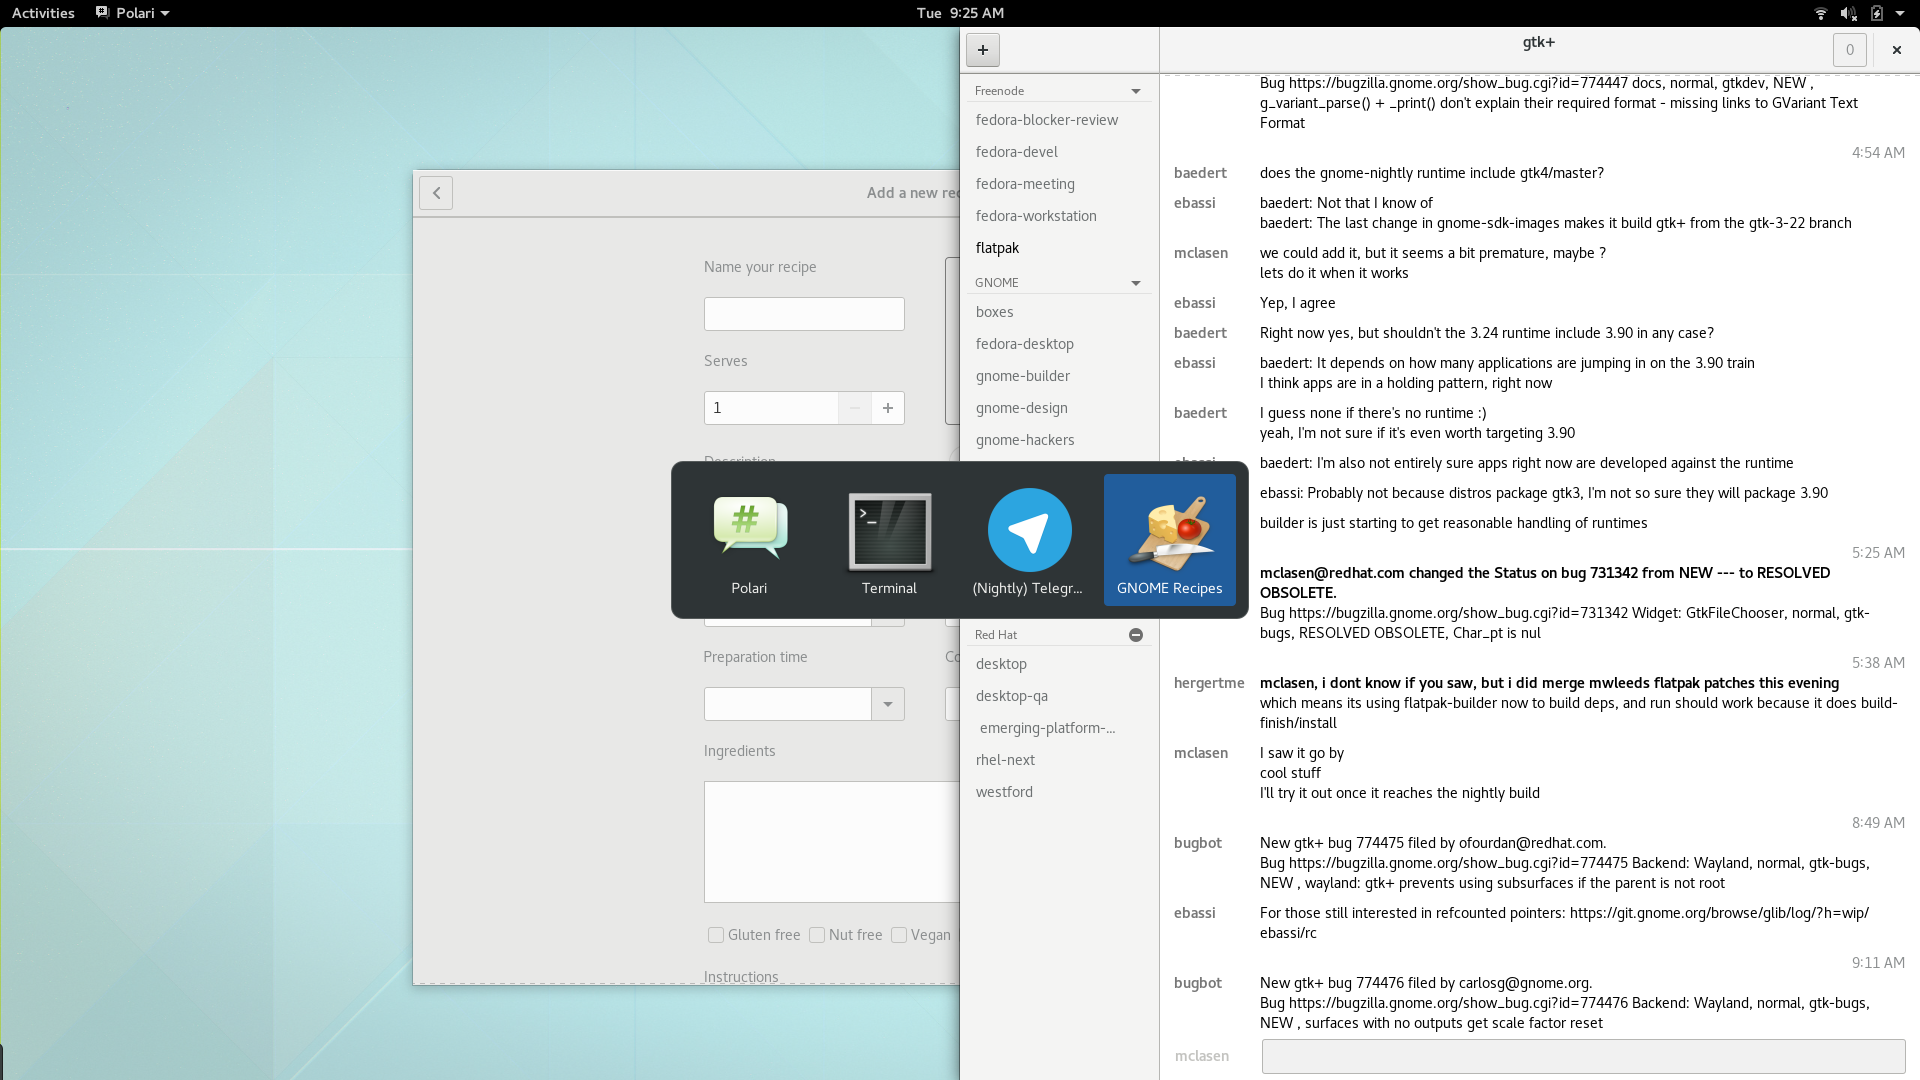 Thanks, looking glass!