GTK+ Inspector is a debugging tool that is built directly into GTK+ and is available in every GTK+ application by using of the shortcuts Ctrl-Shift-d or Ctrl-Shift-i.
Since I last wrote about it, a number of things have changed, so it is time to give an update on the state of GtkInspector as of GTK+ 3.15.2.
The UI has been revamped a bit to make best use of the limited space in the inspector window. Some of our newer widgets, such as GtkStackSwitcher, GtkSidebar and GtkSearchEntry, were helpful here:
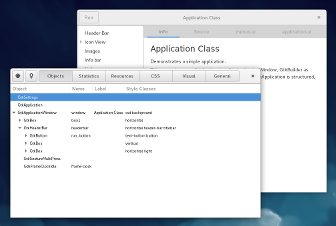
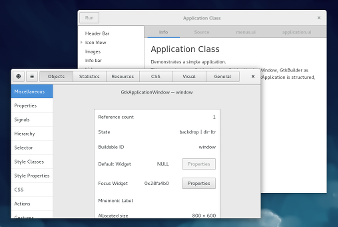
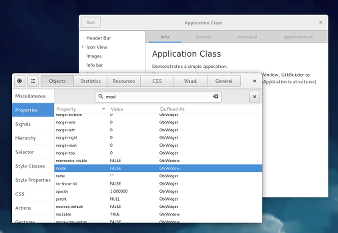 The object list has a new search implementation. It tries to deal better with search in a tree than the built-in search in GtkTreeView. Please try it and let me know what you think.
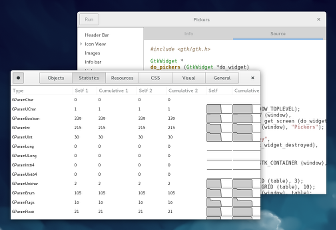
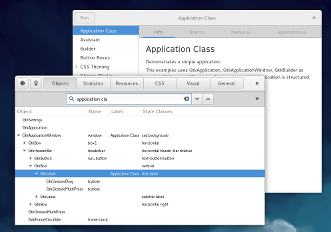 We’ve added a new feature: object statistics. This is made possible by corresponding new functionality in GLib. To enable it, run your application with
GOBJECT_DEBUG=instance-count
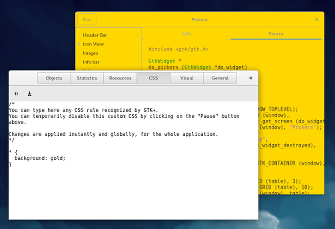
 The inspector is now using a separate display connection. This isolates it from many of the changes that you can make in it, such as CSS tweaks:
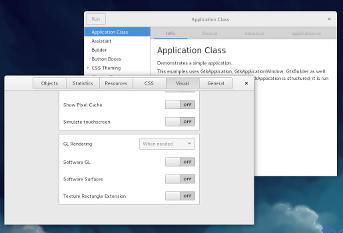
 After 3.14, we have started to integrate OpenGL rendering into GTK+. This is reflected in the inspector, which shows information about the OpenGL stack and offers some GL-related debug settings:
 More recently, I’ve spent my coding time helping to make glade support all of the new GTK+ widgets and features. We are not quite there yet, but you can already use client-side decorations, GtkHeaderBar, GtkSearchBar, GtkStack, GtkStackSwitcher and GtkSidebar with glade from git master.
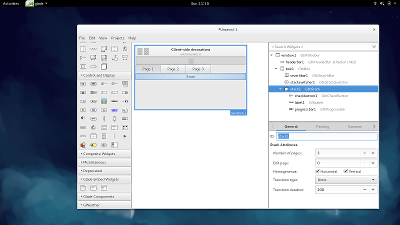 I hope to add a few more new widgets to this list soon. My personal goal for this effort is to use glade for all the ui files inside GTK+.
thanks for this such an informational post. it will really help me into my projects. thanks for helping peoples like me.
feel free to check my website (free premium proxy lists)