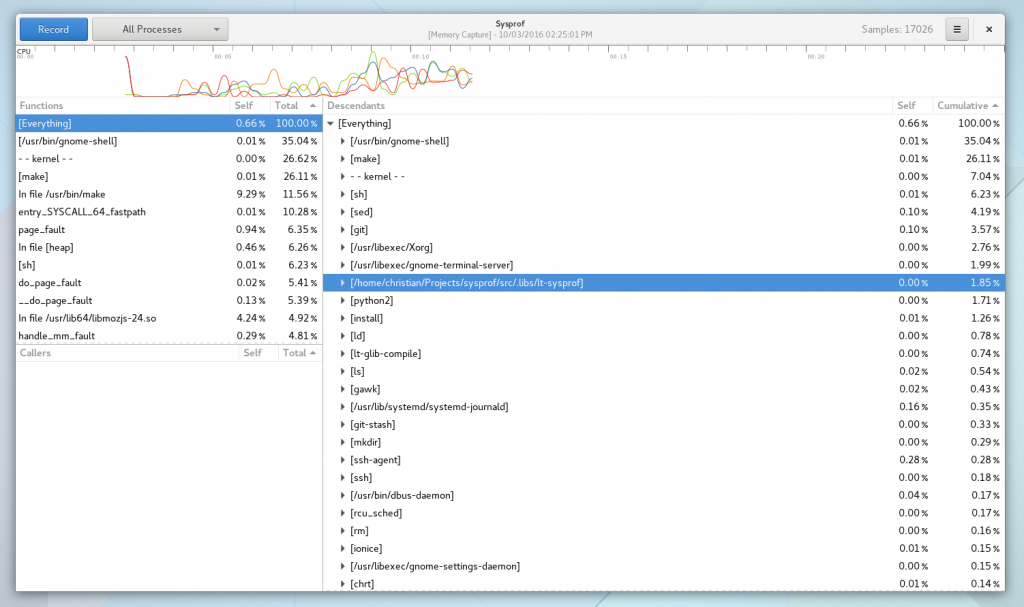
The 3.24 cycle is just getting started, and I have a few plans for Sysprof to give us a more polished profiling experience in Builder. The details can be found on the mailing list.
In particular, I’d love to land support for visualizers. I expect this to happen soon, since there is just a little bit more to work through to make that viable. This will enable us to get a more holistic view of performance and allow us to drill into callgraphs during a certain problematic period of the profile.
Once we have visualizer support, we can start doing really cool things like extracting GPU counters, gdk/clutter frame-clock timing, dbus/cpu/network monitors and whatever else you come up with.

Additionally we have some work to do around getting access to symbols when we are running in binary stripped environments. This means we can upload a stripped binary to your IoT/low-power device to profile, but have the instruction-pointer-to-symbol resolver happen on the developers workstation.
As I just alluded to, I’d love to see remote profiling happen too. There is some plumbing that needs to occur here, but in general it shouldn’t be terribly complicated.
I love the work you are doing on Builder and Sysprof. Thanks a lot for making our lives better =)