Sysprof design work

Since my last post, I’ve been working on a redesign of Sysprof (among other things) to make it a bit more useful and friendly to newcomers.

Many years ago, I worked on a small profiler project called “Perfkit” that never really went anywhere. I had already done most of my UI research for this years ago, so it was pretty much just a matter of applying that design to the Sysprof code-base.

Now you can individually show extra detail rows and much more. Same great Sysprof 3-part callgraph breakdown.

A screenshot of Sysprof

I’ll get some delayed 3.33.3 tarballs out this week.

GTK 3 Frame Profiler

I back-ported the GTK 4 frame-profiler by Matthias to GTK 3 today. Here is an example of a JavaScript application using GJS and GTK 3. The data contains mixed native and JS stack-traces along with compositor frame information from gnome-shell.

What is going on here is that we have binary streams (although usually captured into a memfd) that come from various systems. GJS is delivered a FD via GJS_TRACE_FD environment variable. GTK is delivered a FD via GTK_TRACE_FD. We get data from GNOME Shell using the org.gnome.Sysprof3.Profiler D-Bus service exported on the org.gnome.Shell peer. Stack-traces come from GJS using SIGPROF and the SpiderMonkey profiler API. Native stack traces come from the Linux kernel’s perf_event_open system. Various data like CPU frequency and usage, memory and such come from /proc.

Muxing all the data streams uses sysprof_capture_writer_cat() which knows how to read data frames from supplemental captures and adjust counter IDs, JIT-mappings, and other file-specific data into a joined capture.

A quick reminder that we have a Platform Profiling Initiative in case you’re interested in helping out on this stuff.

Sysprof Developments

This week I spent a little time fixing up a number of integration points with Sysprof and our tooling.

The libsysprof-capture-3.a static library is now licensed under the BSD 2-clause plus patent to make things easier to consume from all sorts of libraries and applications.

We have a MR for GJS to switch to libsysprof-capture-3.a and improve plumbing so Sysprof can connect automatically.

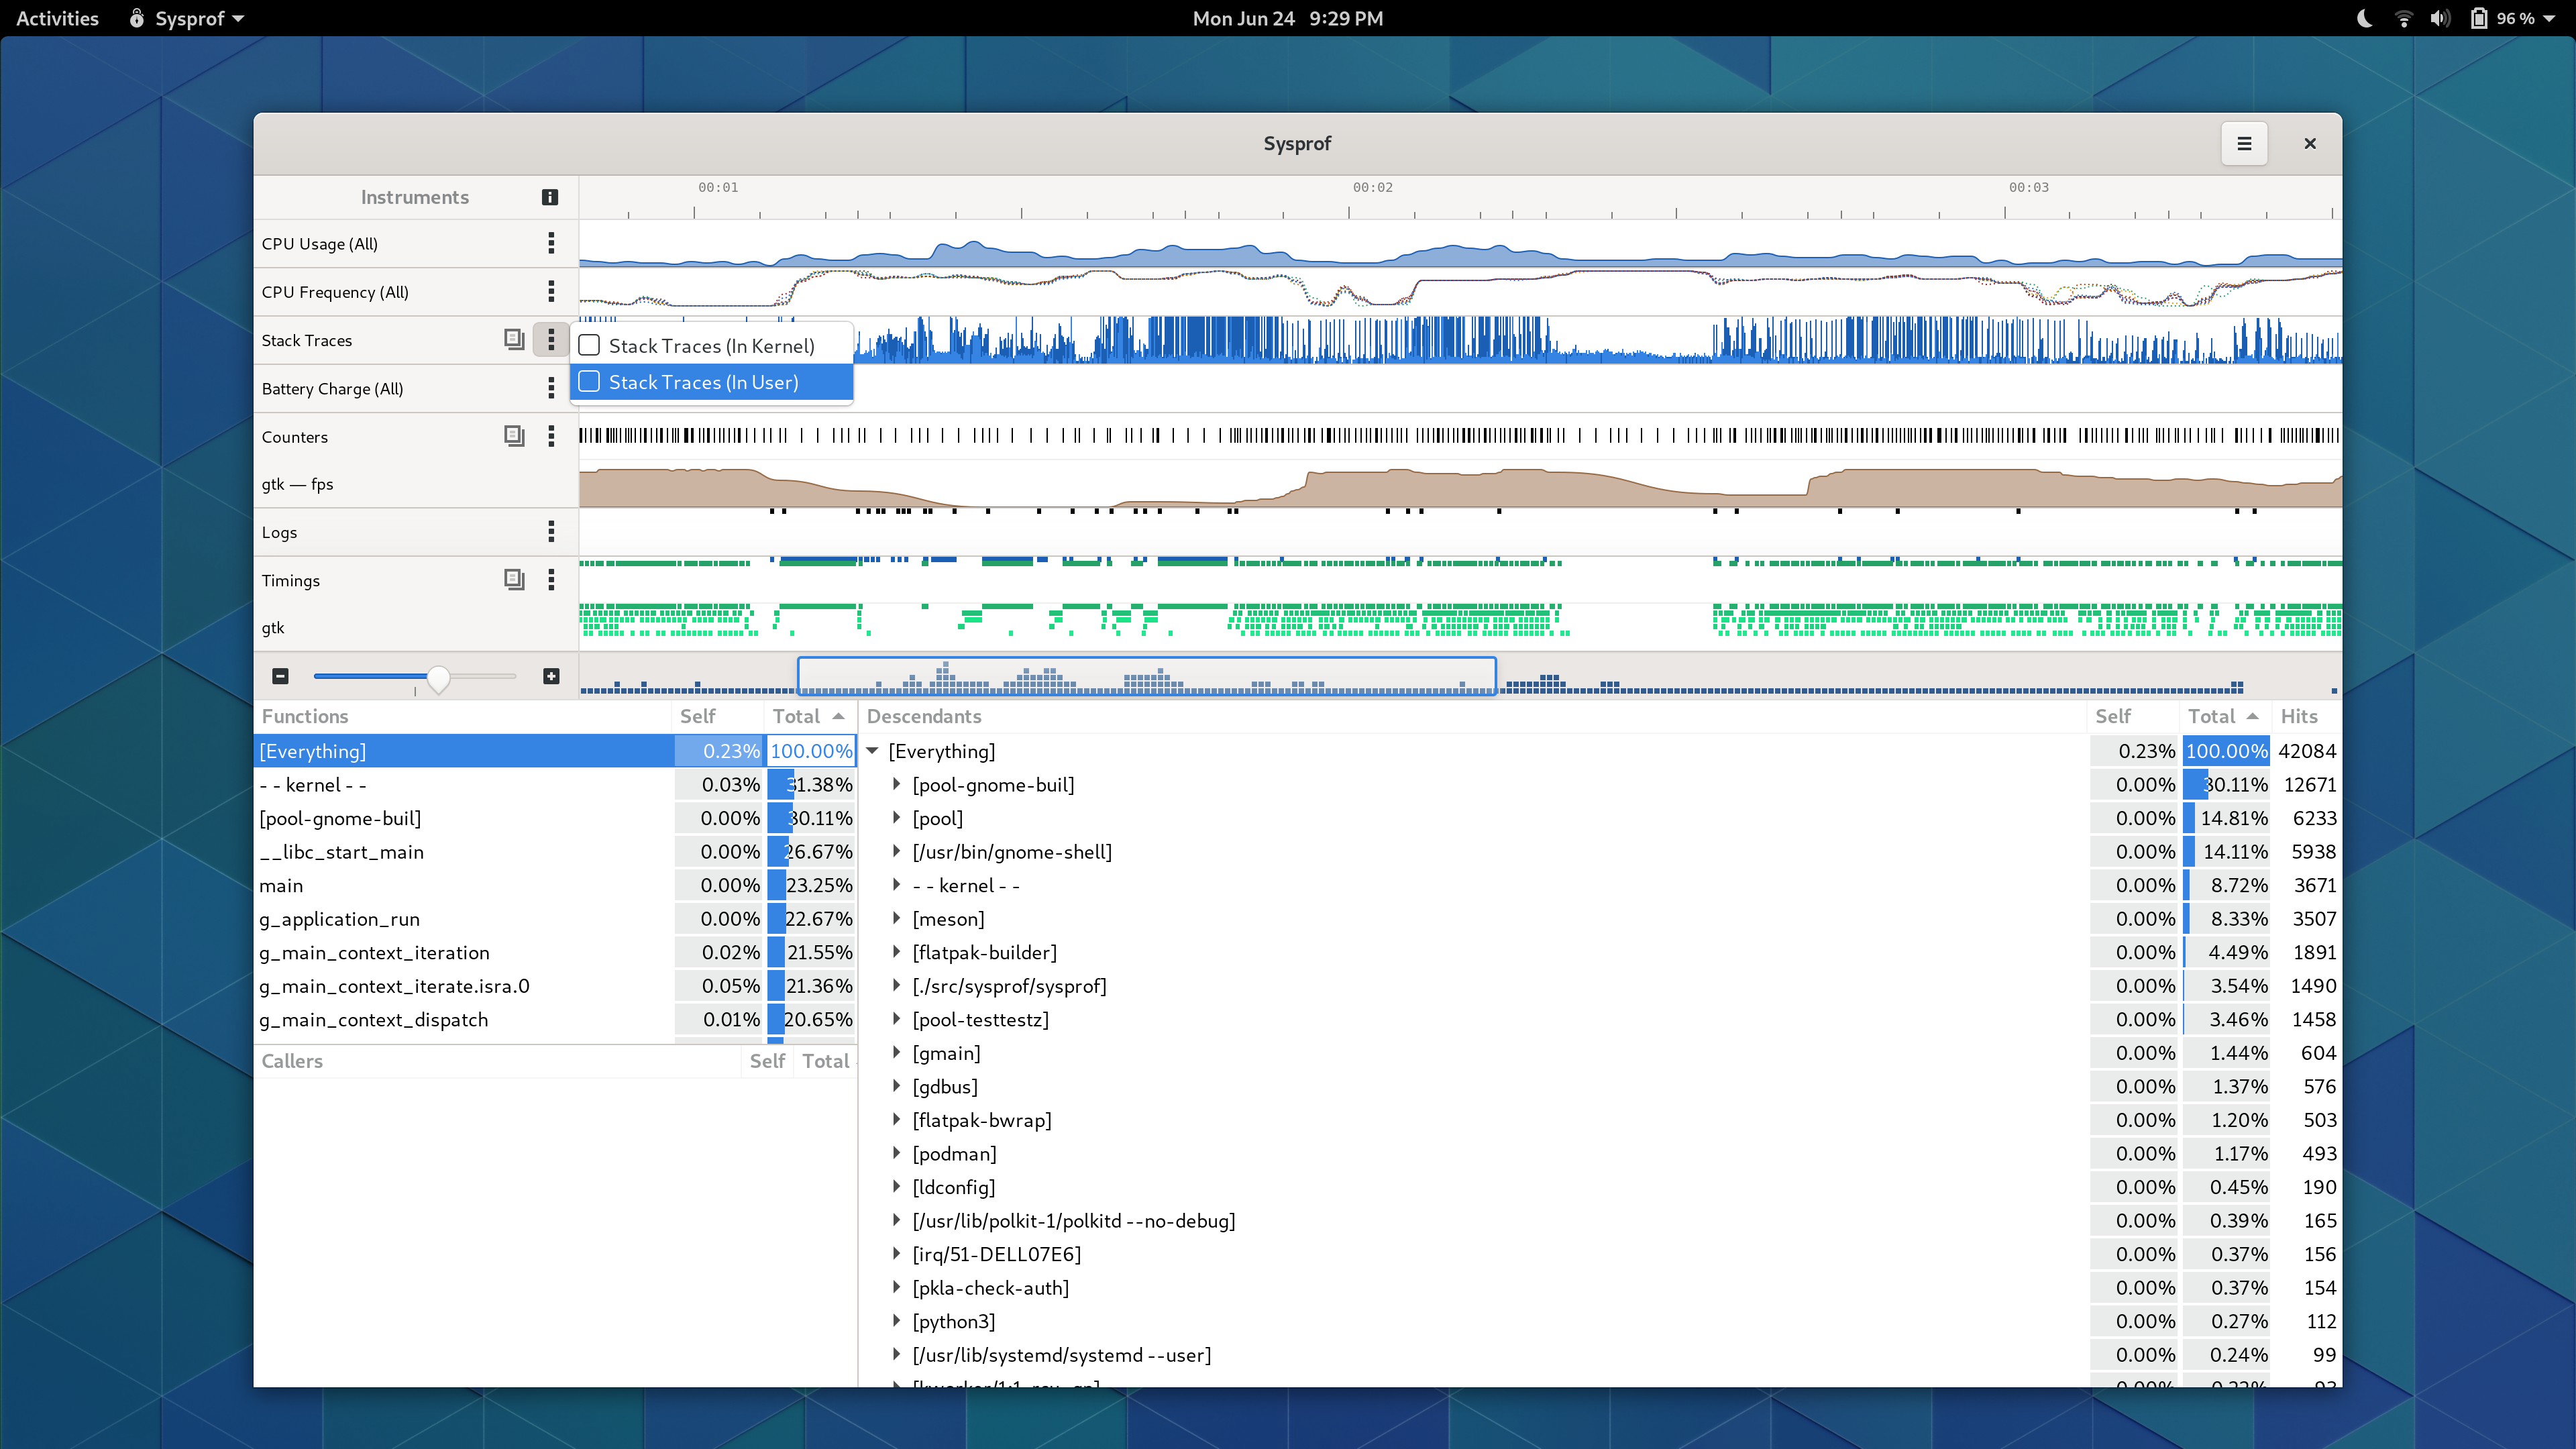
We also have a number of patches for GLib and GTK that improve the chances we can get useful stack-traces when unwinding from the Linux kernel (which perf_event_open does).

A MR for GNOME Shell automatically connects the GJS profiler which is required as libgjs is being used as a library here. The previous GJS patches only wire things up when the gjs binary is used.

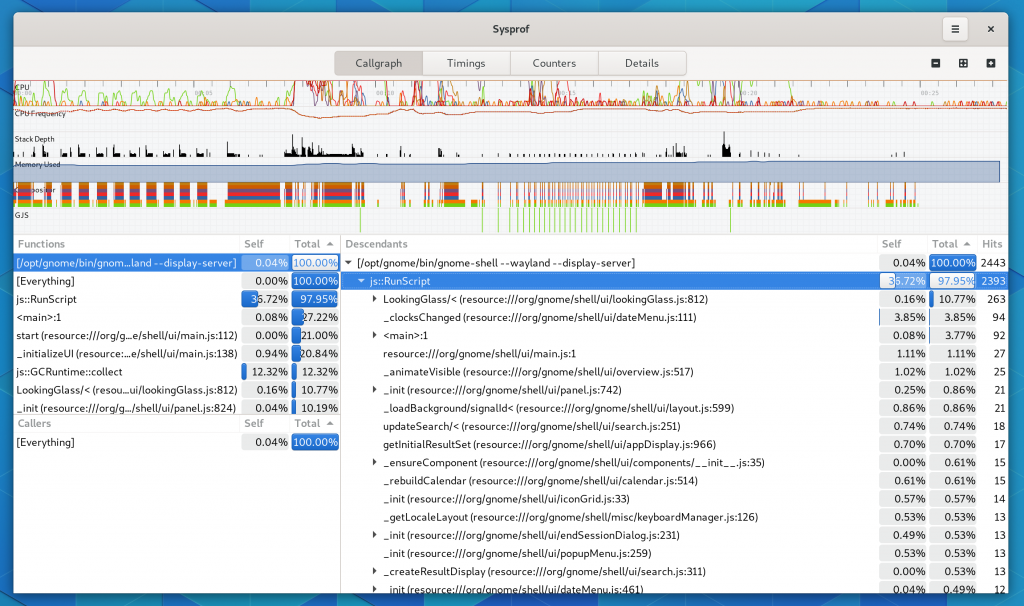
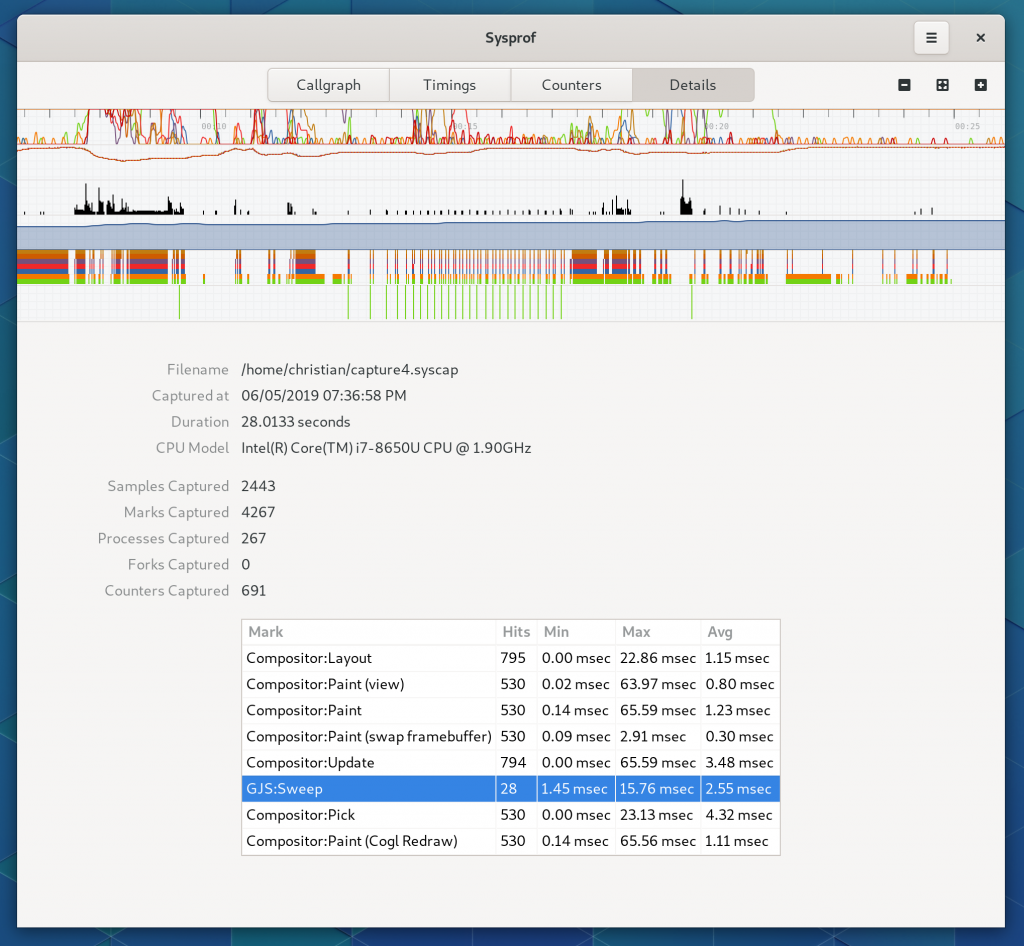
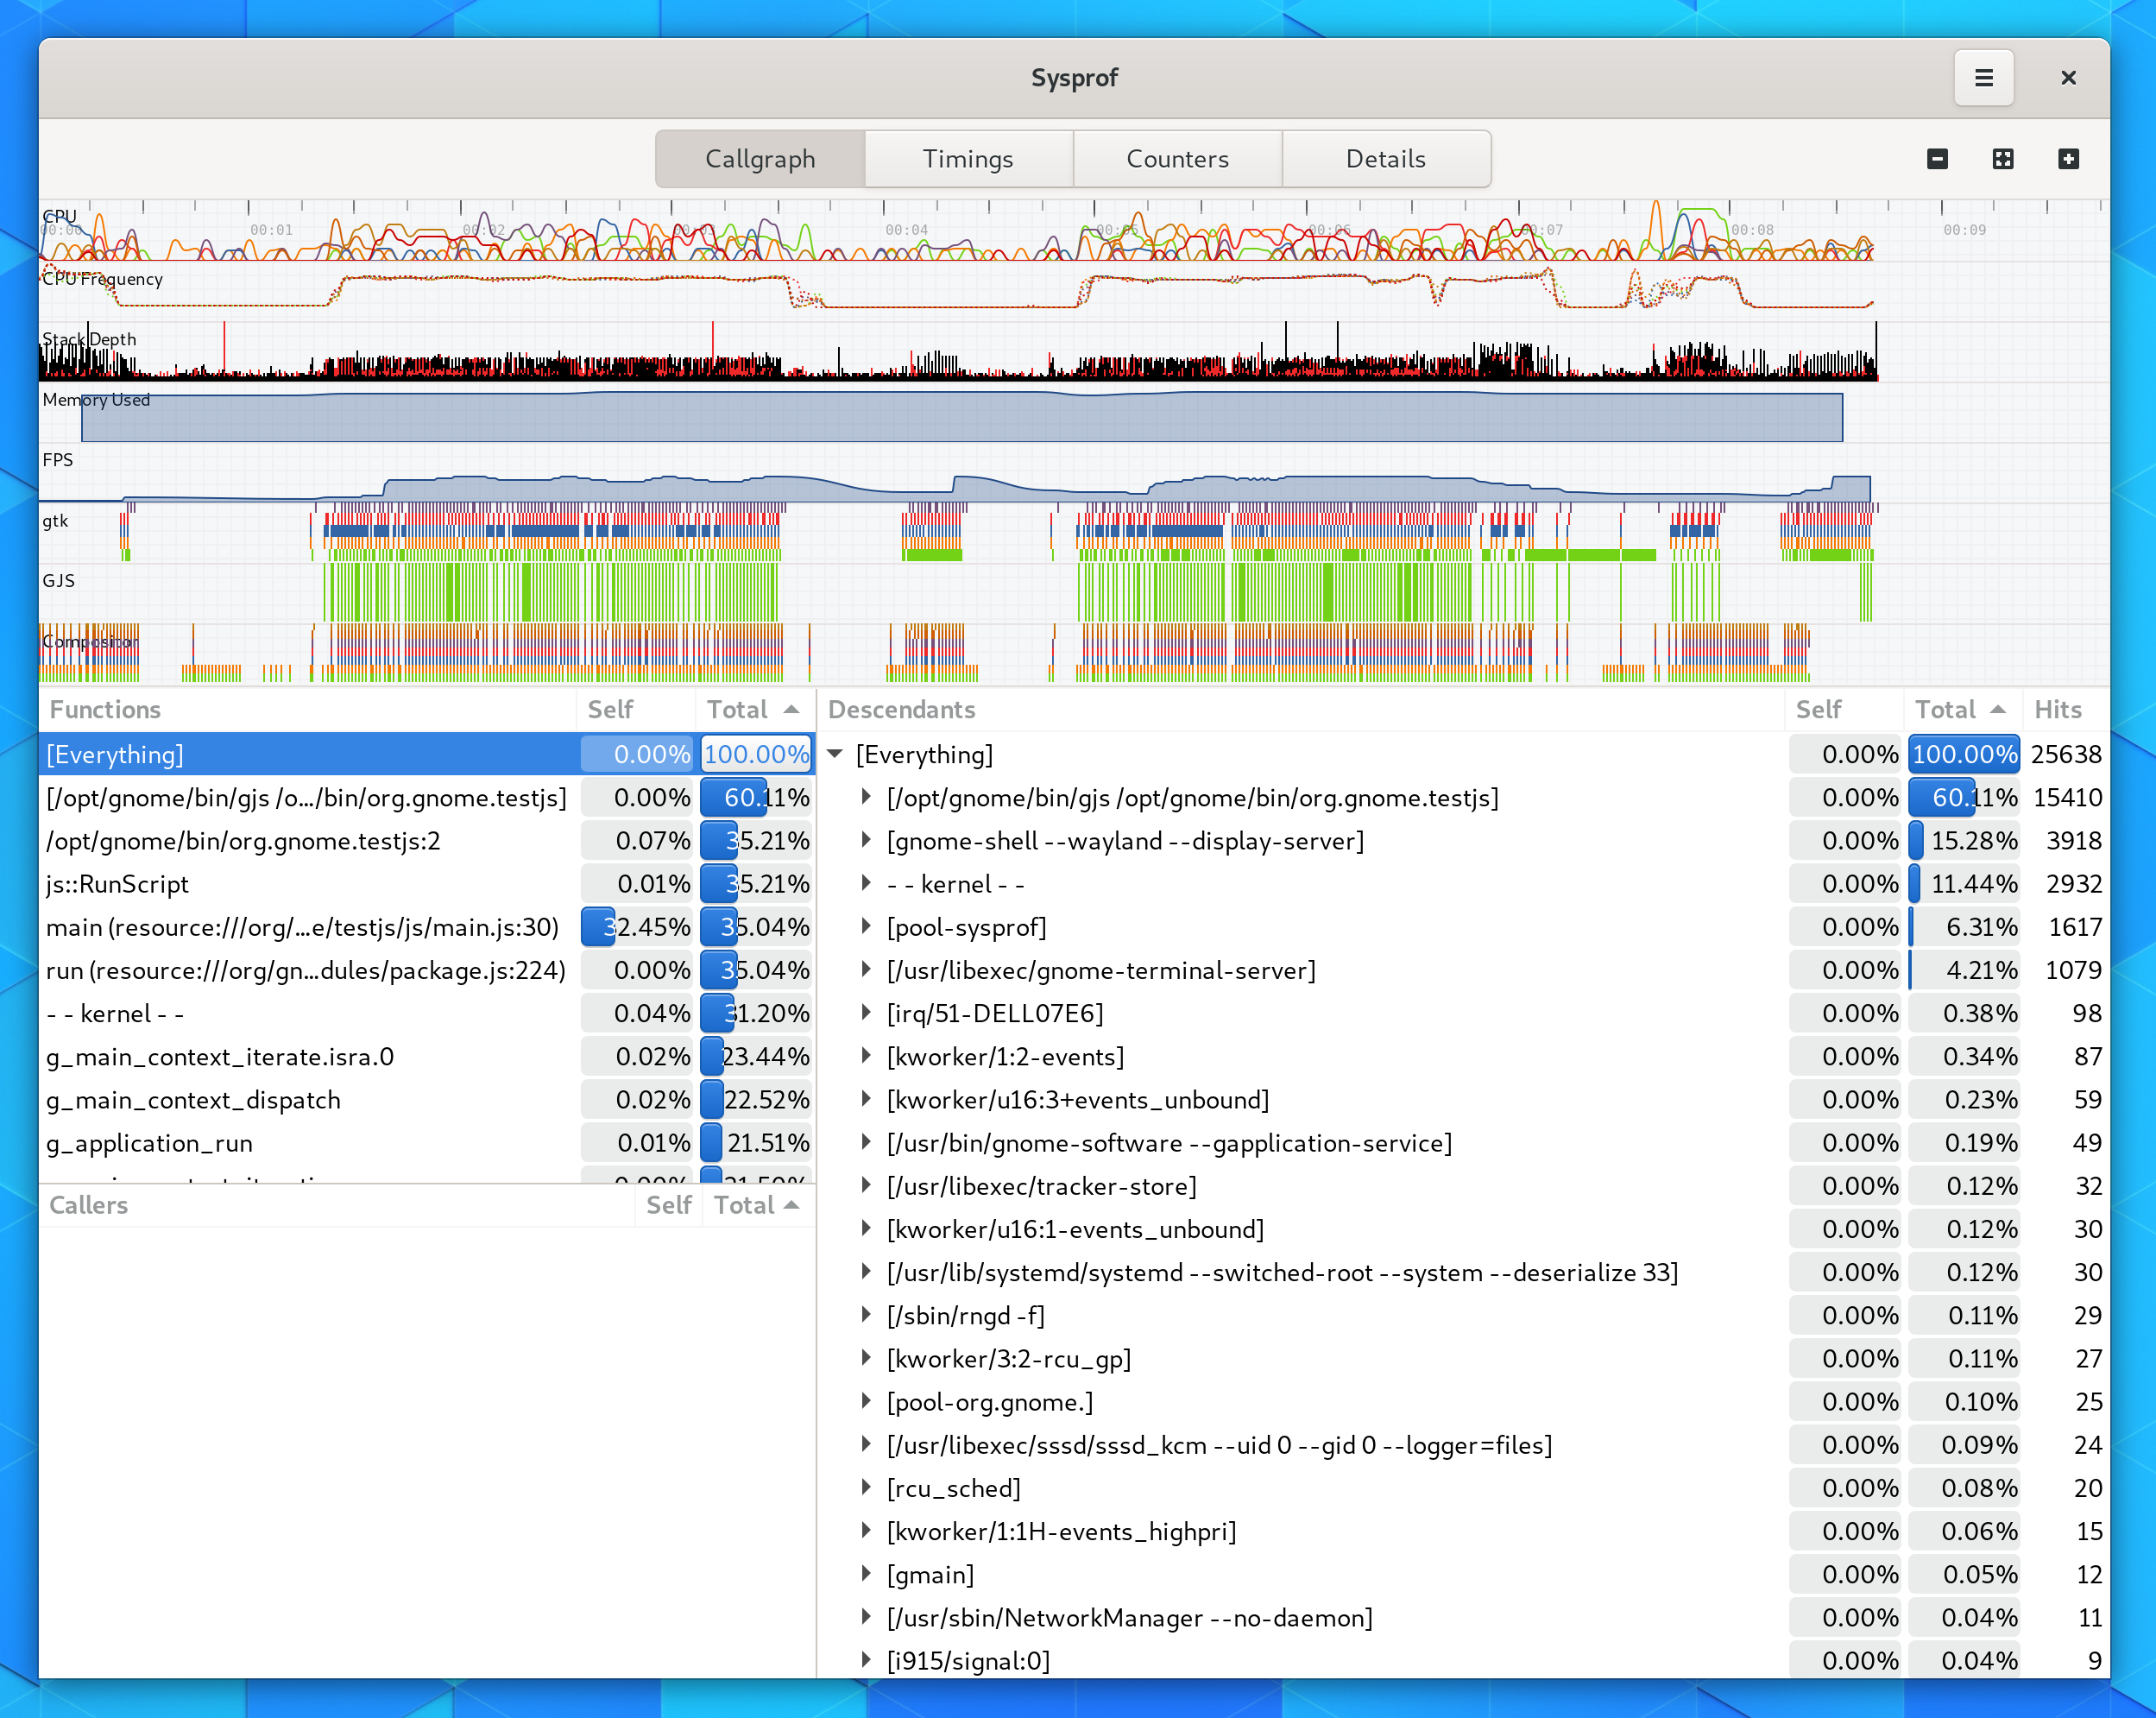
With that stuff in place, you can get quite a bit of data correlated now.

# Logout, Switch to VT2
sysprof-cli -c "gnome-shell --wayland --display-server" --gjs --gnome-shell my-capture.syscap

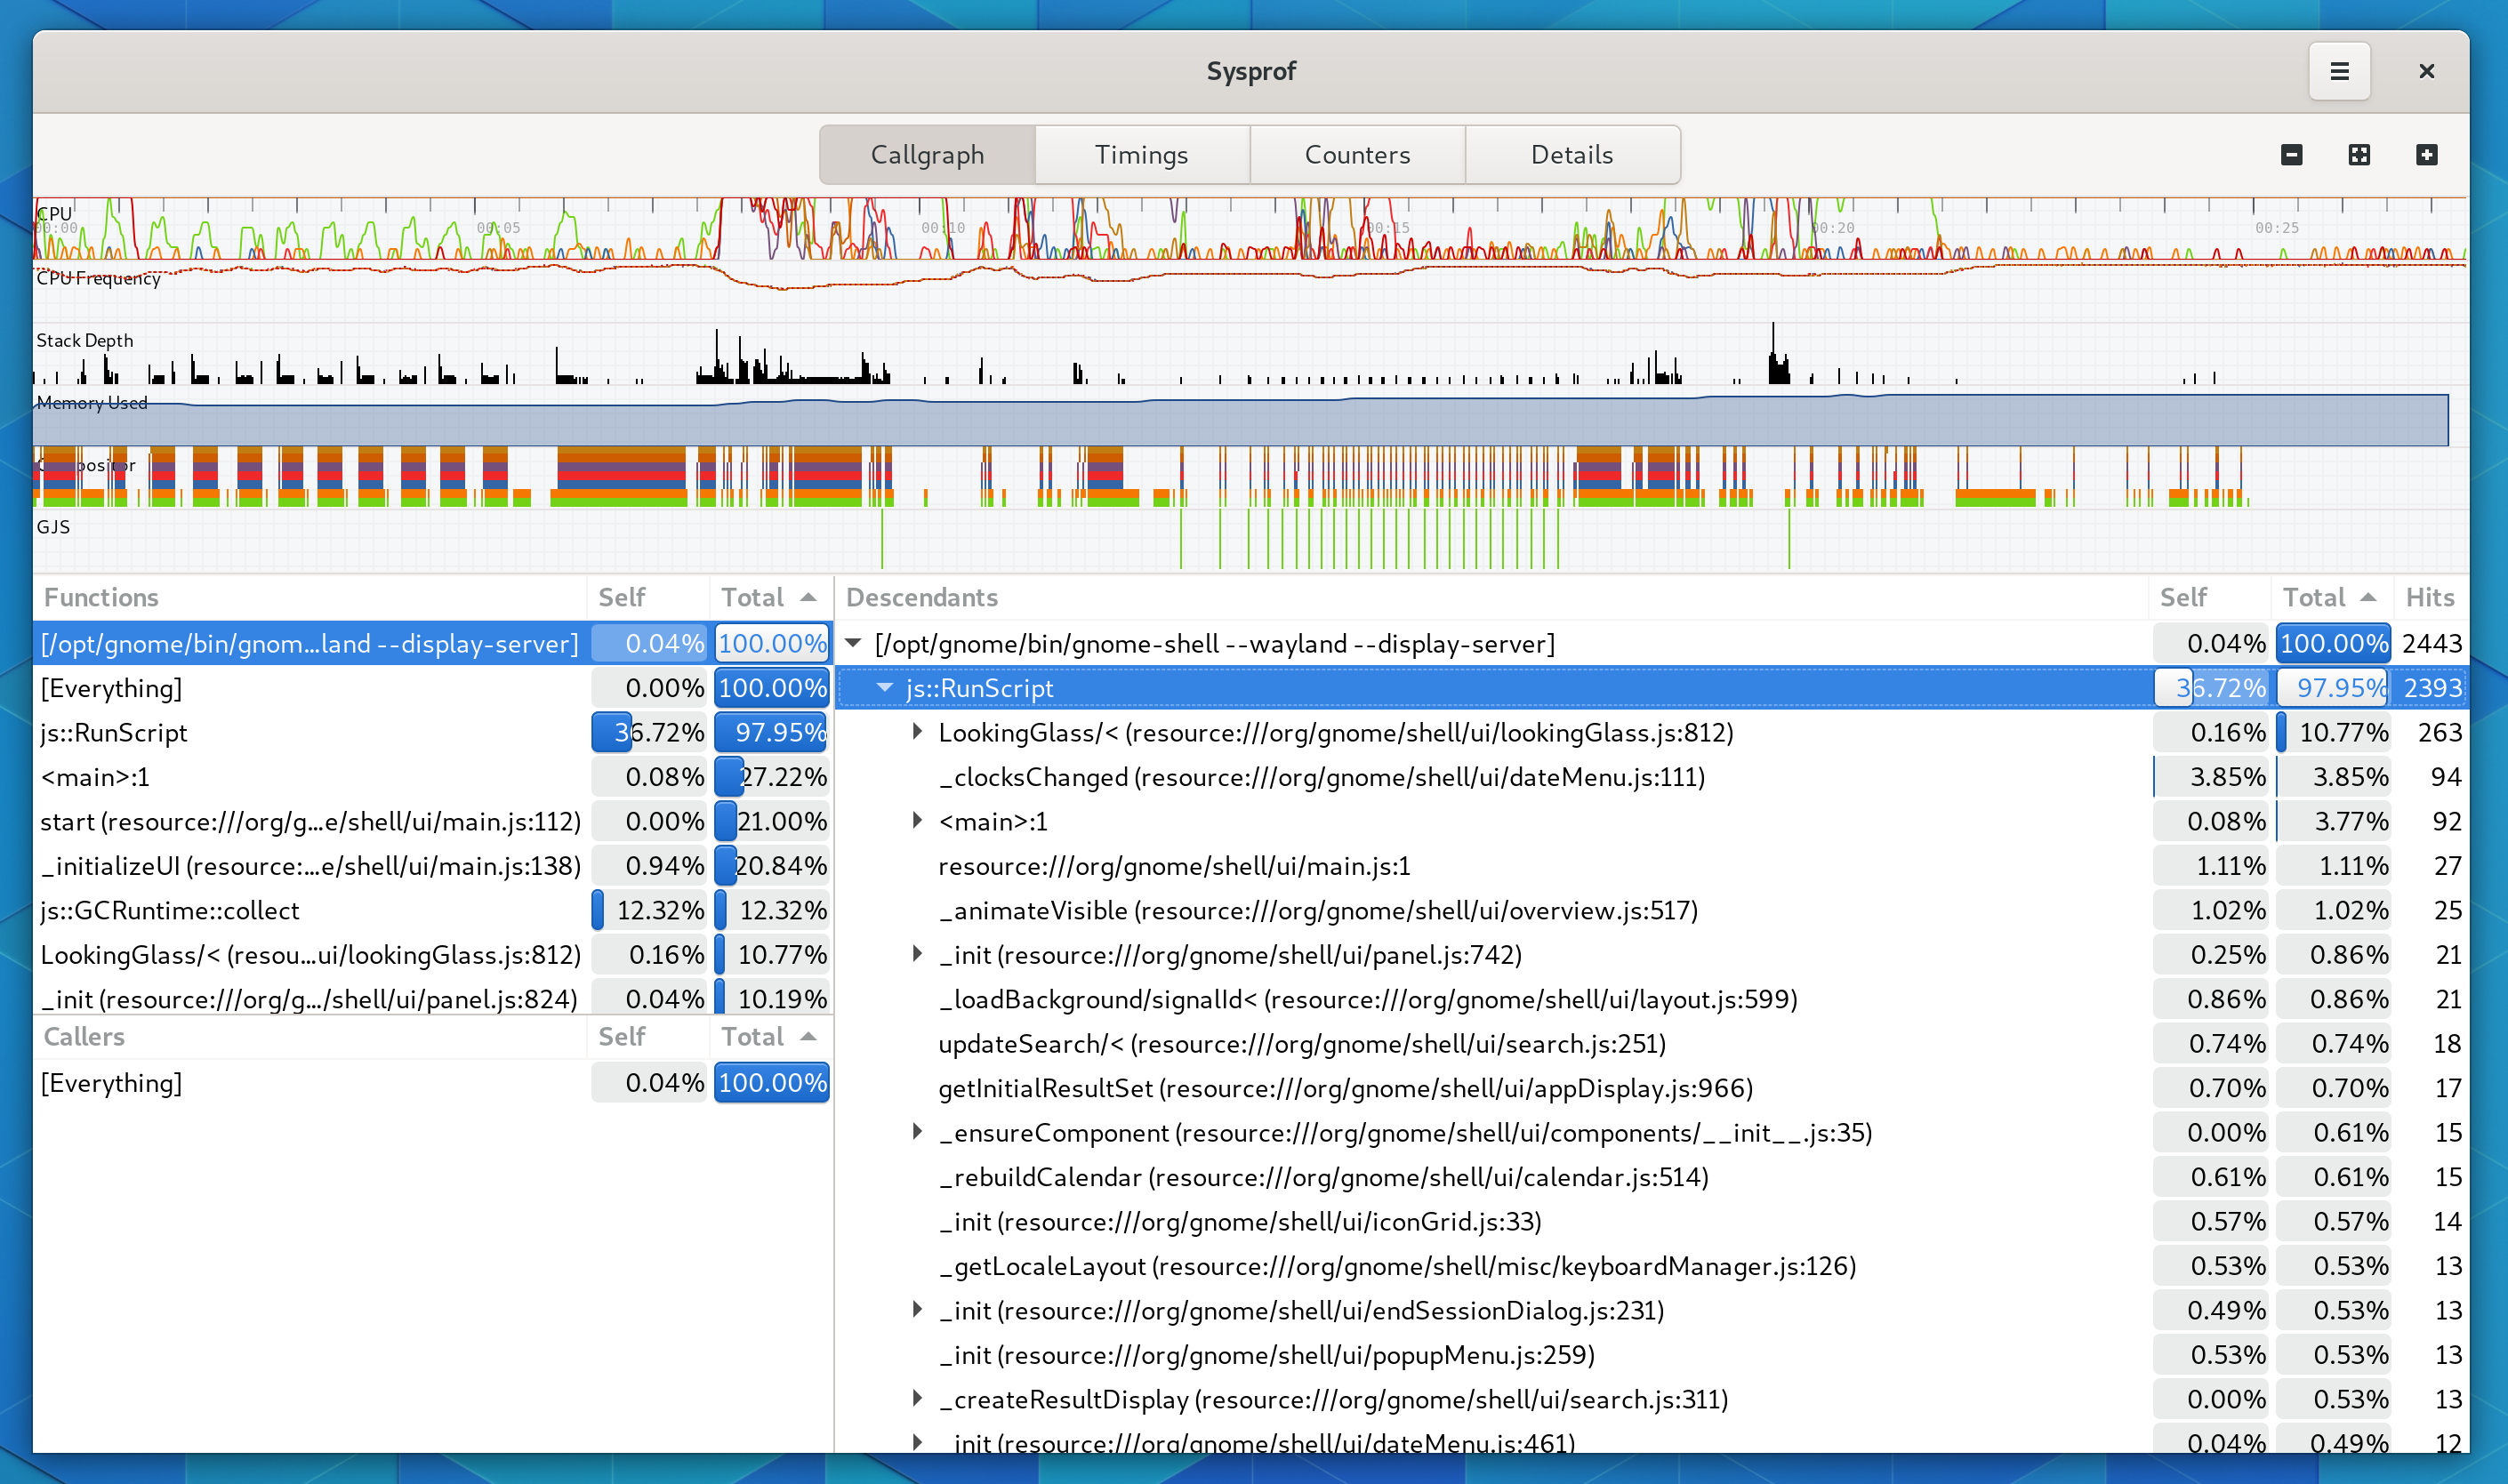
If you don’t want mixed SpiderMonkey and perf stack-traces, you can use --no-perf. You can’t really rely on sample rates between two systems at the same time anyway.

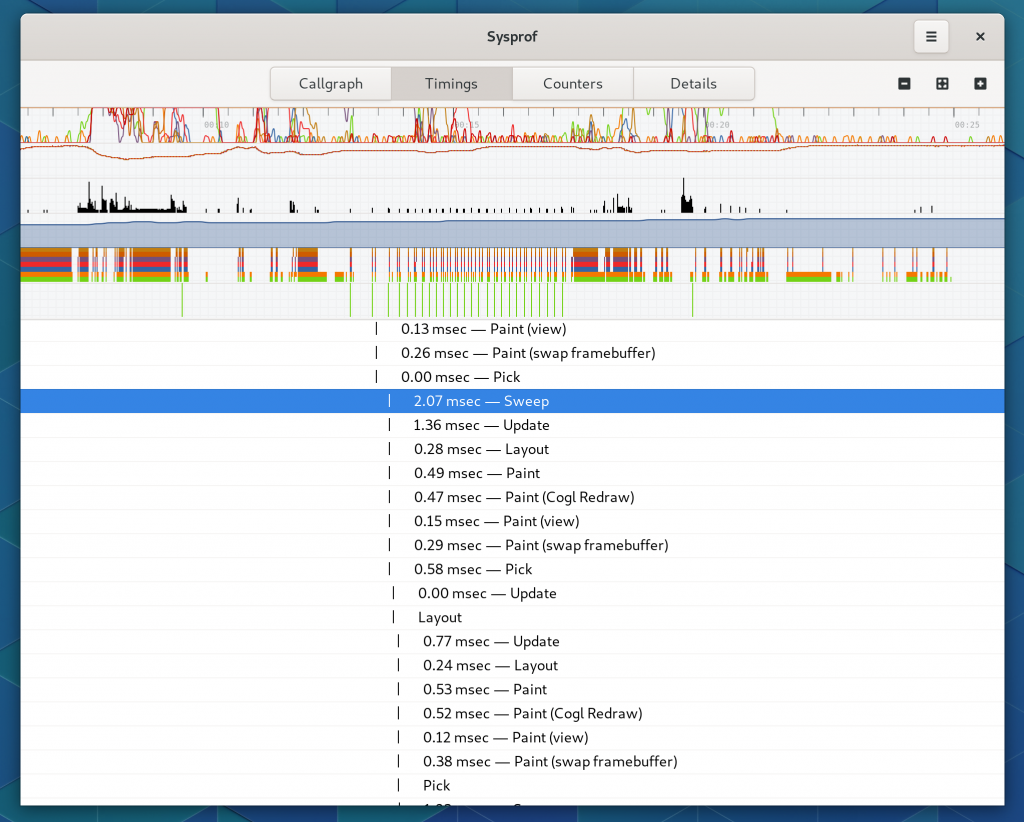
With that in place, you can start correlating more frame data.