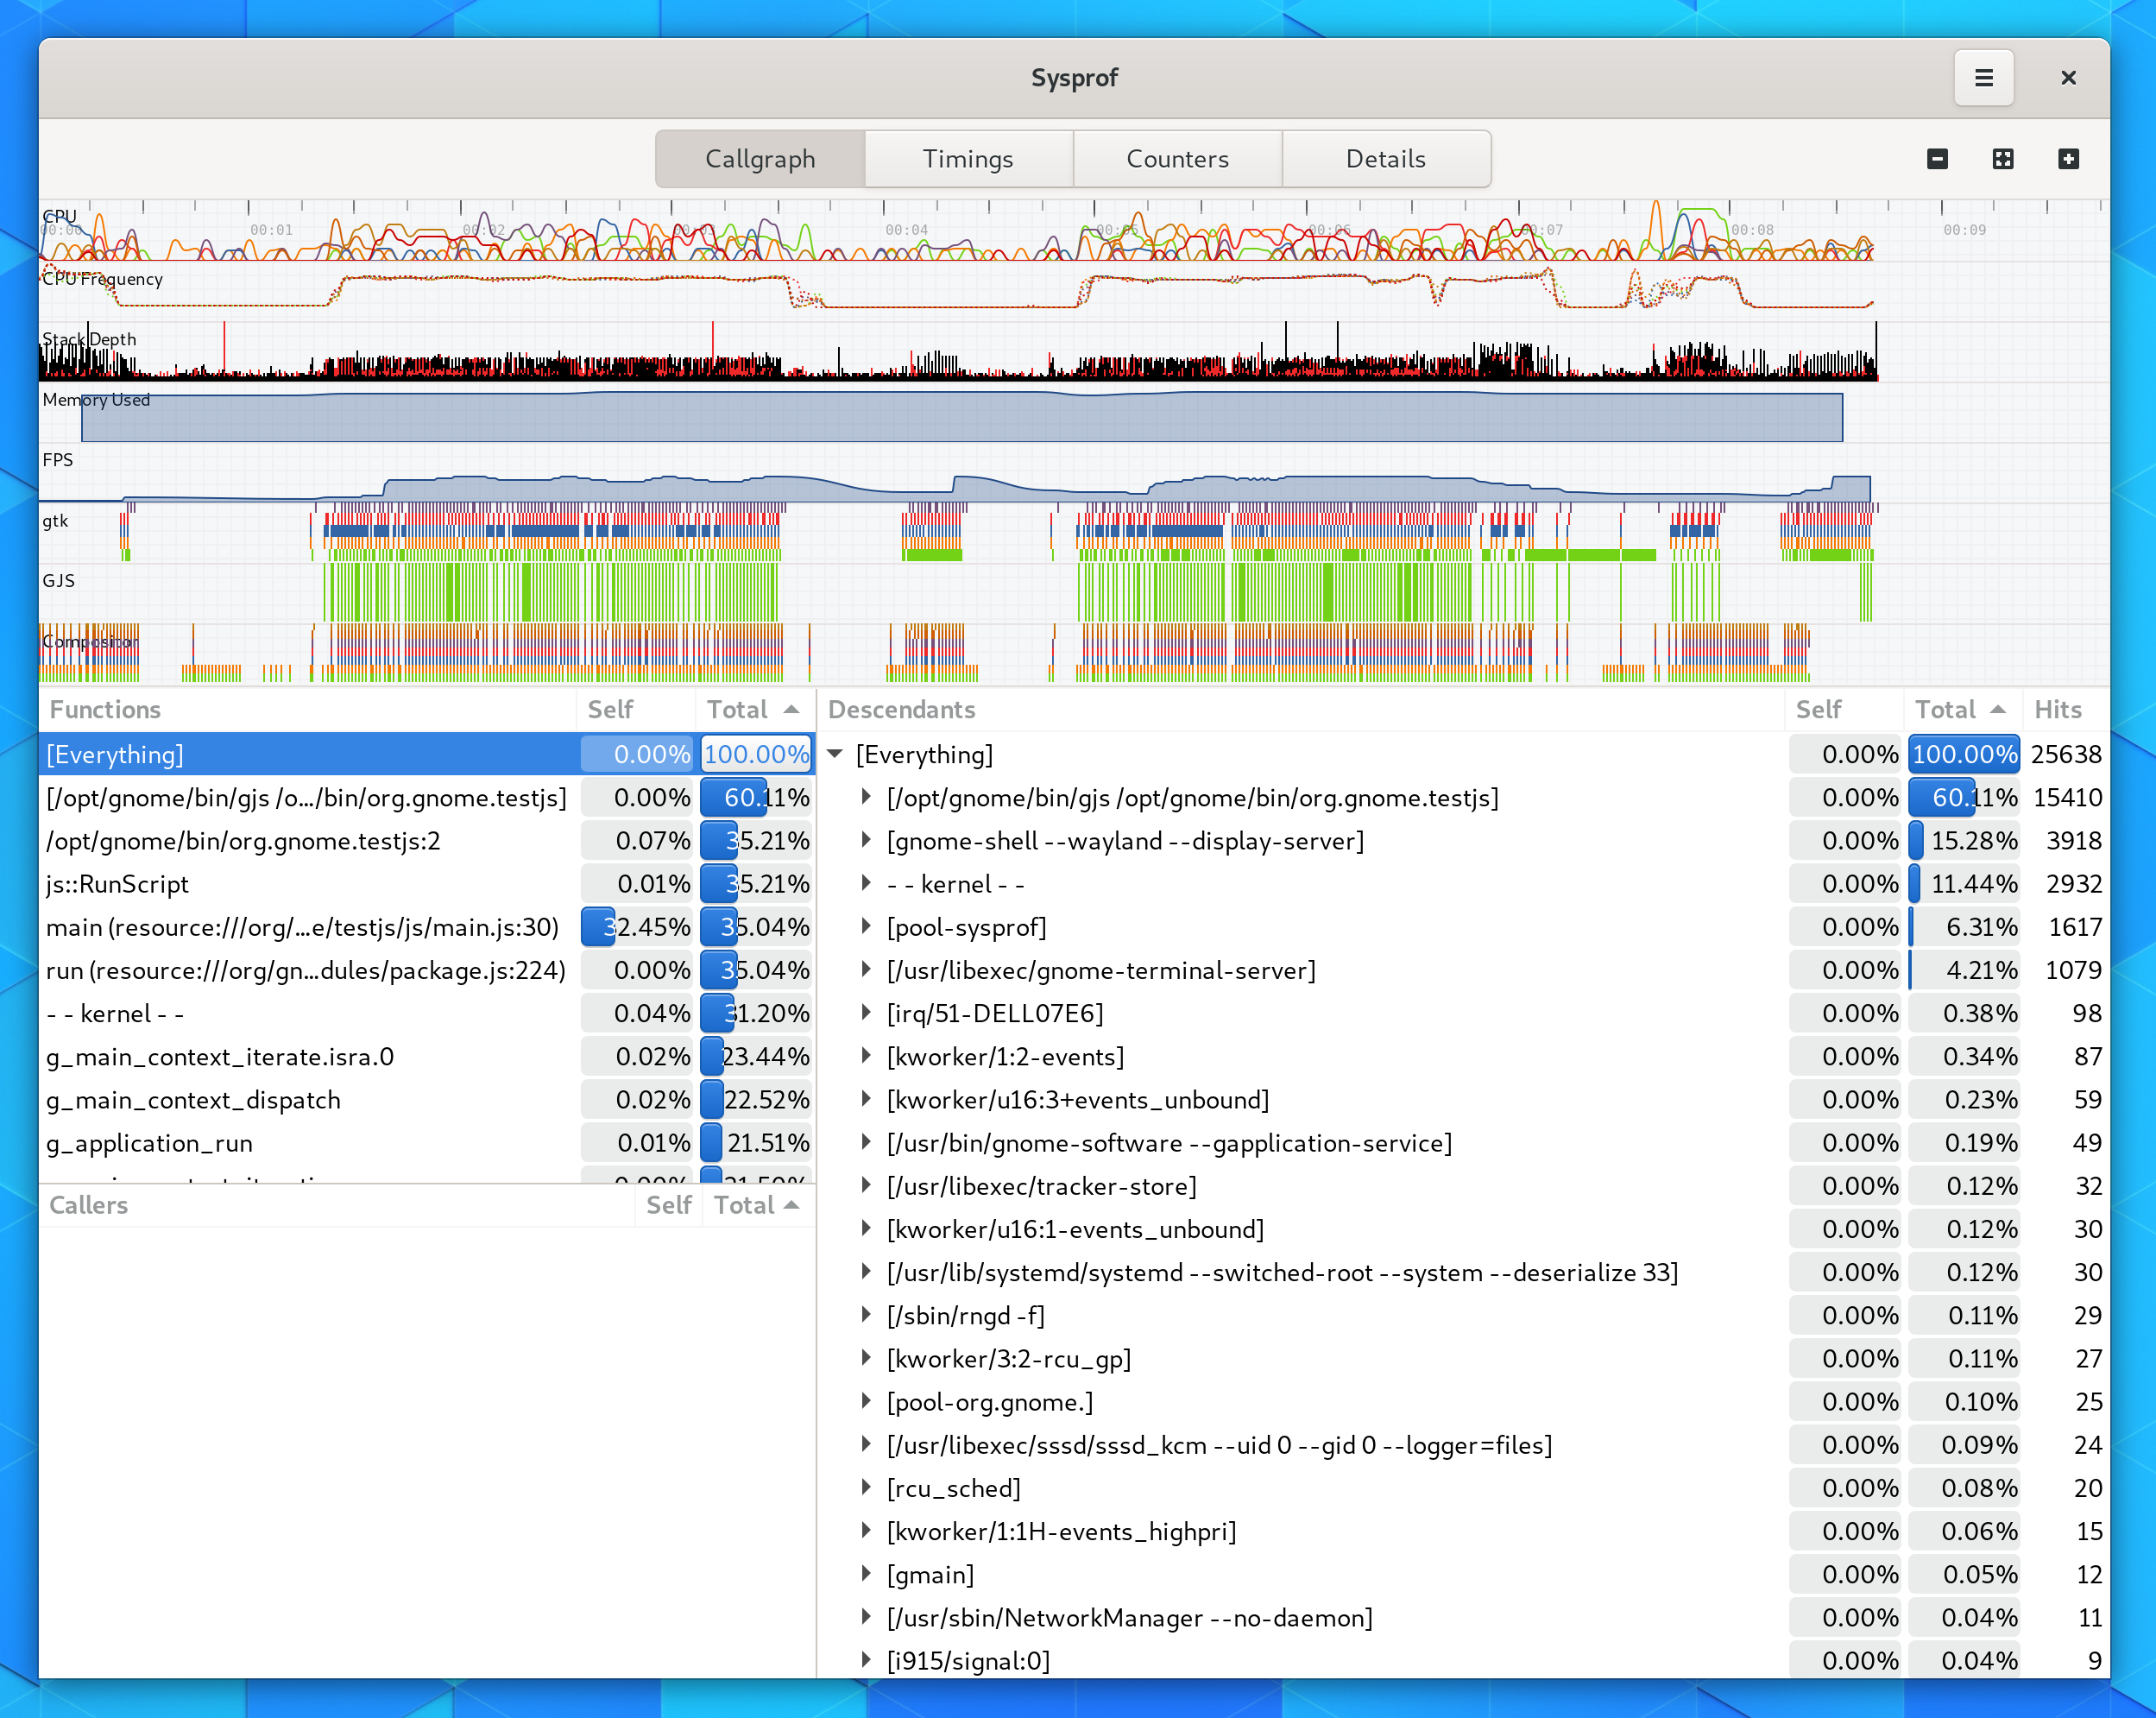
I back-ported the GTK 4 frame-profiler by Matthias to GTK 3 today. Here is an example of a JavaScript application using GJS and GTK 3. The data contains mixed native and JS stack-traces along with compositor frame information from gnome-shell.
What is going on here is that we have binary streams (although usually captured into a memfd) that come from various systems. GJS is delivered a FD via GJS_TRACE_FD environment variable. GTK is delivered a FD via GTK_TRACE_FD. We get data from GNOME Shell using the org.gnome.Sysprof3.Profiler D-Bus service exported on the org.gnome.Shell peer. Stack-traces come from GJS using SIGPROF and the SpiderMonkey profiler API. Native stack traces come from the Linux kernel’s perf_event_open system. Various data like CPU frequency and usage, memory and such come from /proc.
Muxing all the data streams uses sysprof_capture_writer_cat() which knows how to read data frames from supplemental captures and adjust counter IDs, JIT-mappings, and other file-specific data into a joined capture.
A quick reminder that we have a Platform Profiling Initiative in case you’re interested in helping out on this stuff.