Flamegraphs for Sysprof

A long requested feature for Sysprof (and most profiler tools in general) is support for visualizing data as FlameGraphs. They are essentially a different view on the same callgraph data we already generate. So yesterday afternoon I spent a bit of time prototyping them to sneak into GNOME 45.

Many tools out there use the venerable flamegraphs.pl but since we already have all the data conveniently in memory, we just draw it with GtkSnapshot. Colorization comes from the same stacktrace categorization I wrote about previously.

A screenshot of flamegraph visualization of a callgraph in Sysprof.

If you select a new time range using the scrubber at the top, the flamegraph will update to stacktraces limited to that selection.

Selecting frames within the flamegraph will dive into those leaving enough breadcrumbs to work your way back out.

Visualizing Scheduler Details

One thing we’ve wanted for a while in Sysprof is the ability to look at what the process scheduler is doing. It can be handy to see what processes where switched and how they may be dependent on one-another. Previously, I’d fire up kernelshark for that as it’s a pretty invaluable tool. But having scheduler data inline with everything else you capture is too useful to pass up.

So here we have the sched:sched_switch tracepoint integrated into Sysprof marks so you can correlate that with the rest of your recording.

Scheduled processes displayed in a time series, segmented by CPU.

Profiling with medium-aged hardware

I like to keep myself honest by using slower computers regularly to do my job. When things become obnoxious, it reminds me to take a closer look at what’s going on.

Today, I did some more profiling of 45.beta with a not-too-old-but-still-a-bit-old laptop. It’s the first laptop I received at Red Hat in 2015. X1 Carbon gen3 (5th gen i7), with 8gb RAM. Not amazing by today’s standards, but still pretty good! Surely things will be fine.

Okay, so first up, after boot, I ssh in from my workstation so I can run sysprof-cli --session-bus --system-bus capture.syscap. Immediately afterwards, I type my login password and hit Enter.

Things are hanging for quite some time, what does Sysprof say?

A screenshot of Sysprof showing most of the time spent in decoding a JXL image.

Looks like we are spending most of our time decoding JXL images. Given that it took about 17 seconds to login, something is clearly going wrong here.

gdk-pixbuf-thumbnailer -s 256 adwaita-l.jxl test.png only takes about 3 seconds. So clearly there is more.

But first, we file an issue because we want to be logged in in about 500 milliseconds, not 15 seconds.

Up next we seem to be spending a lot of time in subdivide_infos() in … GTK CSS parsing. But more specifically, GTK 3 CSS parsing. Hrmm strange, what is GTK 3 that is loading at login? Apparently it’s all the gsd-* tools. And they’re GTK 3 still presumably from libcanberra-gtk or some other requirement. Cool.

Now here is the kicker, I remember putting in code years ago to avoid CSS parsing in these to specifically avoid this issue by creating a fake (and empty) GTK theme. I wonder why it’s not working. Maybe the transition from autotools to meson broke it.

After a bit of re-familiarizing myself with the code it looks like GTK will fallback to internal theme parsing if it can’t find the specified them from $GTK_THEME. Next we pop open gresources list gsd-media-keys to check that the theme resources are there, and indeed they are not. Quick patch to ensure linkage across static libraries and we’re off to the races. A bunch of time wasted in login shaved off and a couple dozen MB of memory reclaimed.

More Sysprof’ing

GWeather

Last time I wrote we talked about a new search index for libgweather. In the end I decided to take another route so that we can improve application performance without any changes. Instead, I added a kdtree to do nearest neighbor search when deserializing GWeatherLocation. That code path was looking for the nearest city from a latitude/longitude in degrees.

The merge request indexes some 10,000 lat/lon points in radians at startup into a kd-tree. When deserializing it can find nearest city without the need for a linear scan. Maybe this is enough to allow significantly more data into the database someday so my small hometown can be represented.

Nautilus

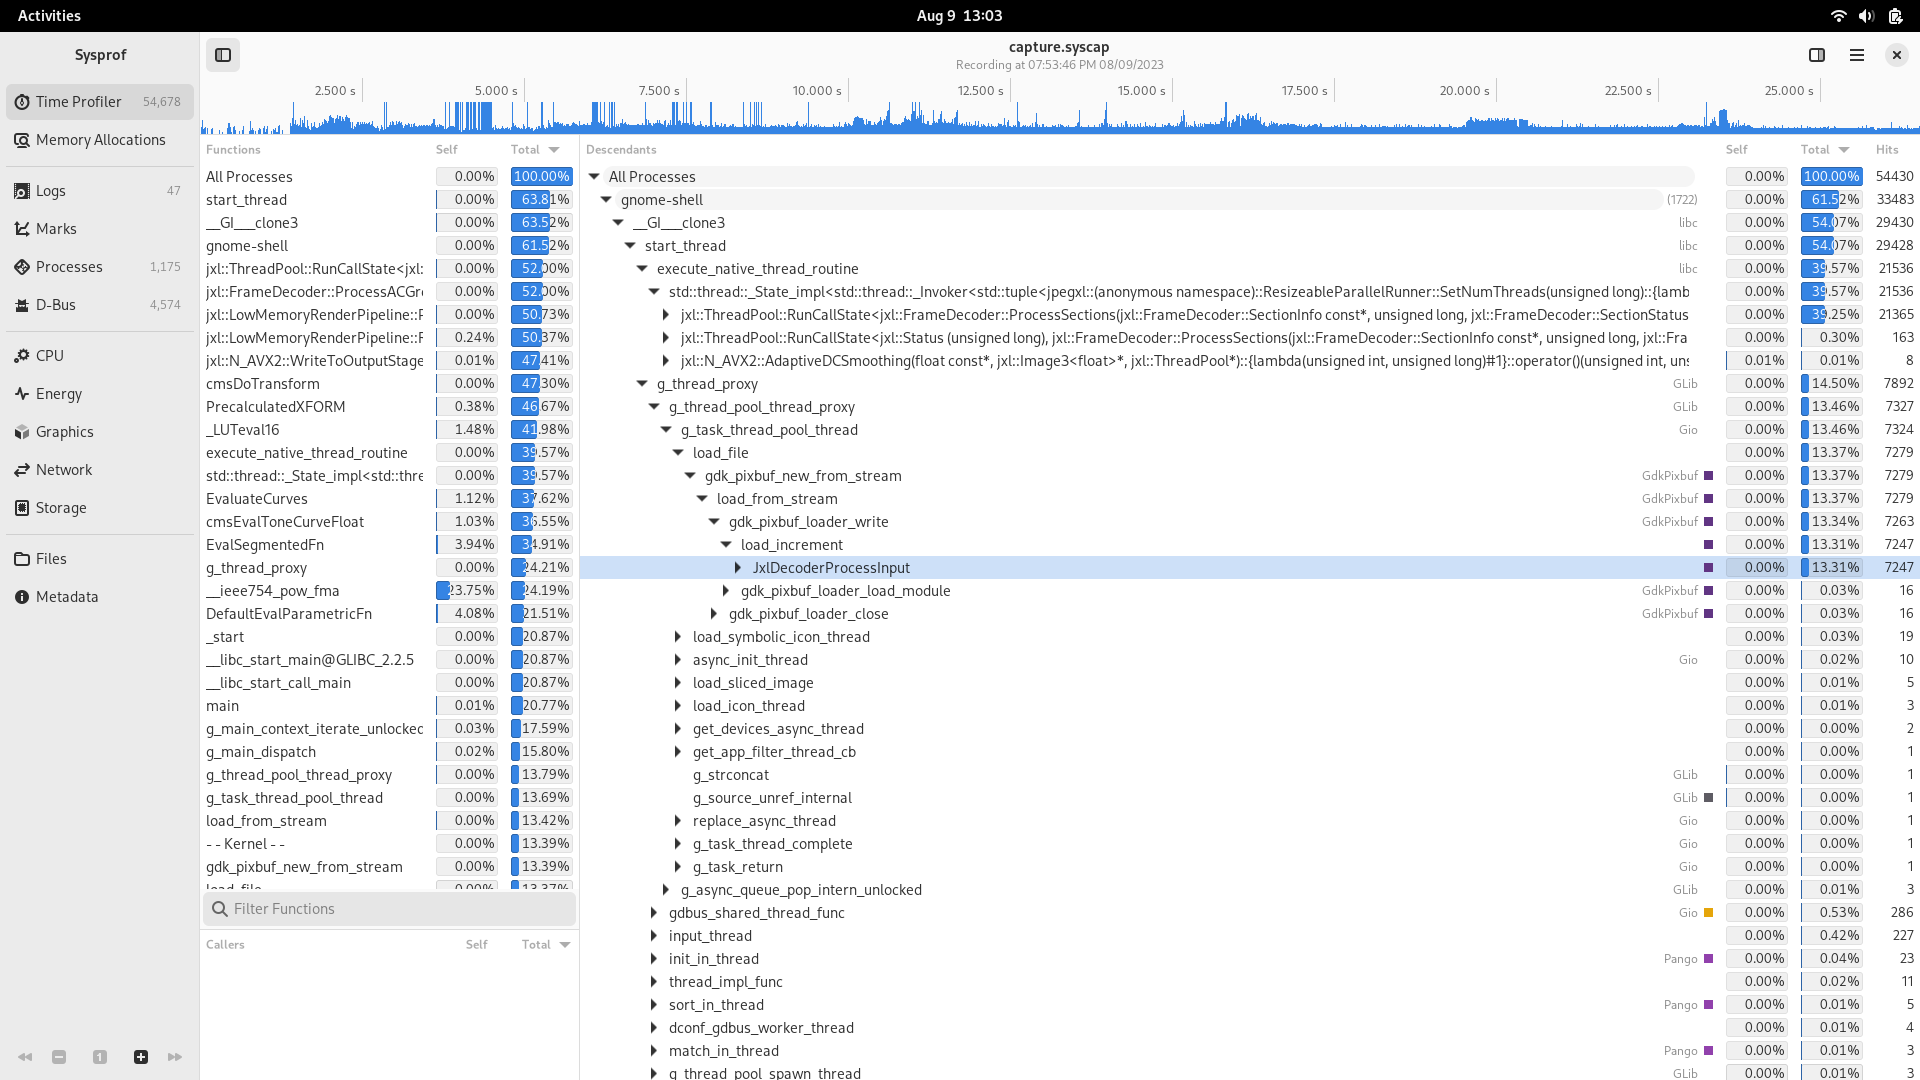
I found a peculiarity in that I was seeing a lot of gtk_init() calls while profiling search. That means processes are being spawned. Since I have D-Bus session capture in Sysprof now, I was able to find this being caused by Nautilus sending an org.freedesktop.DBus.Peer.Ping() RPC to kgx and gnome-disks.

Seems like a reasonable way to find out if a program exists, but it does result in those applications being spawned. gtk_init() can take about 2% CPU alone and combined this is now 4-5% that is unnecessary. Nautilus itself needing to initialize GTK on startup plus these two as a casualty puts us combined over 6%.

D-Bus has an org.freedesktop.DBus.ListActivatableNames() RPC which will tell you what names are activatable. Same outcome, less work.

Corey, like a great maintainer, has already jumped into action.

Photos

I was hesitant to look at gnome-photos because I think it’s falling out of core this next cycle. But since it’s on my system now, I want to take a look.

First off, I was seeing about 10 instances of gnome-photos in a single Sysprof capture. That means that the process was spawned 10 times in response to search queries. In other words, it either must have crashed or exited after each search request I typed into GNOME Shell. Thankfully, it was the later. But since we know gtk_init() alone is about 2%, and combined this looks like it’s in the 30-40% range there must be more to it.

So, easy fix. Call g_application_set_inactivity_timeout() with something reasonable. The search provider was already doing the right thing in calling g_application_hold() and g_application_release() to extend the process lifetime. But without inactivity-timeout set, it doesn’t help much.

After that, we’re down to just one instance. Cool.

Next capture we see we’re still at a few percent, which means something beyond just gtk_init() is getting called. Looks like it’s spending a bunch of time in gegl_init(). Surely we don’t need GEGL to provide search results (which come from tracker anyway), so make a quick patch to defer that until the first window is created. That generally won’t happen when just doing Shell queries, so it disappears from profiles now.

Calculator

Rarely do I have gnome-calculator actually running when performing a Shell search despite using it a lot. That means it too needs to be spawned to perform the search.

It’s already doing the right thing in having a dedicated gnome-calculator-search-provider binary that is separate from the application (so you can reduce start-up time and memory usage) so why is it showing up on profiles? Looks like it’s initializing GTK even though that isn’t used at all in providing search results. Probably a vestige of yesteryear.

Easy fix by just removing gtk_init(). Save time connecting to the display server, setting up seats, icon themes, and most importantly, parsing unused CSS.

Another couple percent saved.

Measure, Measure, Measure

Anyway, in conclusion, I might leave you with this tidbit. Nobody gets code right on the first try, especially me. If you don’t take a look and observe it, my guess is that it looks a lot different at run-time than it does in your head.

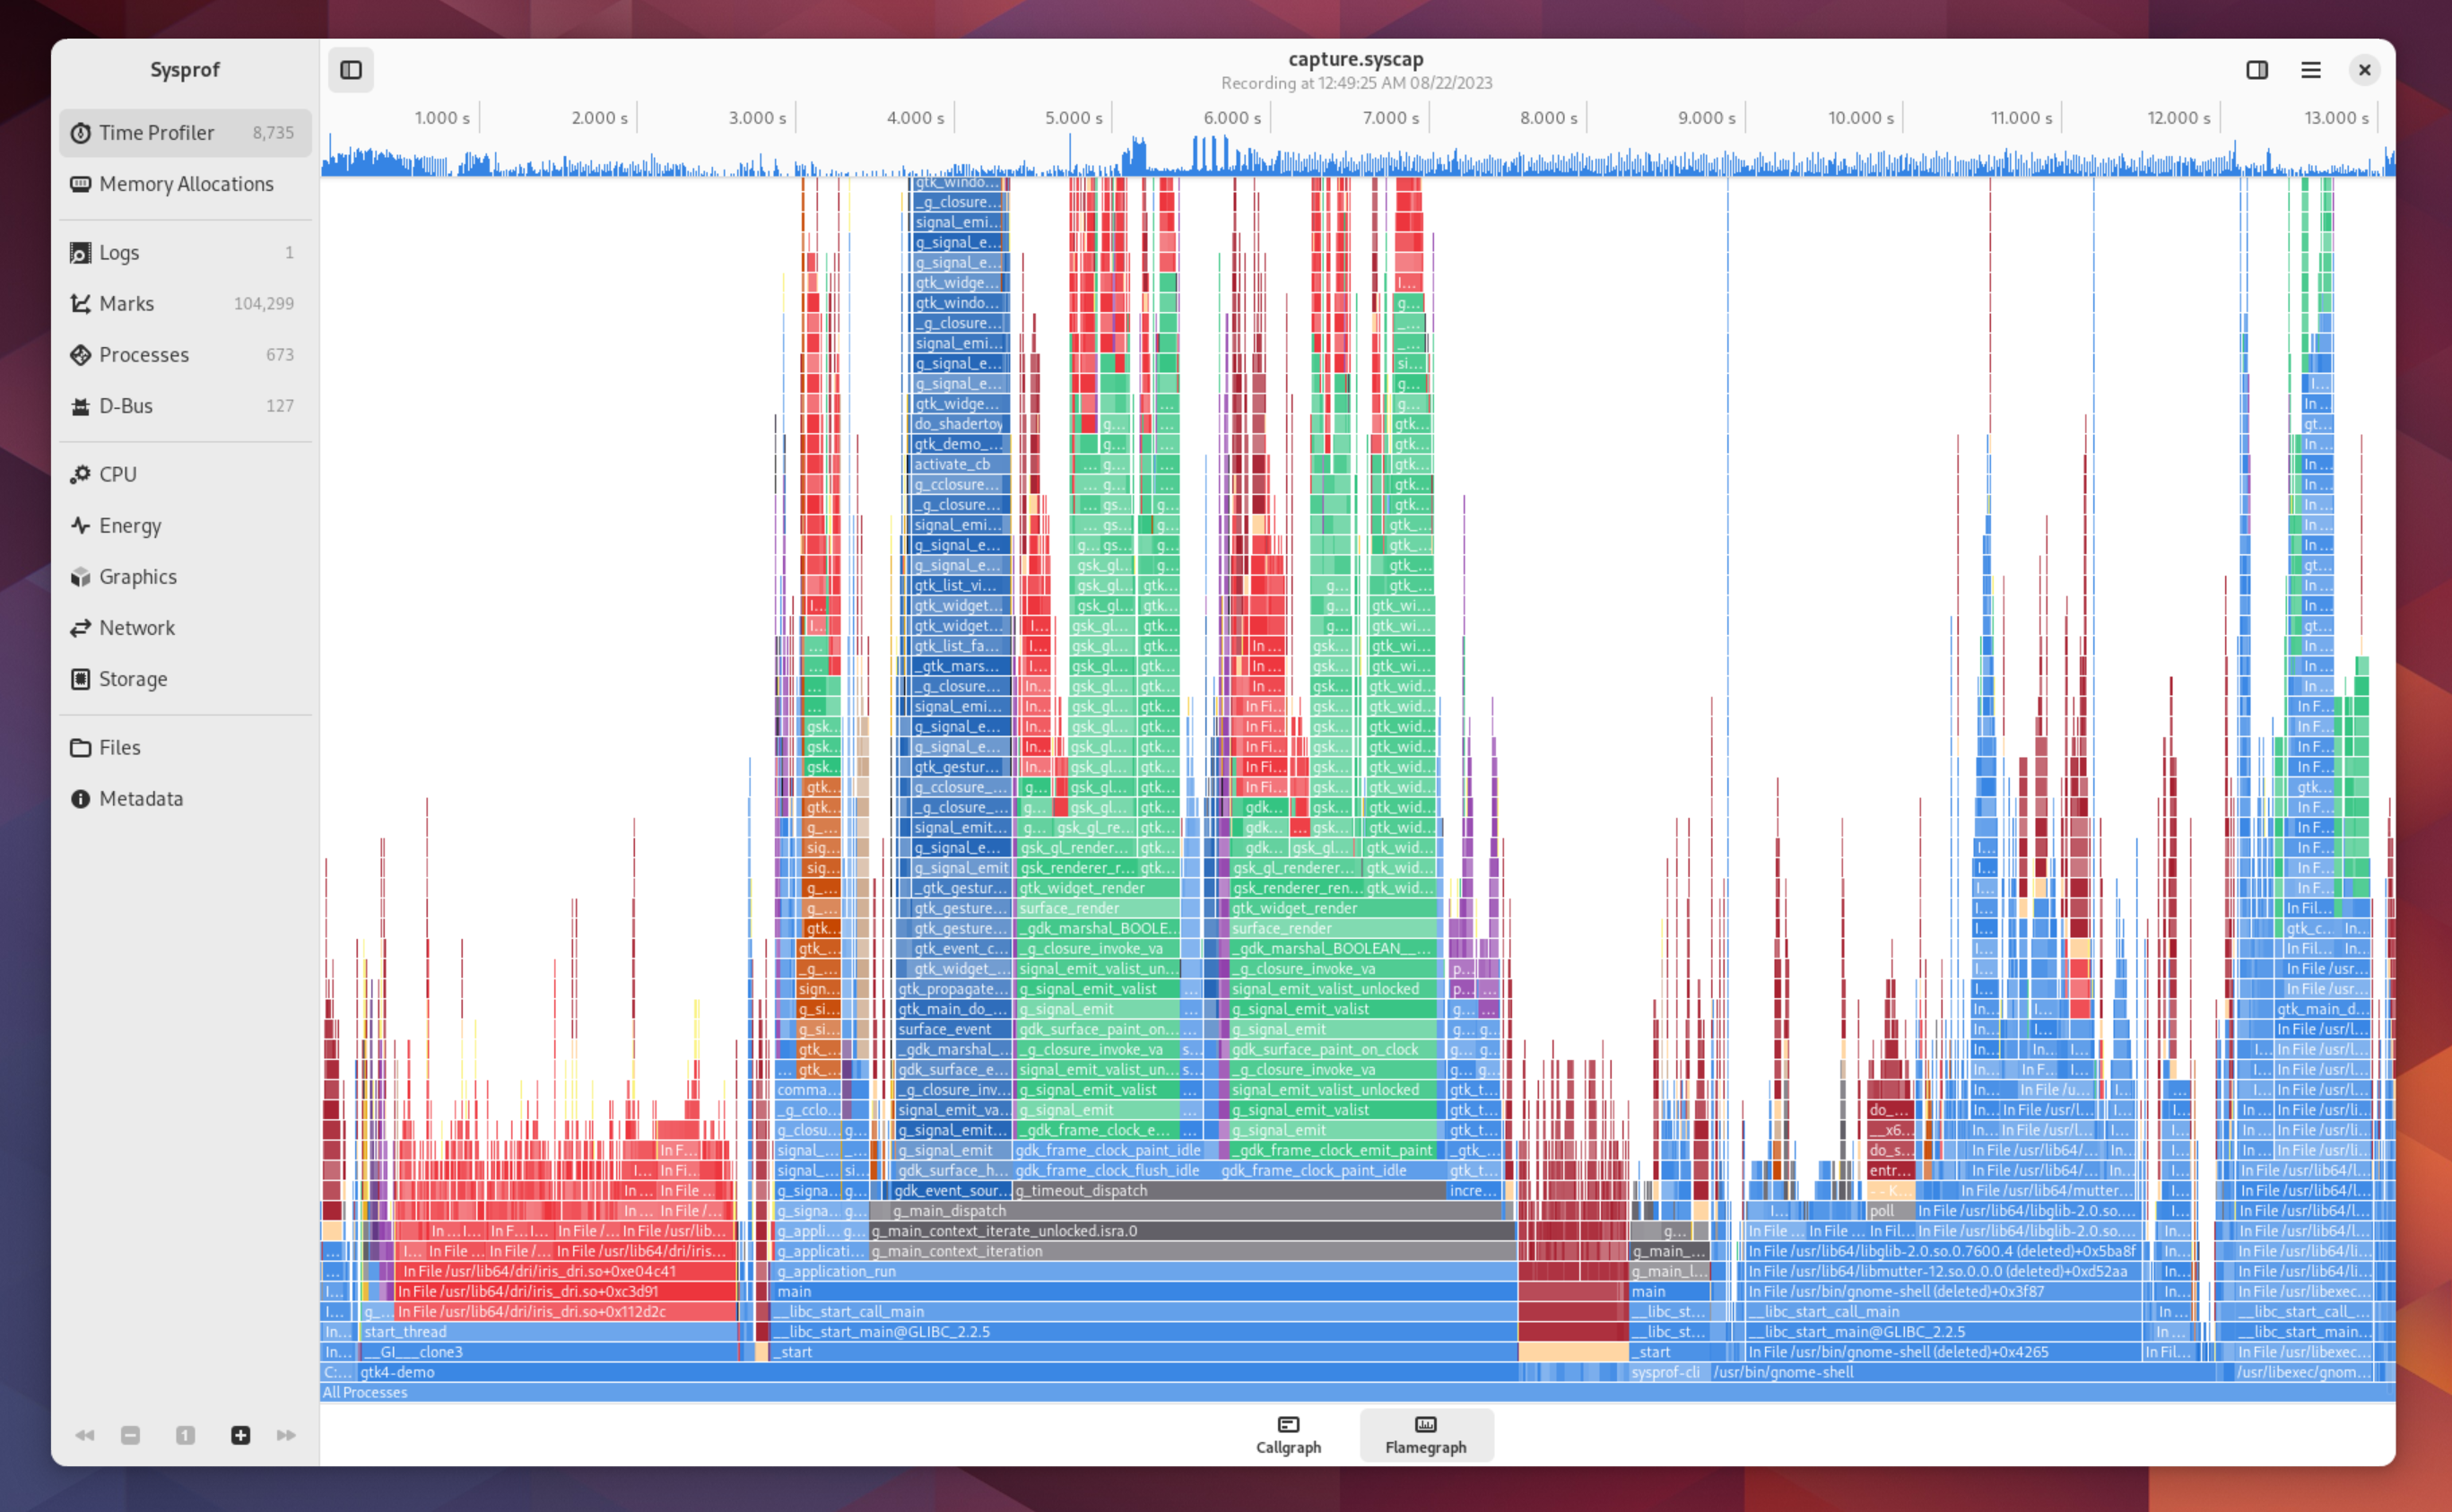
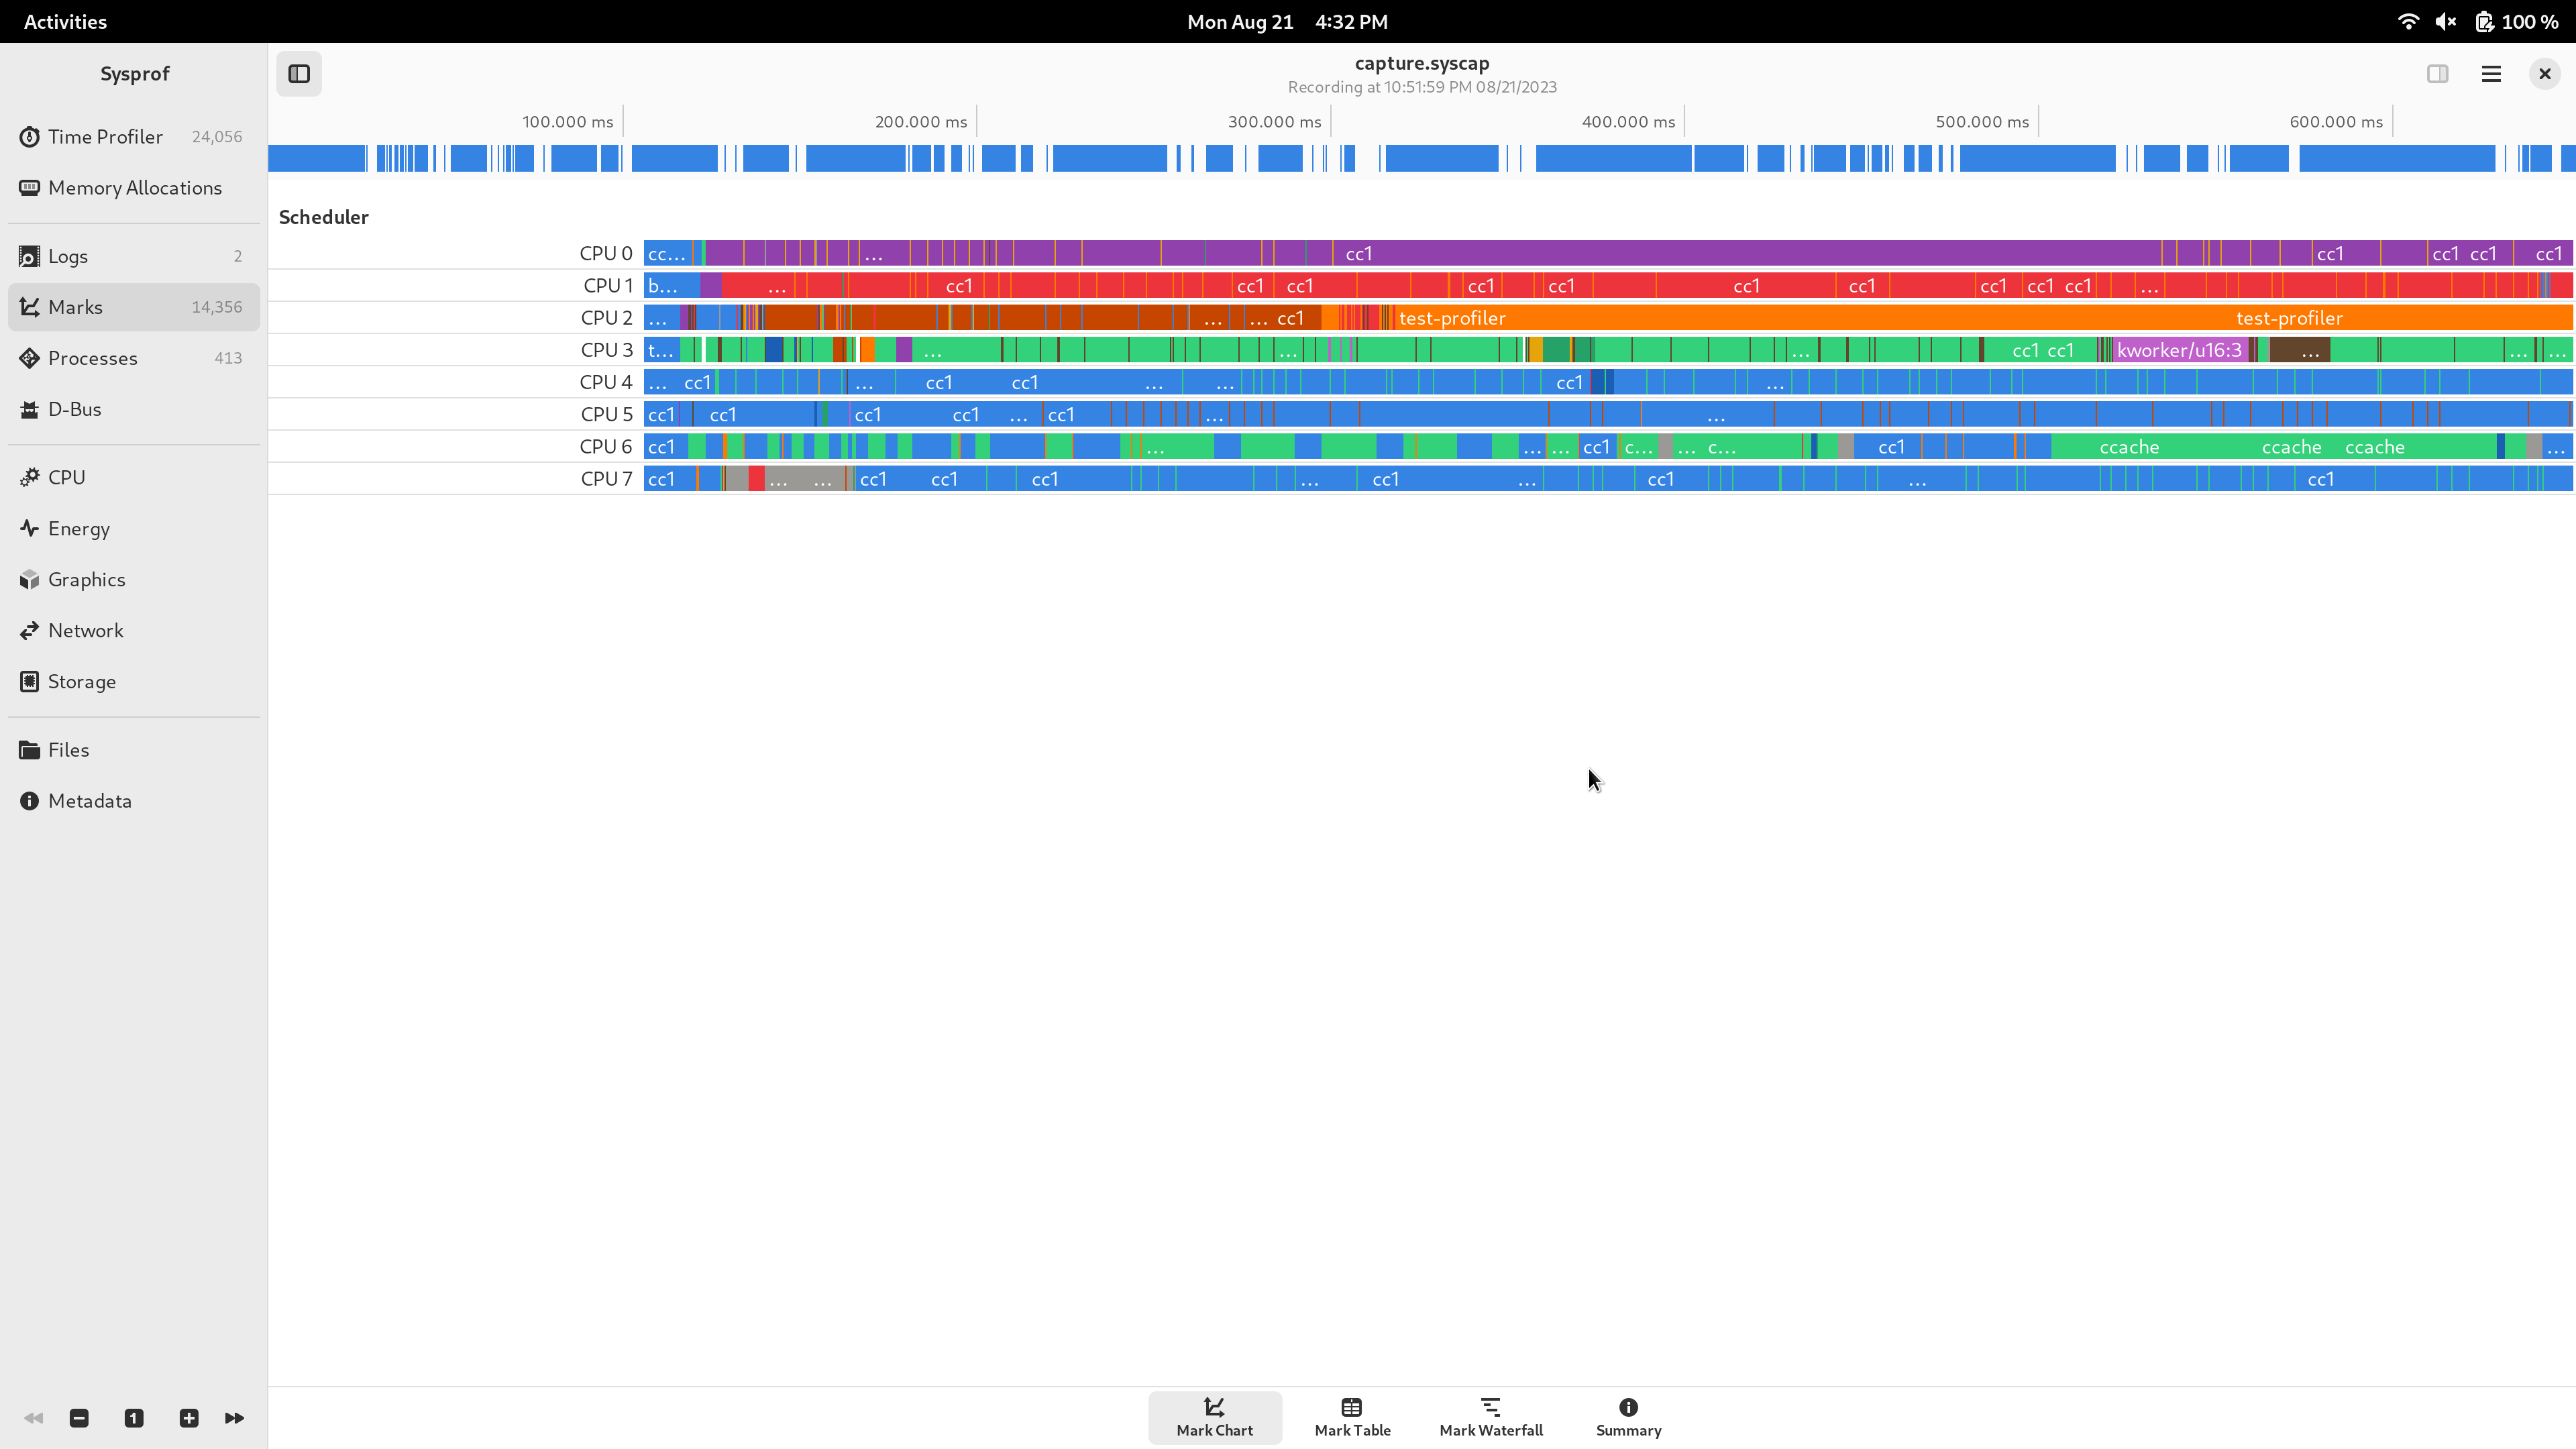
Sysprof is my attempt to make that a painless process.

Writing Fast Search

The problem we encountered in my last writing was that gnome-clocks was taking about 300 milliseconds to complete a basic search query. I guess the idea is that if you type “paris” into GNOME Shell you’ll get the time in either Paris, France or one of the Paris’ in the United States. I guess 300 milliseconds wouldn’t be so bad if it didn’t also consume 100% of the CPU during that time.

Thankfully in my career I’ve had plenty of opportunity to work with database search indexes. So I have some practical experience in making that stuff fast(er).

So this morning I put together a small search index which can be generated from the Locations.bin using the libgweather API. That search index contains the serialized document form and a series of trigrams for the GWeatherLocation textual representation. That search index is meant to be static and installed along side Locations.bin.

Then for search, you take your term list and generate another series of trigrams. The SearchIndex provides iterators for each of those trigrams to find documents which contain it. So if you line those up with a sorted document list you can create an O(n*m) worst case iterator across potentially matching documents. In practice you look at a very small subset of the corpus.

As you iterate through those, you do your full termlist matching as you would have previously. Except instead of looking at thousands of entries, you look at just a few.

Long story short, you can go from 100% CPU for 300 milliseconds repeatedly to about 10 milliseconds and it keeps getting faster the more you type.

Once again, without tools like Sysprof and distributions with courage to enable frame-pointers like GNOME OS and Fedora, finding this stuff can be quite nebulous.