A long requested feature for Sysprof (and most profiler tools in general) is support for visualizing data as FlameGraphs. They are essentially a different view on the same callgraph data we already generate. So yesterday afternoon I spent a bit of time prototyping them to sneak into GNOME 45.
Many tools out there use the venerable flamegraphs.pl but since we already have all the data conveniently in memory, we just draw it with GtkSnapshot. Colorization comes from the same stacktrace categorization I wrote about previously.
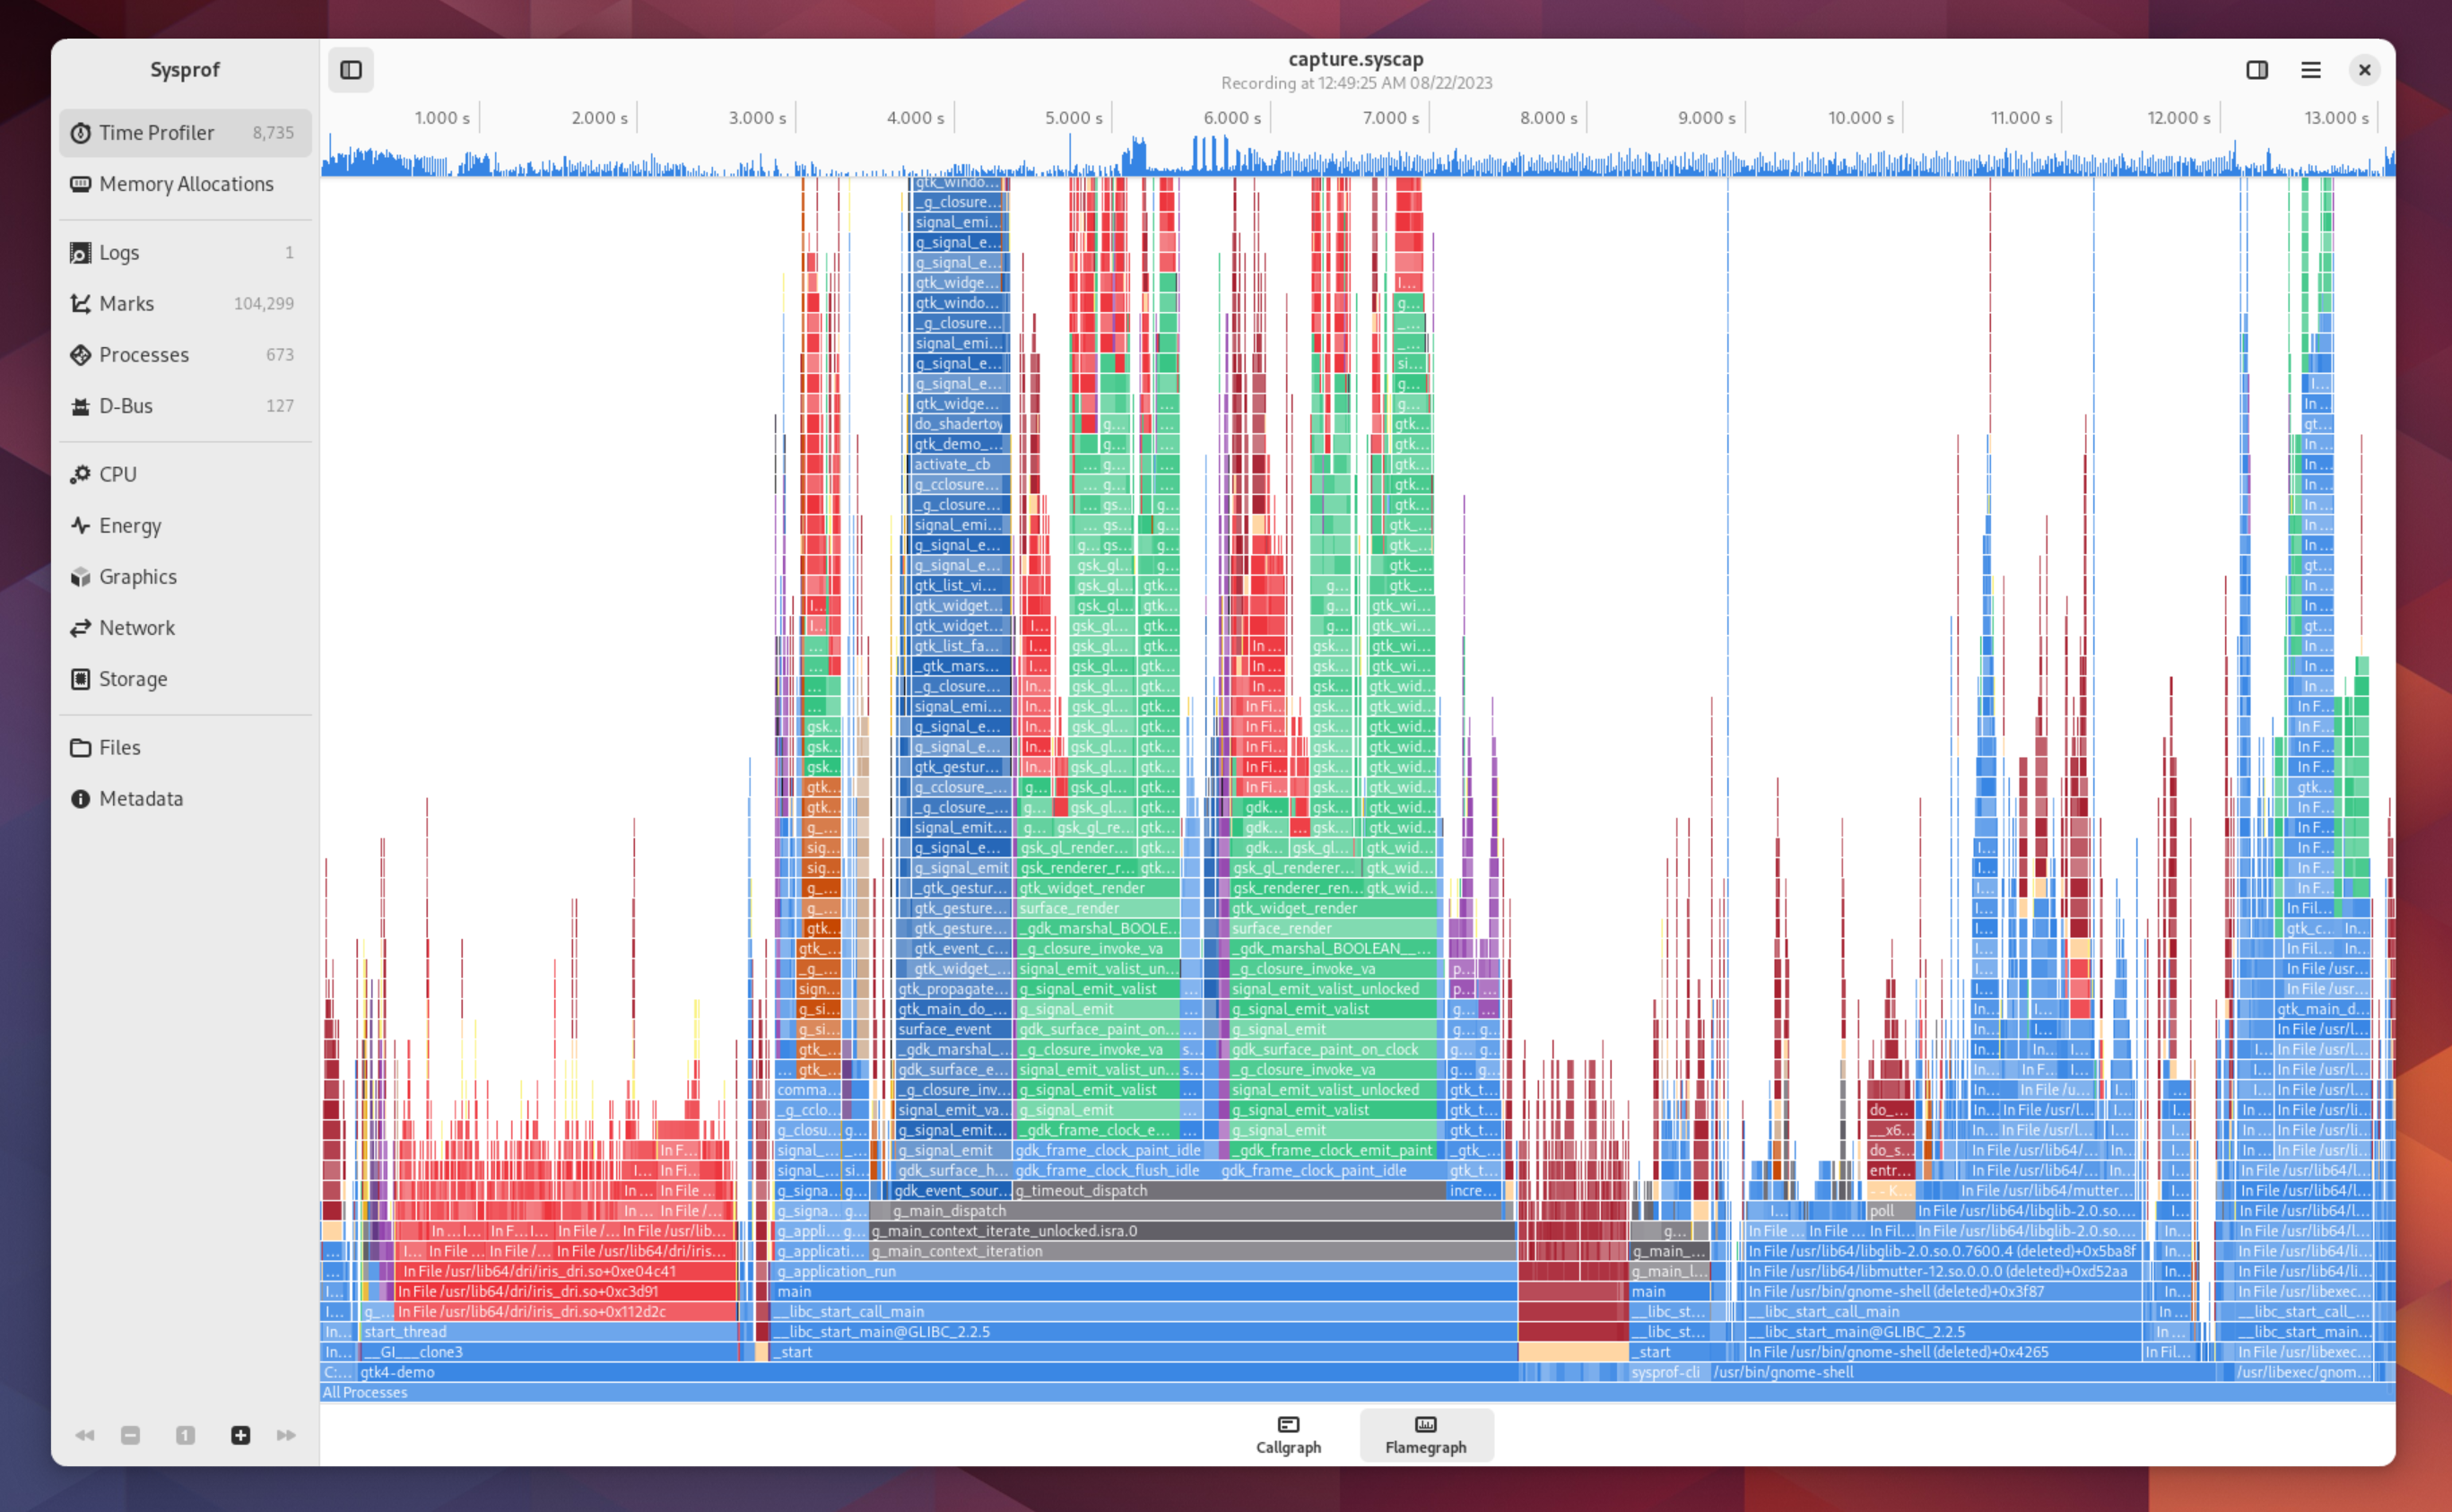
If you select a new time range using the scrubber at the top, the flamegraph will update to stacktraces limited to that selection.
Selecting frames within the flamegraph will dive into those leaving enough breadcrumbs to work your way back out.