One thing we’ve wanted for a while in Sysprof is the ability to look at what the process scheduler is doing. It can be handy to see what processes where switched and how they may be dependent on one-another. Previously, I’d fire up kernelshark for that as it’s a pretty invaluable tool. But having scheduler data inline with everything else you capture is too useful to pass up.
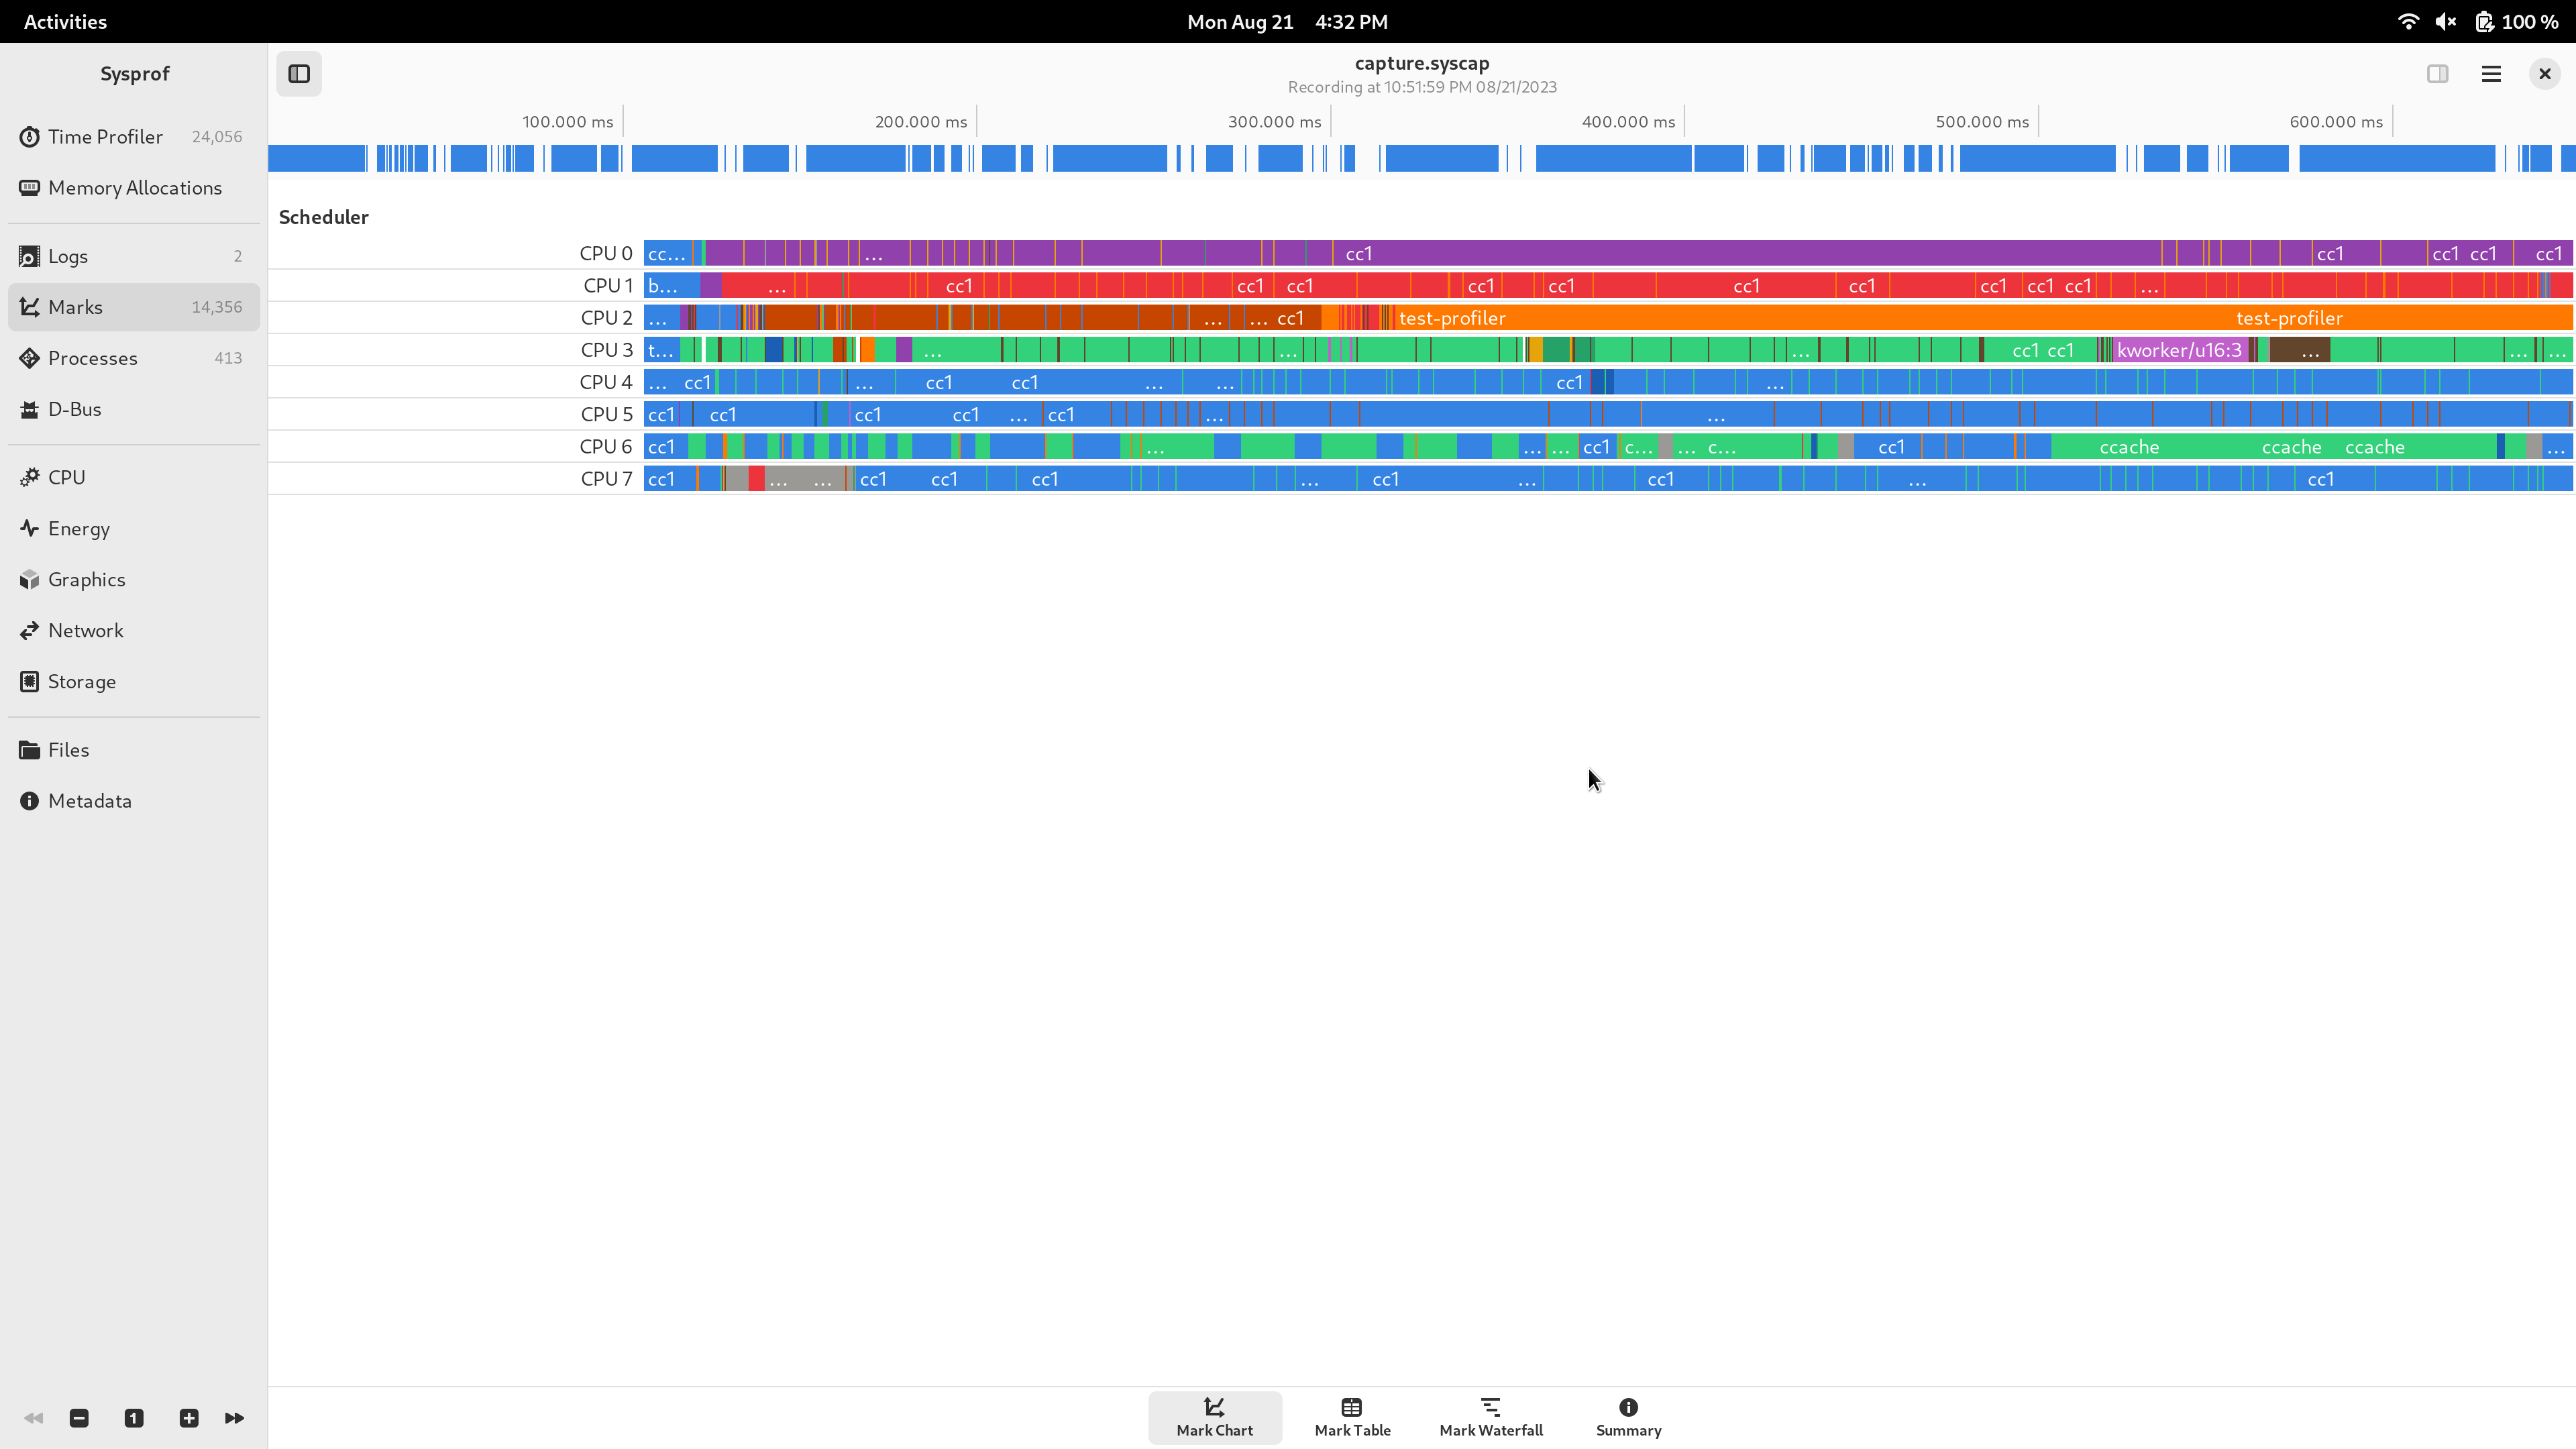
So here we have the sched:sched_switch tracepoint integrated into Sysprof marks so you can correlate that with the rest of your recording.