It can be very handy to store things you might do as meta programming in your GObjectClass‘s private data (See G_TYPE_CLASS_GET_PRIVATE()).
Doing so is perfectly fine, but you need to be aware of how GTypeInstance initialization works. Each of your parent classes instance init functions are called before your subclasses instance init (and in order of the type hierarchy). What might seem non-obvious though is that the GTypeInstance.g_class pointer is updated as each successive _init() function is called.
That means if you have my_widget_init() and your parent class is GtkWidget, the gtk_widget_init() does not know it’s instantiating a subclass. Further more, GTK_WIDGET_GET_CLASS() called from gtk_widget_init() will get you the base classes GtkWidgetClass, not the subclasses GtkWidgetClass.
There are ways around this if you don’t use G_DEFINE_TYPE(), but honestly, who wants to do that.
One technique around this, which I used in Bonsai’s DAO, is to use a single-linked list where the head is in each subclass, but the tail exists in each of the parent classes. That way you share all the parent structures, but the subclasses can access all of theirs. You’ll still want to defer most setup work until constructed() though so you can get the full class information of the subclass and hierarchy.
In the previous article of this series we covered Sysprof basics to help you use the tooling. Now I want to take a moment to show you how to use the command line tooling to profile systems like GNOME Shell.
Record an existing session
The easiest way to get started is to record your existing GNOME Shell session. With sysprof-cli, you can use the --gnome-shell option and it will attempt to connect to your active GNOME Shell instance over D-Bus to stream COGL pipeline information over a private file-descriptor.
This information can be combined with callgraphs to see what is happening during the duration of a COGL mark.
The details page can also provide some quick overview information about the marks and their duration. You will find this helpful when comparing patches to see if they really improved things over time.
The details button in the top right will show you information about marks and their min/max/avg duration.
Basic Shell Recording
Running something like a desktop session is complex. You have a D-Bus daemon, a compositor, series of background daemons, settings infrastructure, and programs saving to your home directory. For this reason you cannot really run two of them for the same user at the same time, or even nested.
Because of this, it is handy to log out of your desktop session and switch to a VT to profile GNOME Shell. Sysprof provides a sysprof-cli binary you can use to profile in complicated setups like this.
Start by switching to another VT like Control+Shift+3. I recommend stopping the current display server just so that it doesn’t get in the way of profiling, but usually it’s okay to not. Then we can enter our JHBuild environment with a new D-Bus session before we start Sysprof and GNOME Shell.
At this point, we can spawn GNOME Shell with Sysprof to start recording.
You can use -- to specify the command you want sysprof-cli to execute while it records. When that application exits, sysprof-cli will extract all the known symbols and finish it’s recording.
I want to mention briefly that the --gnome-shell option only works with an existing GNOME session. I hope to fix that in the near future though.
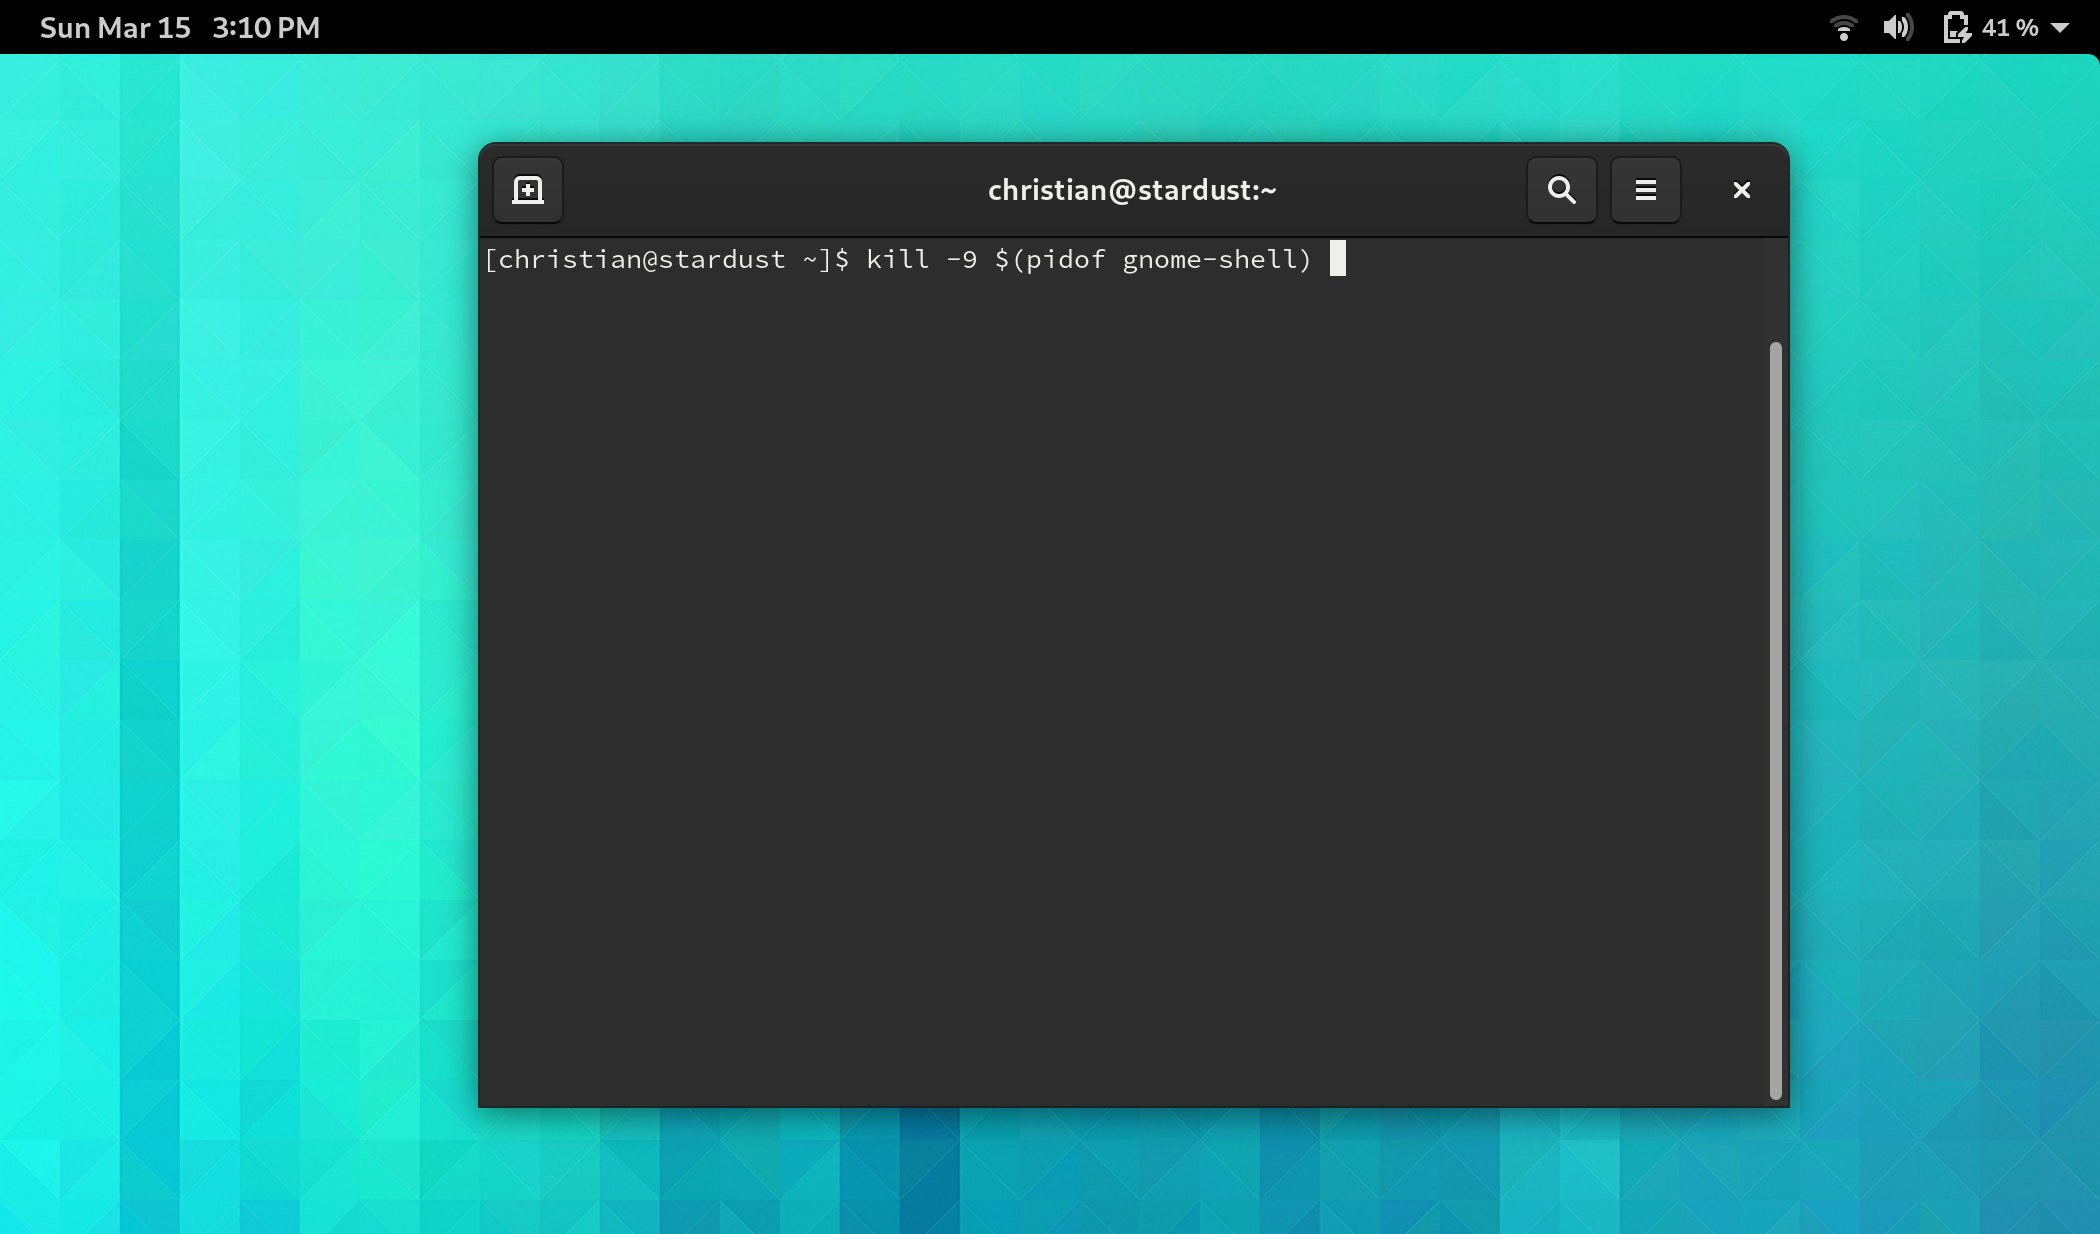
At this point, GNOME Shell will have spawned and you can exercise it to exhibit the behavior you’d like to improve. When done, open a terminal window to kill GNOME shell so that the profiler can clean up.
kill -9 $(pidof gnome-shell) seems to work well for me
Now you’ll have a capture.syscap file in your current directory. Open that up with Sysprof to view the contents of your profiling session. Often I just spawn gnome-shell directly to open the syscap file and explore.
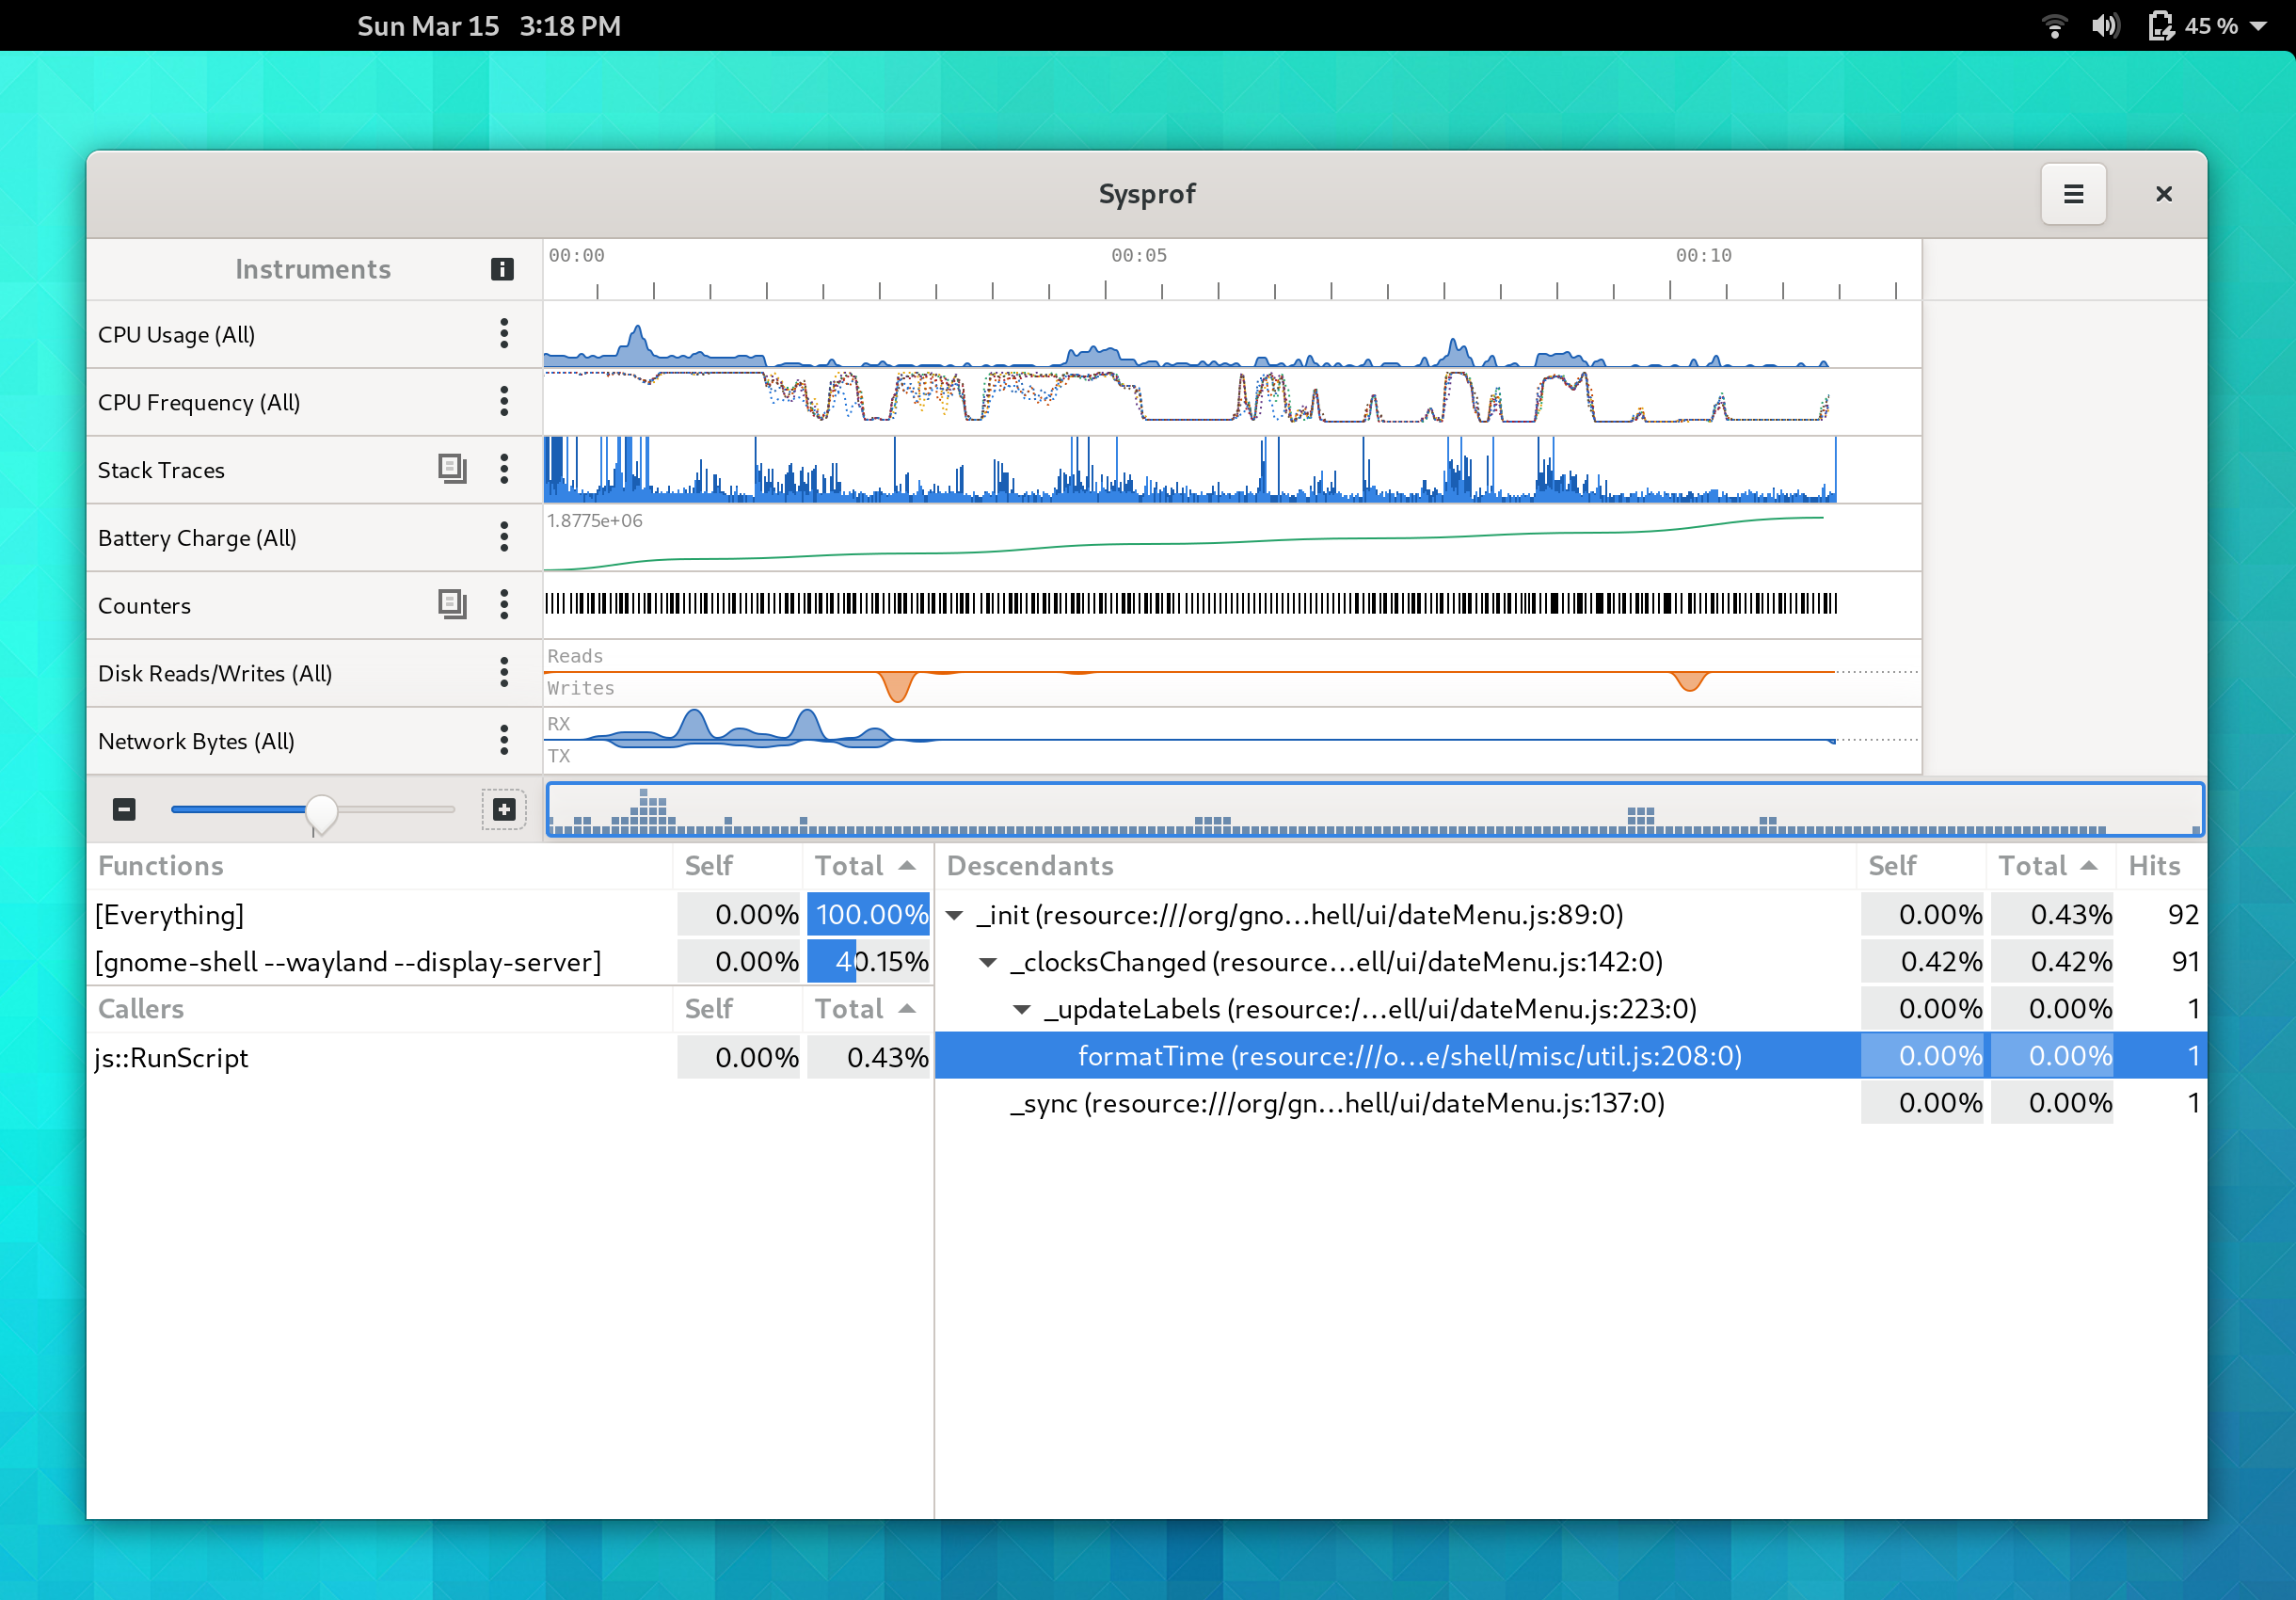
Recording JavaScript stacks
Sometimes you want to profile JavaScript instead of the C code from Shell, Mutter, and friends. To do this, use the --gjs command line option. Currently, this can give mixed results if you also sample callstacks with the Linux perf support, as the timings are not guaranteed to be equivalent. My recommendation is to disable perf when sampling JavaScript using the --no-perf option.
Now when you open the callgraph in Sysprof, you’ll see JavaScript samples.
JavaScrpt callgraph example
Recording Energy Consumption
On Linux, we have support for tracking energy usage as “Rolling Average Power Limit” or RAPL for short. Sysprof can include this information for you in your capture if you have the turbostat utility available. It provides power information per “package” such as the GPU and CPU.
Keeping power consumption low is an important part of a modern desktop that aims to be useful on laptops and smaller form factors. It’s useful to check in now and again to ensure that we’re keeping things tip top.
You might want to disable sampling while testing power consumption because that could have a larger effect in terms of wattage than the thing you’re profiling.
Don’t forget to check the counter and energy menus for additional graphs.
Reducing Memory Allocations
Plugging memory leaks is a great thing to do. But sometimes it’s better to never allocate things to begin with. The --memprof option can help you find extraneous allocations in your program. For example, I tested the --memprof option on GNOME Shell when writing it and immediately found a way to reduce temporary allocations by hundreds of MiB per minute of use.
This one requires you to build Sysprof until our next release, but you can use the --speedtrack option to find things running on your main loop that may not be a good idea. It will also insert marks for how long the main loop iterations run to find periods of time that you aren’t staying interactive.
First off, before using Sysprof to improve the performance of a particular piece of software, make sure you’re compiling with flags that allow us to have enough information to unwind stack frames. Sysprof will use libunwind in some cases, but a majority of our stack unwinding is done by the Linux kernel which can currently only follow eh_frame (exception handling) information.
I generally disable the G_SLICE allocator because it isn’t really all that helpful on modern Linux systems using glibc and can also make it more difficult to track down leaks. Furthermore, it can get in the way of releasing memory back to the system in the form of malloc_trim() should we start doing that in the future. (Hint, I’d like to).
Finding code run often on the system
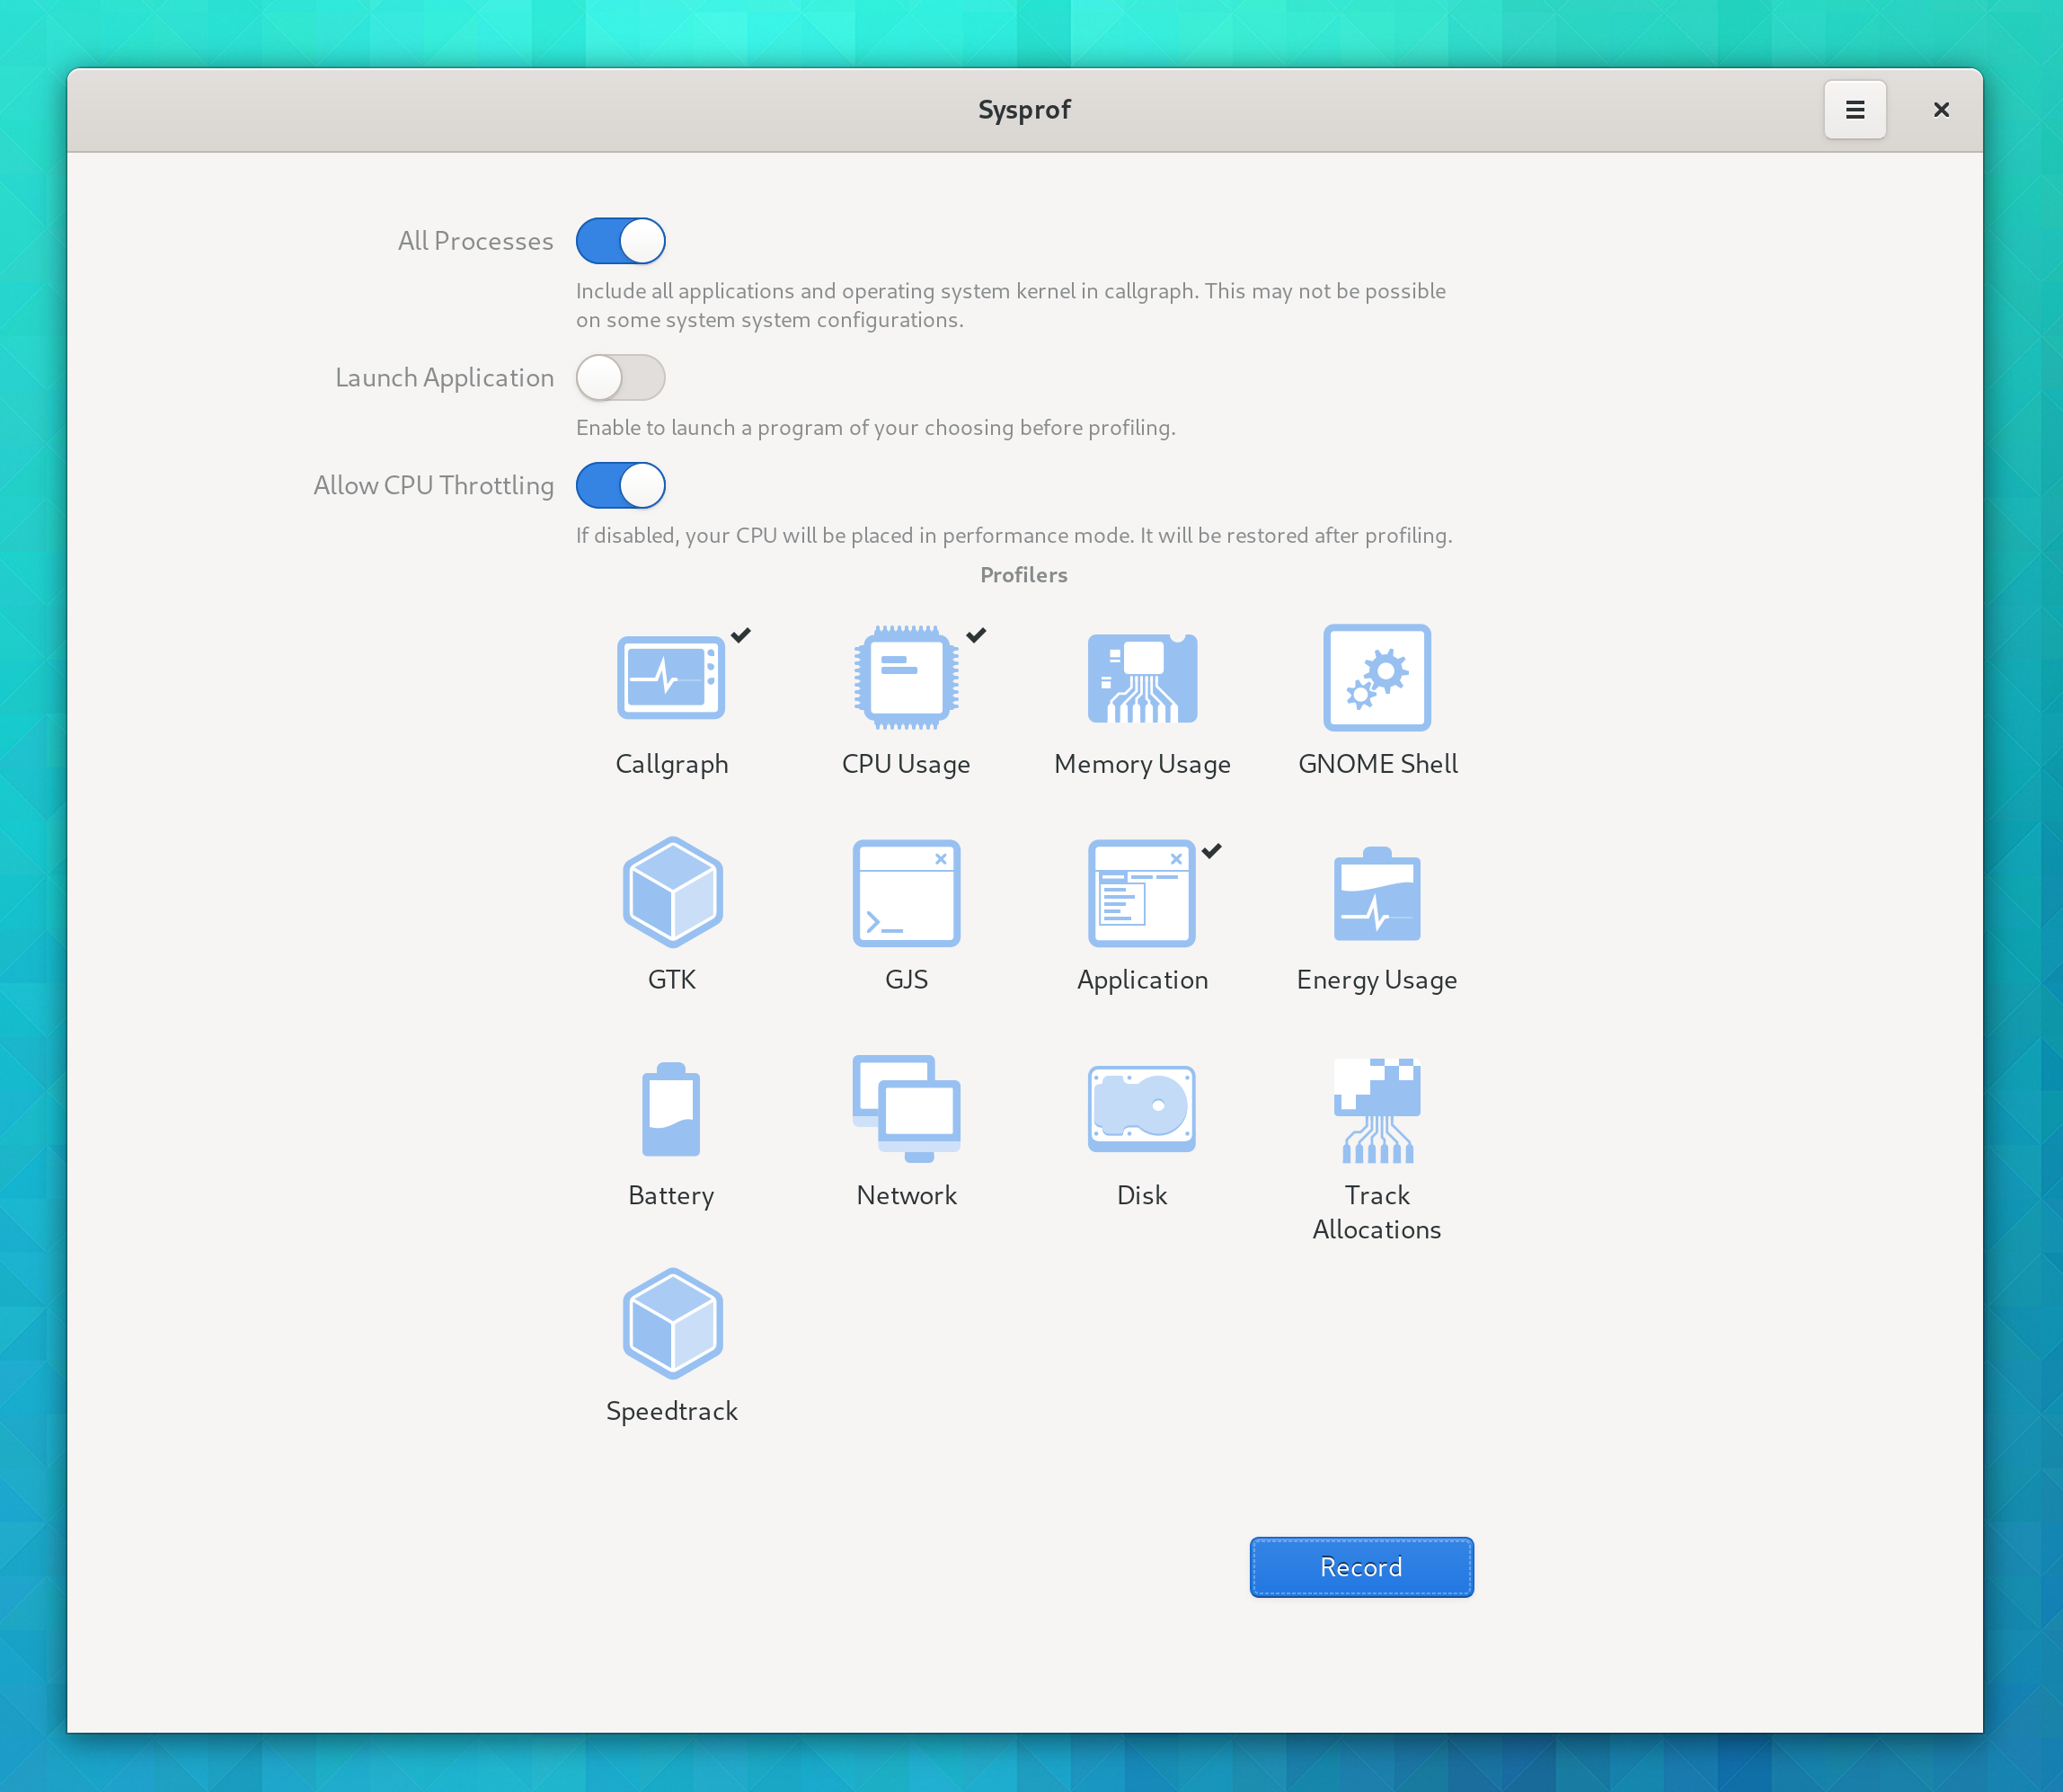
Sysprof, at it’s core, is a “whole system” profiler. That means it is not designed to profile just your single program, but instead all the processes on the system. This is very useful in a desktop scenario where we have lots of interconnected components.
Ensure the “Callgraph” aid is selected and click “Record”.
At this point, excercise your system to try to bring out the behavior you want to optimize. Then click “Stop” to stop recording and view the results.
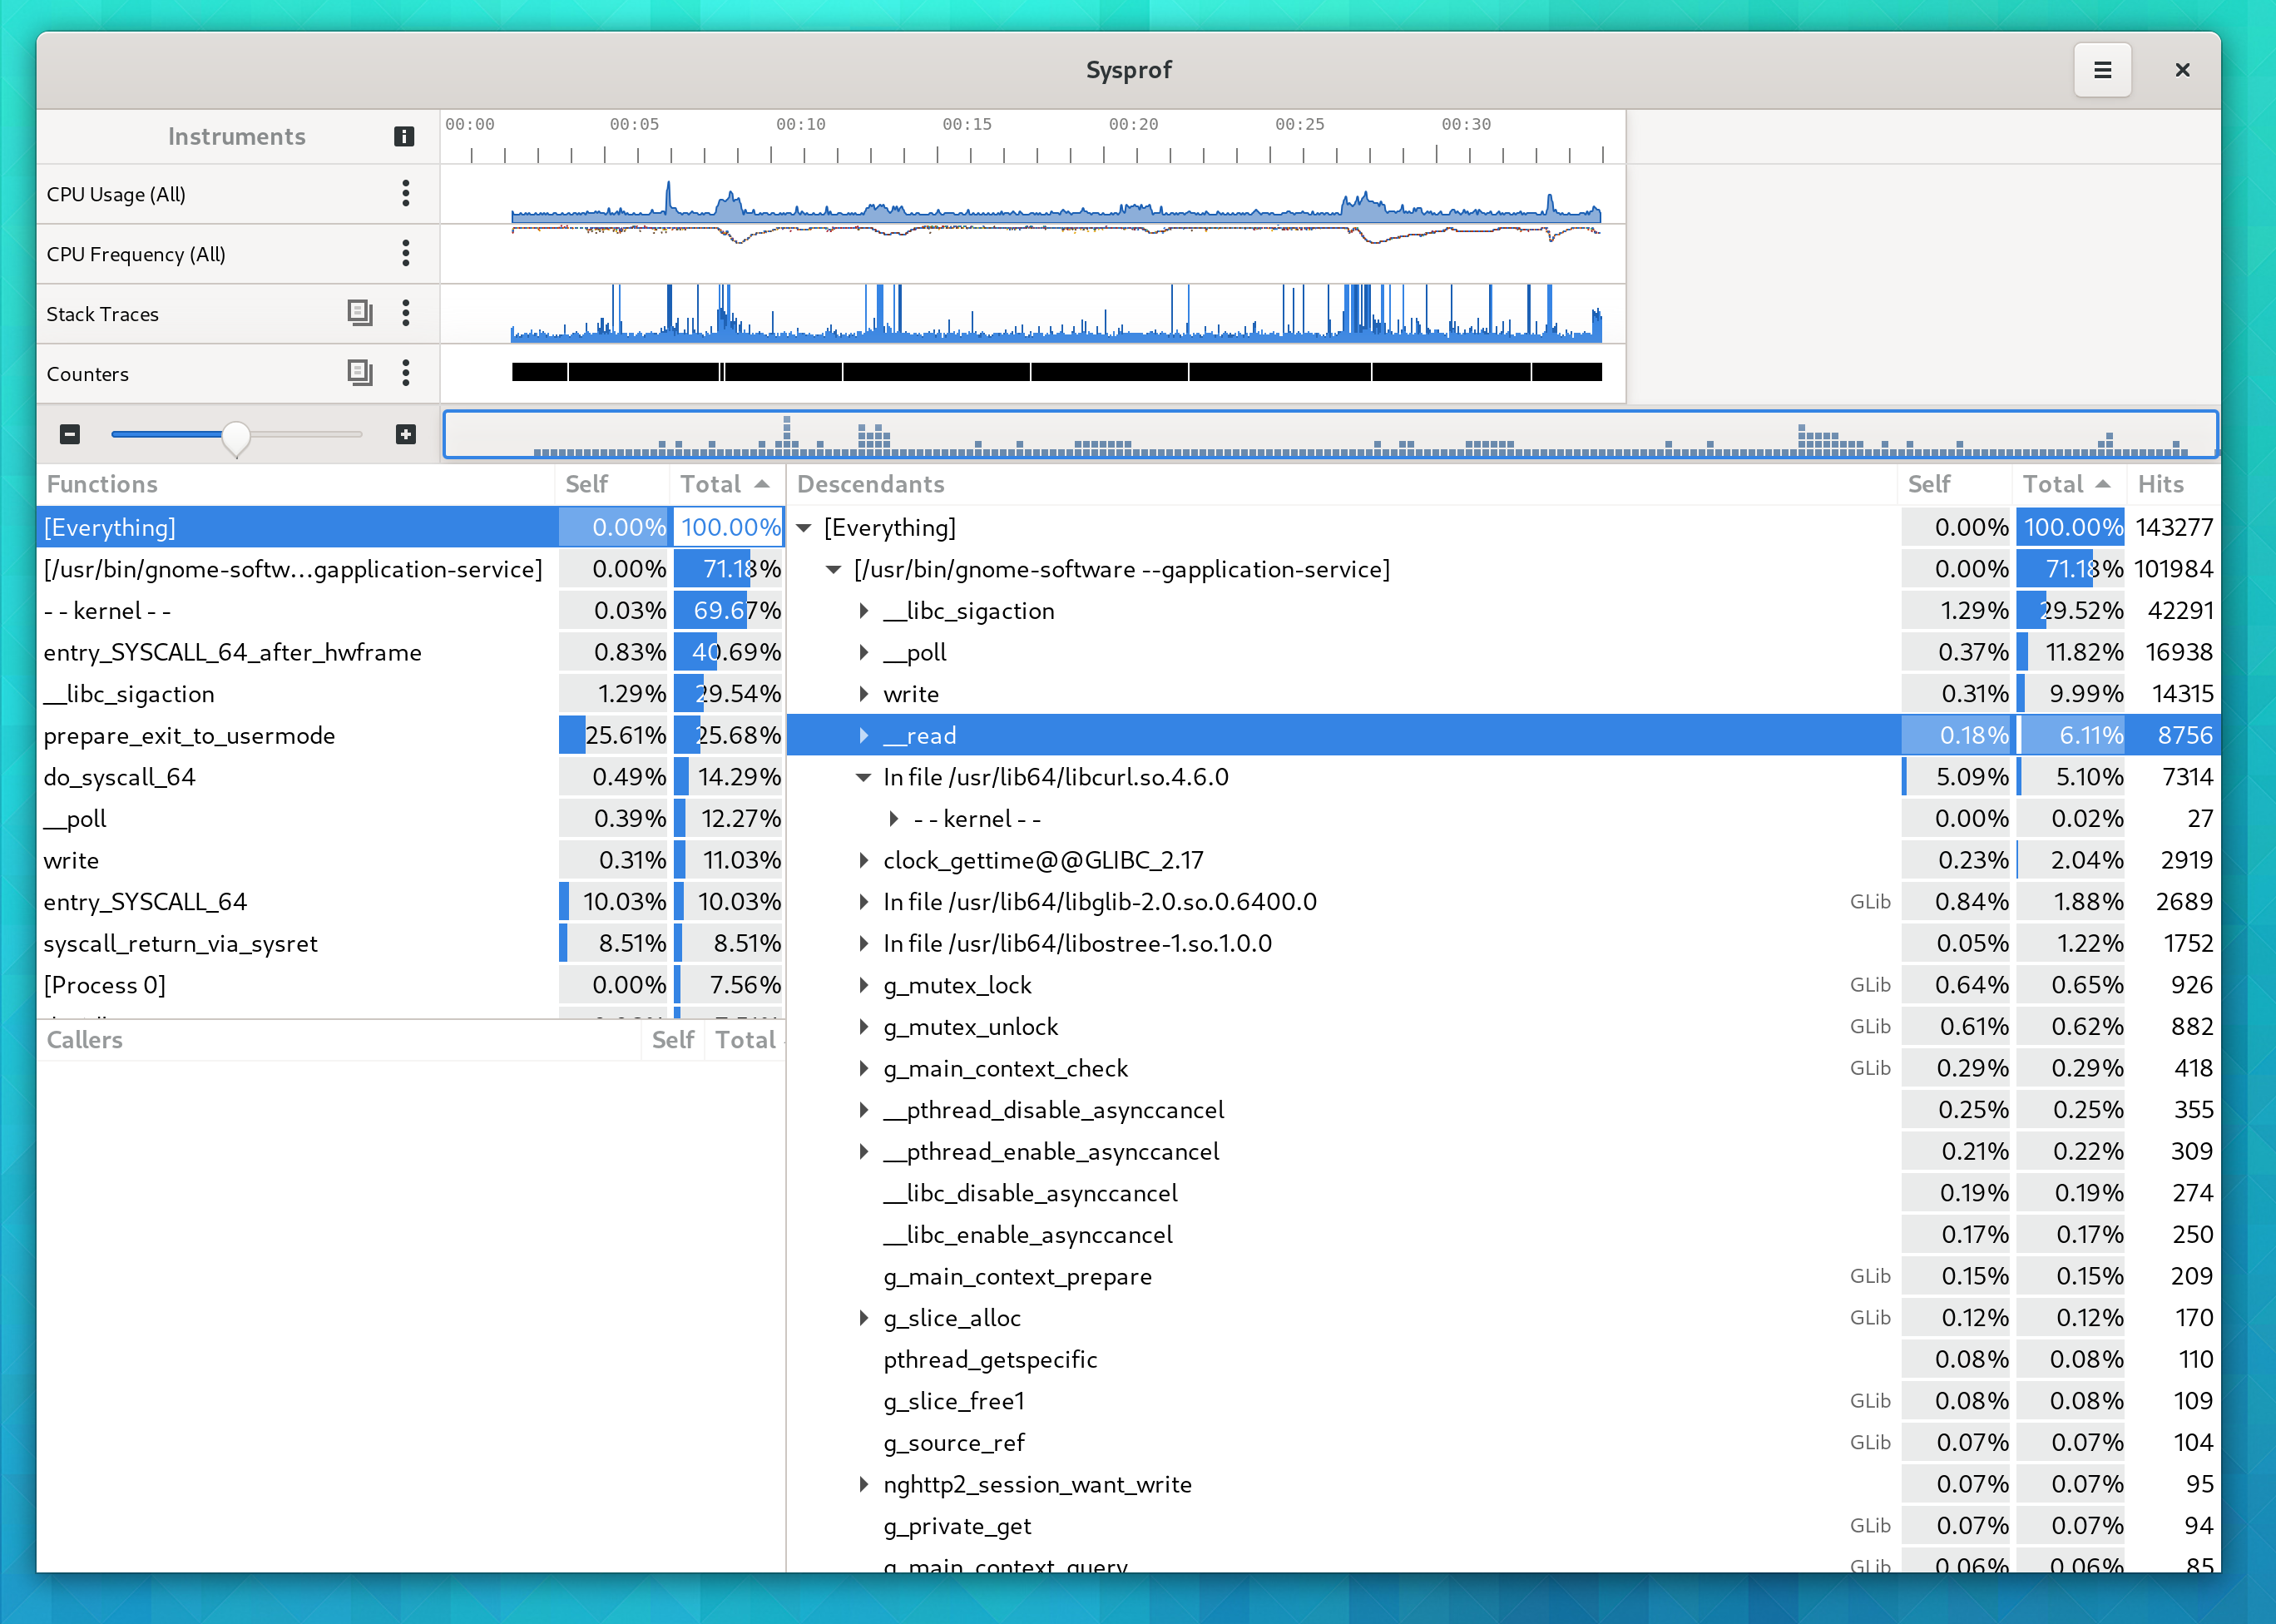
You’ll be presented with a callgraph like the following after it has completed recording and loaded the information.
You’ll notice a lot of time in gnome-software there. It turns out I’m on a F32 alpha install and there was a behavior change in libcurl that has screwed up a number of previously valid use cases. But if I didn’t know that already, this would point me where to start looking. You’ll notice that I hadn’t compiled libcurl or gnome-software from source, so the stack traces are not as detailed as they would be otherwise.
On the right side is a callgraph starting from “[Everything]”. It is split out by process and then by the callstack you see in that program. On the top-left side, is a list of all functions that were collected (and decoded). On the bottom-left side is a list of callers for the selected function above it. This is useful when you want to backtrack to all the places a function was called. (Note that this is a sampling-based profiler, so there is no guarantee all functions were intercepted).
Use this information to find the relevant code within a particular project. Tweak some things, try again, test…
Tracking down extraneous allocations
One of the things that can slow down your application is doing memory allocations in the hot paths. Allocating memory is still pretty expensive compared to all of the other things your application could be doing.
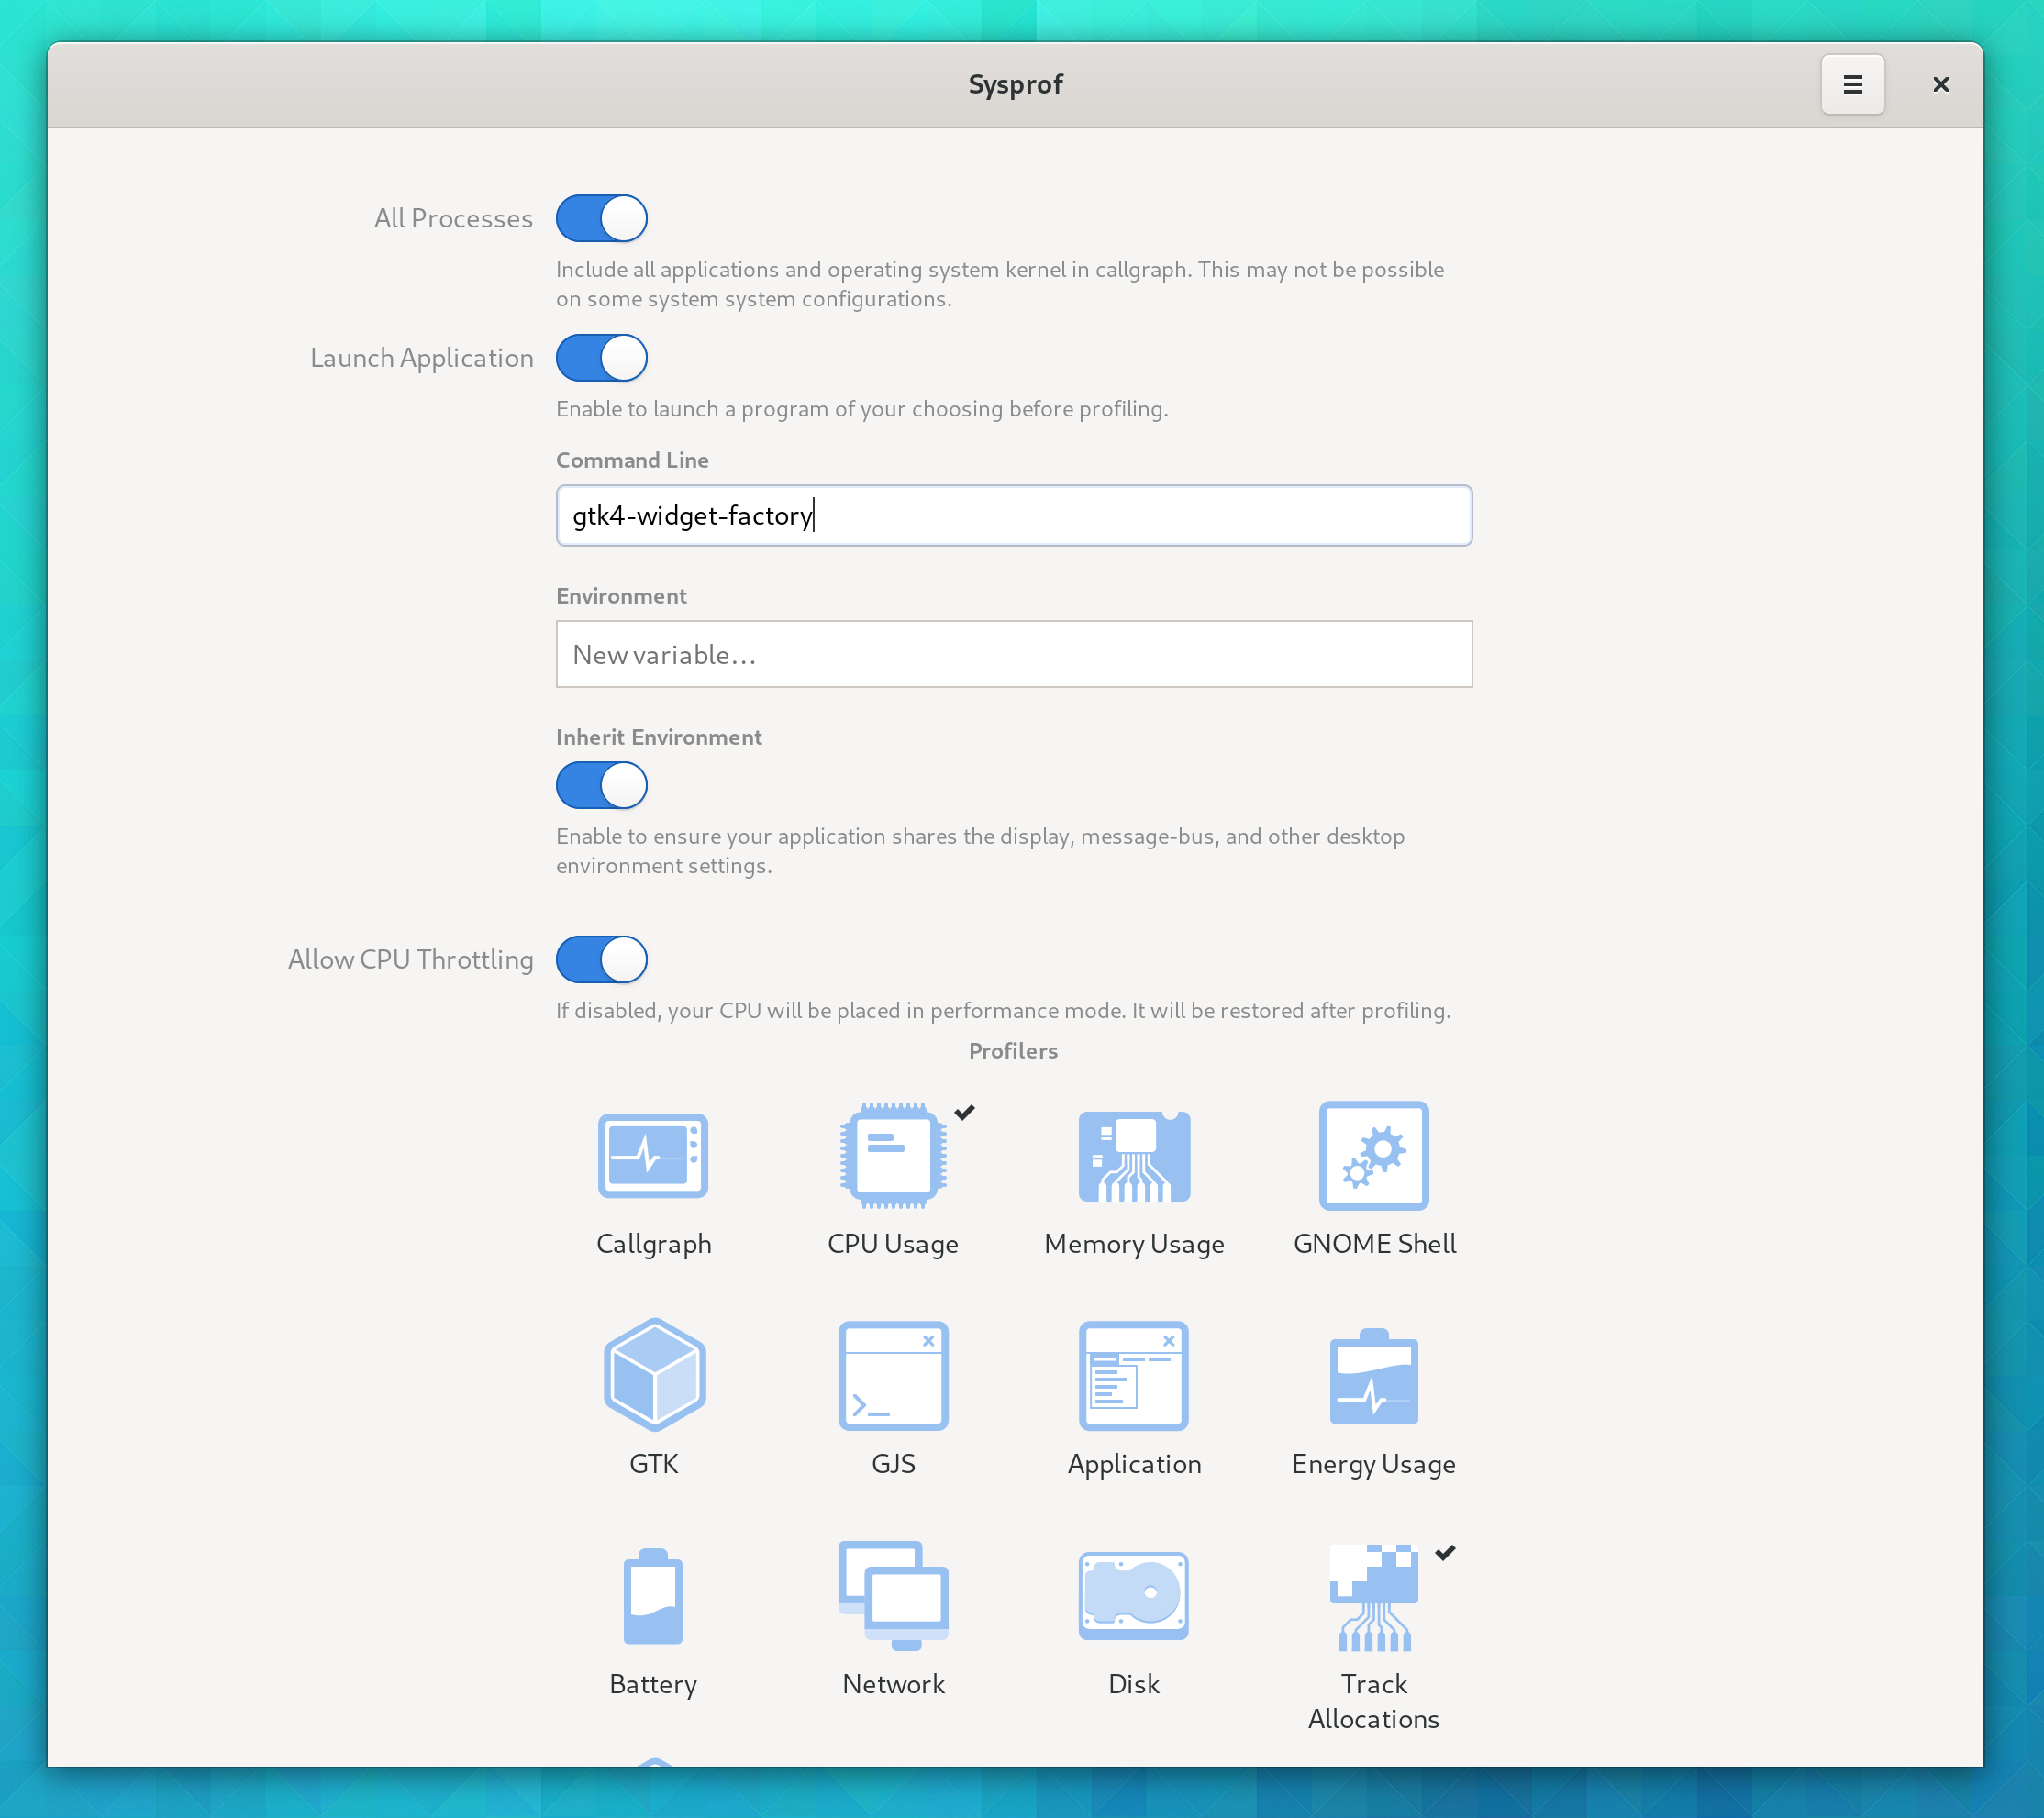
In 3.36, Sysprof gained support for tracking memory allocations with a LD_PRELOAD. However, it must spawn the application directly.
Start by toggling “Launch Application” and set arguments for the application you want to profile. Select “Track Allocations”.
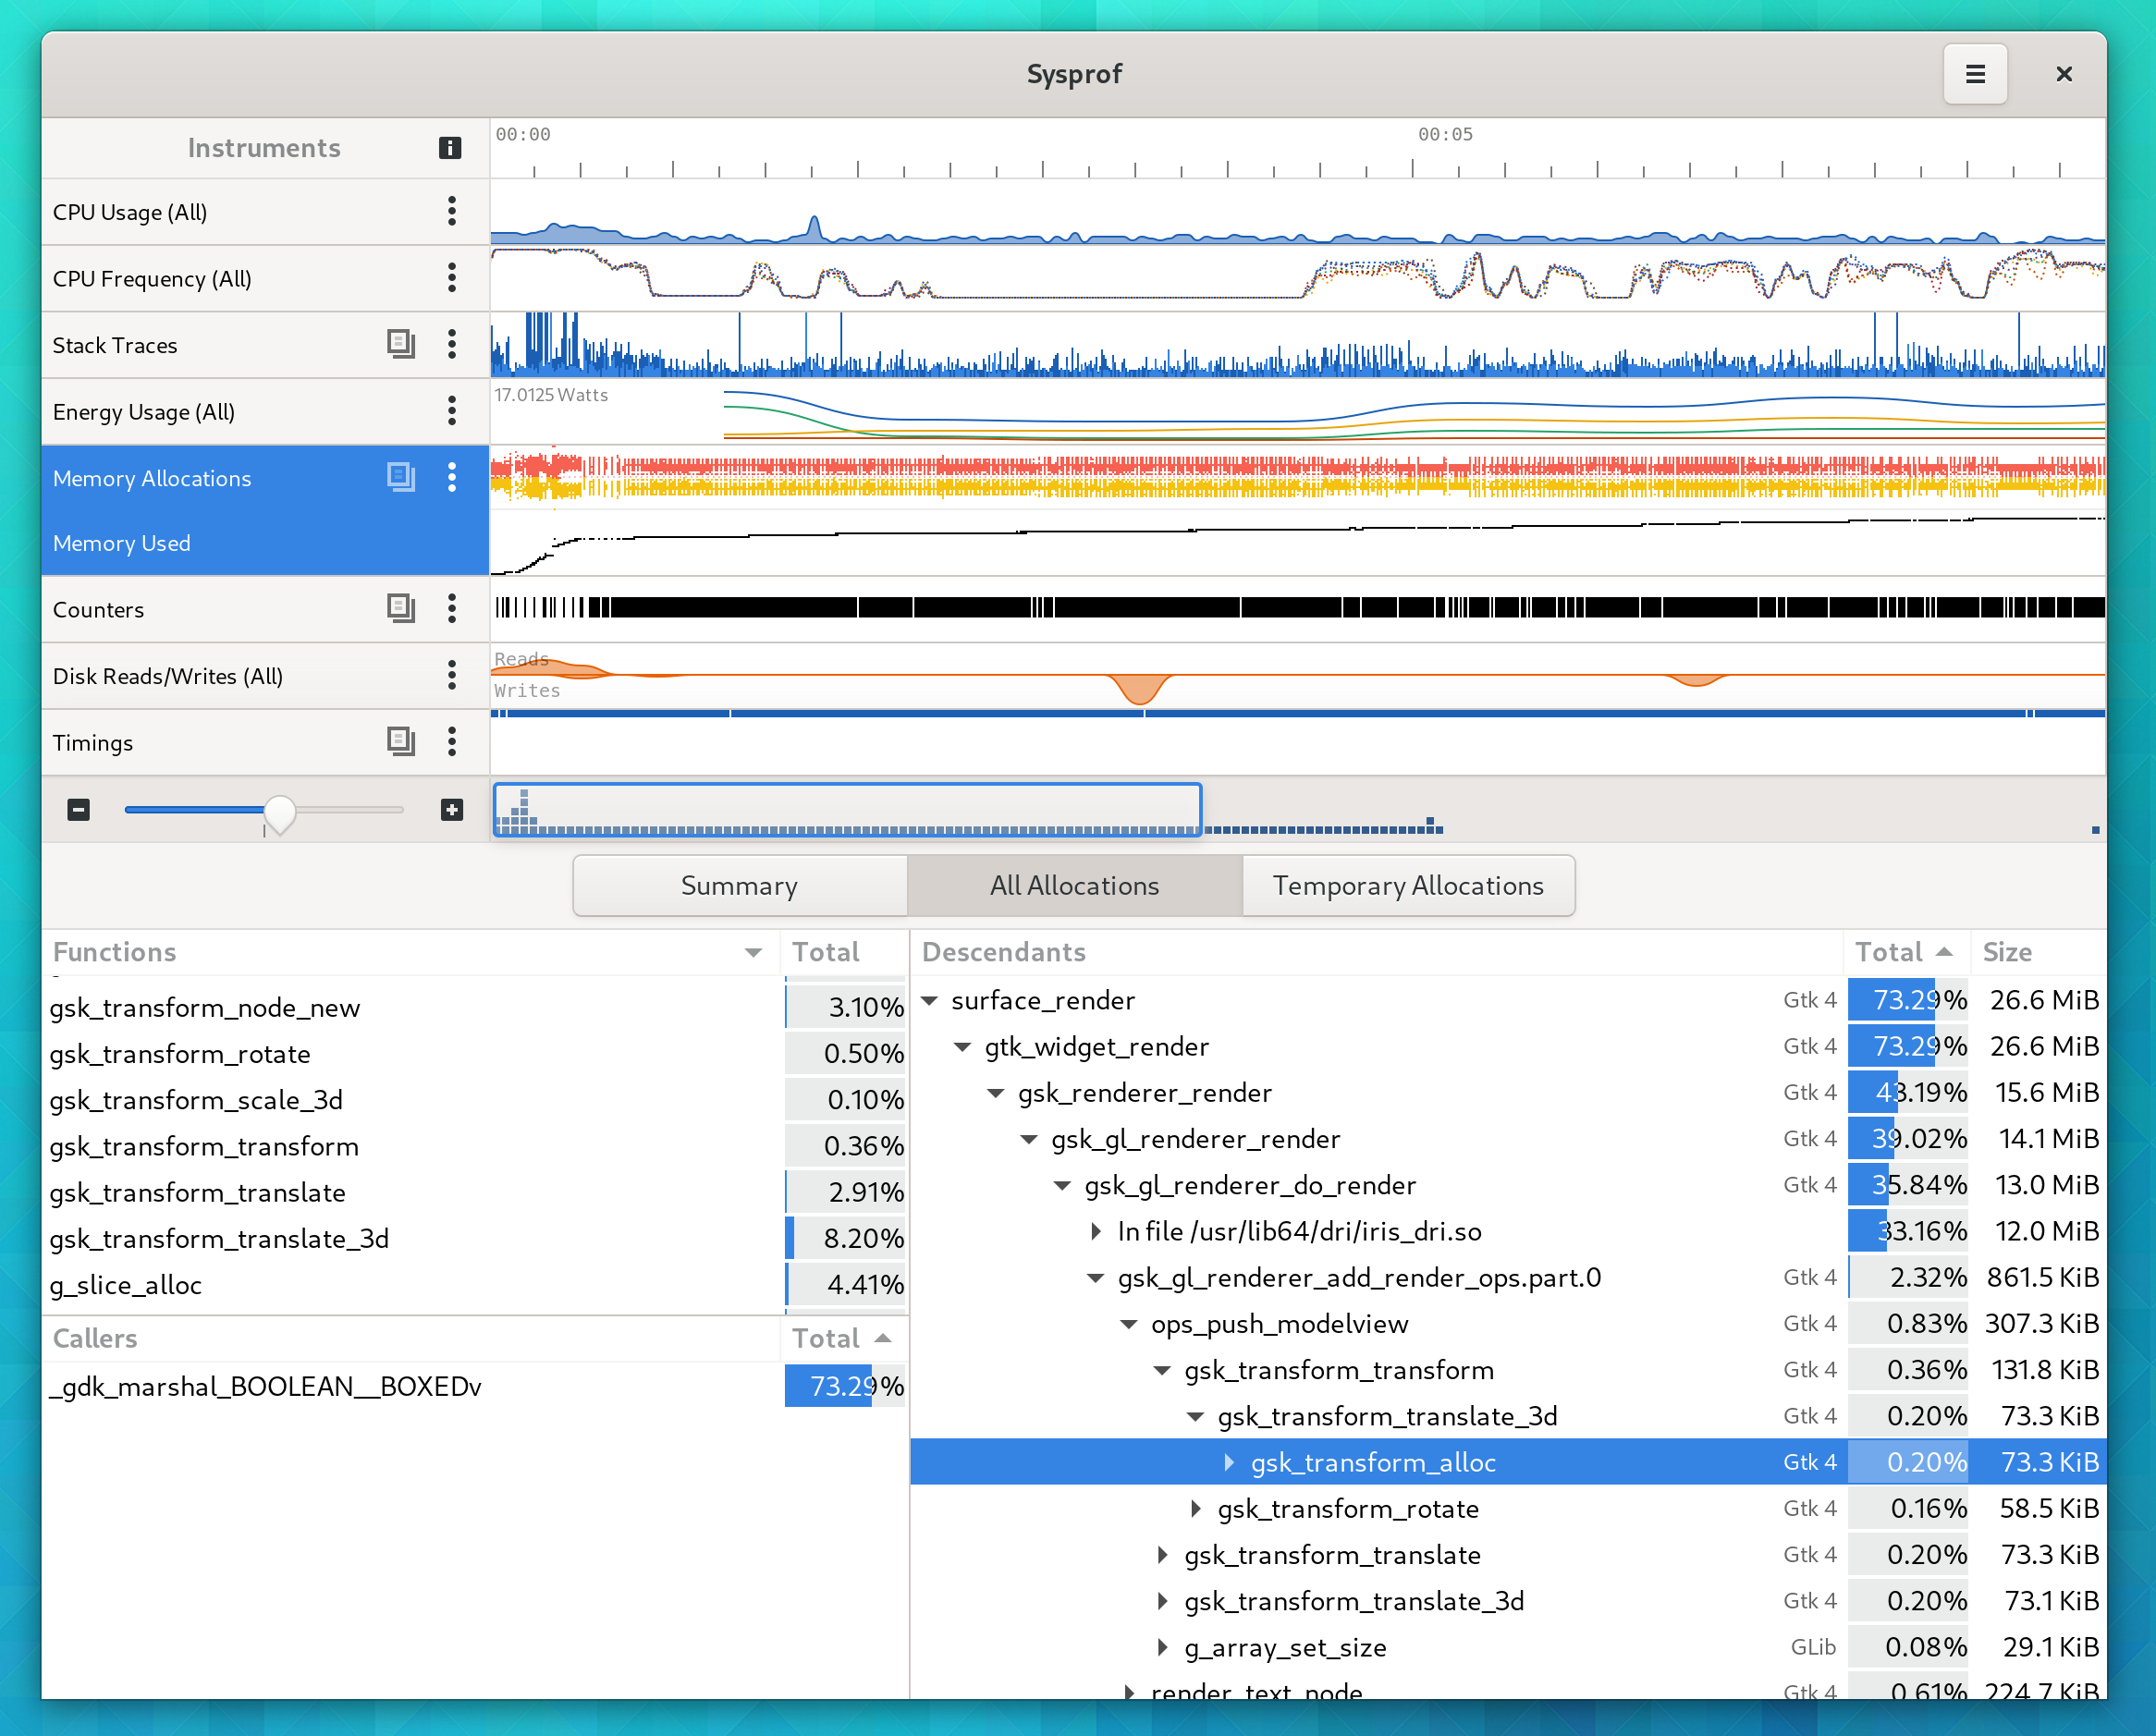
At this point run your application to exercise the targeted behavior. Then press “Stop” and you’ll be presented with the recording. Usually the normal callgraph is selected by default. Select the “Memory Allocations” row and you’ll see the memory callgraph.
This time you’ll see memory allocation size next to the function. Explore a bit, and look for things that seem out of place. In the following image, I notice a lot of transforms being allocated. After a quick discussion with Benjamin, he landed a small patch to make those go away. So sometimes you don’t even have to write code yourself!
A variant of this patch went into Mutter’s copy of Clutter for a healthy memory improvement too.
Finding main loop slow downs
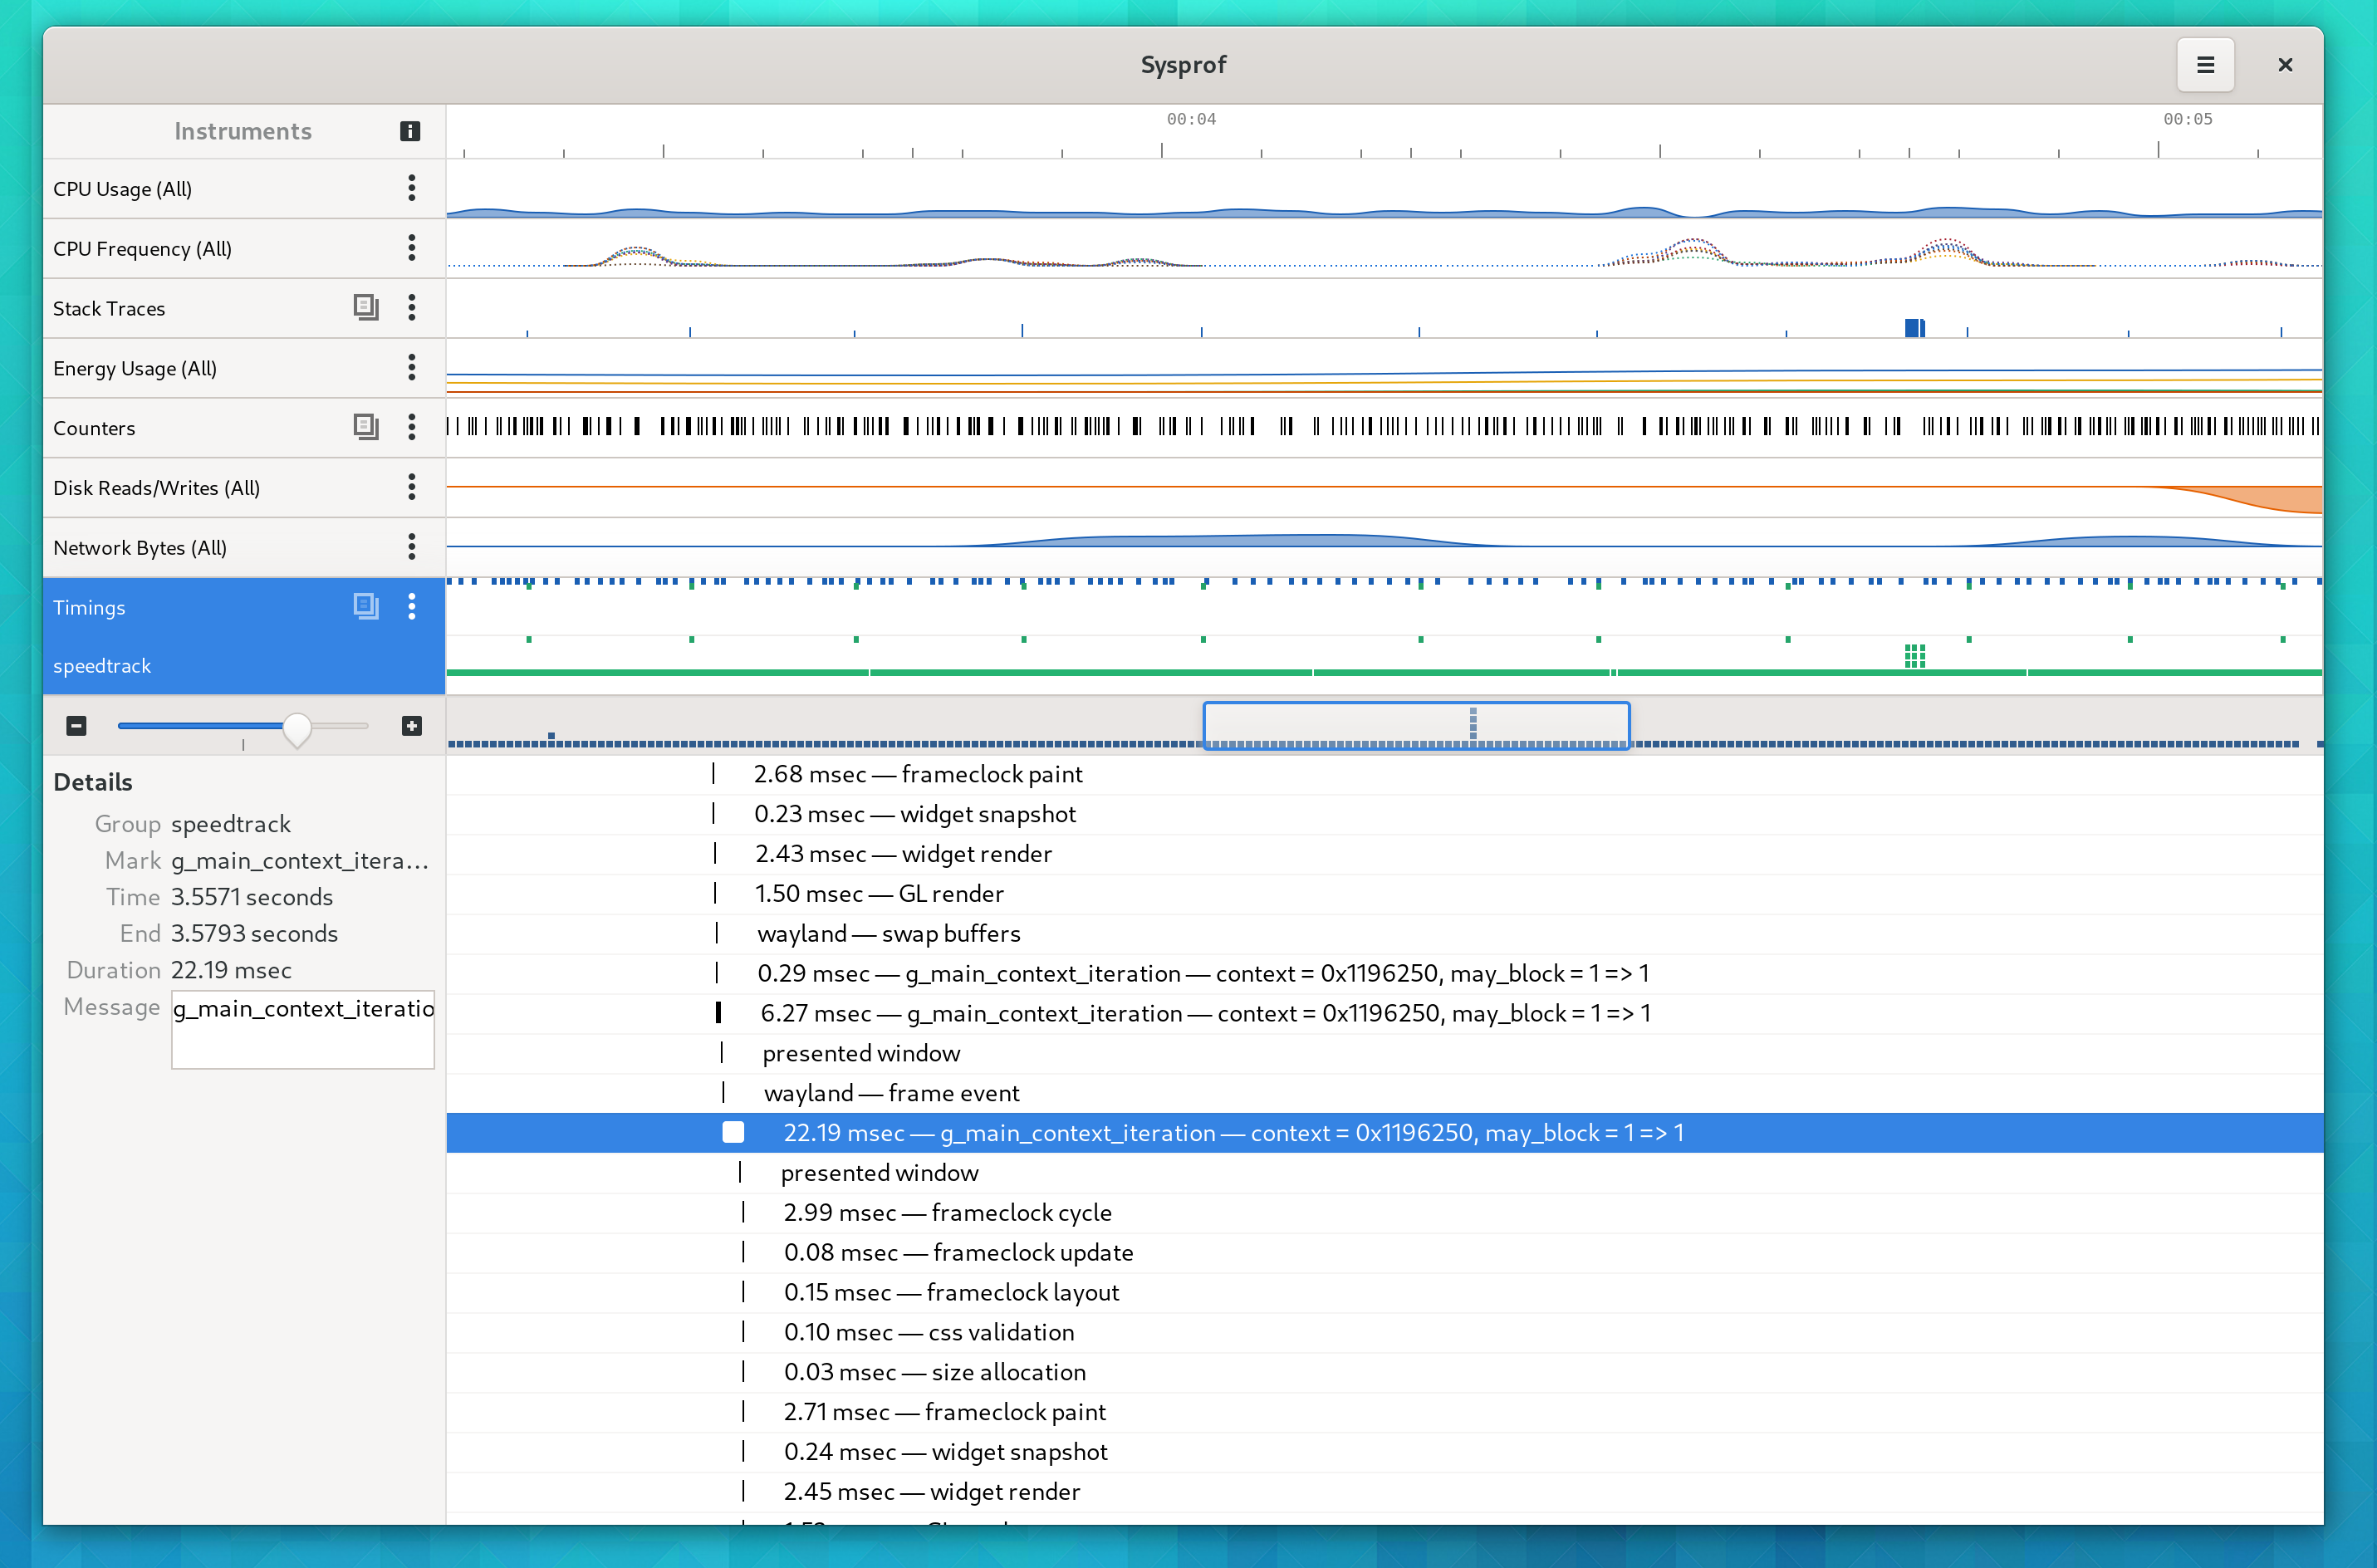
In Sysprof master, we have a “Speedtrack” aid that can help you find various long running operations such as fsync(). I used this late in the 3.36 cycle to fix a bunch of I/O happening on GNOME Shell’s compositor thread. Select the “Speedtrack” aid, and disable the “Callgraph” as that will clash with speedtrack currently. This also uses an LD_PRELOAD so you’ll have to spawn the application just like for memory tracking.
The aid will give you callgraphs of various things that happened in your main thread that you might want to avoid doing. Stuff like fsync(), read() and more. It also creates marks for the duration of these calls so you can track down how long they ran for.
Deep in Pango, various files are being loaded on demand which can mean expensive read() during the main loop operations.
You can also see how long some operations have taken. Here we see g_main_context_iteration() took 22 milliseconds. On a 60hz system, that can’t be good because we either missed a frame or took too long to do something to be able to submit our frame in time. You can select the time range by activating this row. In the future we want this to play better with callgraphs so you can see what was sampled during that timespan.
Anyway, I hope that gives you some insight into how to use things!