Improving poll() timeout precision

Recently I was looking at a VTE performance issue so I added a bunch of Sysprof timing marks to be picked up by the profiler. I combined that with GTK frame timing information and GNOME Shell timing information because Sysprof will just do that for you. I noticed a curious thing in that almost every ClutterFrameClock.dispatch() callback was rougly 1 millisecond late.

A quick look at the source code shows that ClutterFrameClock uses g_source_set_ready_time() to specify it’s next deadline to awaken. That is in µsec using the synchronized monotonic clock (CLOCK_MONOTONIC).

Except, for various reasons, GLib still uses poll() internally which only provides 1 millisecond timeout resolution. So whatever µsec deadline was requested by the ClutterFrameClock doesn’t really matter if nothing else wakes up around the same time. And since the GLib GSource code will always round up (to avoid spinning the CPU) that means a decent amount late.

With the use of ppoll() out of question, the next thing to use on Linux would be a timerfd(2).

Here is a patch to make GLib do that. I don’t know if that is something we should have there as it will create an extra timerfd for every GMainContext you have, but it doesn’t seem insane to do it there either.

If that isn’t to be, then here is a patch to ClutterFrameClock which does the same thing there.

And finally, here is a graph of how the jitter looks when not using timerfd and when using timerfd.

A graph comparing the use of timerfd in ClutterFrameClock. Before, there is an erratic line jumping many times between 100usec and 1000usec. After, the line is stable at around 10usec.

Performance Profiling for Fedora Magazine

I’ve authored an article recently for Fedora Magazine on Performance Profiling in Fedora.

It covers both the basics on how to get started as well as the nitty-gritty details of how profilers work. I’d love for others to be more informed on that so I’m not the only person maintaining Sysprof.

Hopefully I was able to distill the information down a bit better than my typical blog posts. If you felt like those were maybe too difficult to follow, give this one a read.

Faster Numbers

The venerable GtkSourceView project provides a GtkWidget for various code languages. It has a number of features including the most basic, showing a line number next to your line of text.

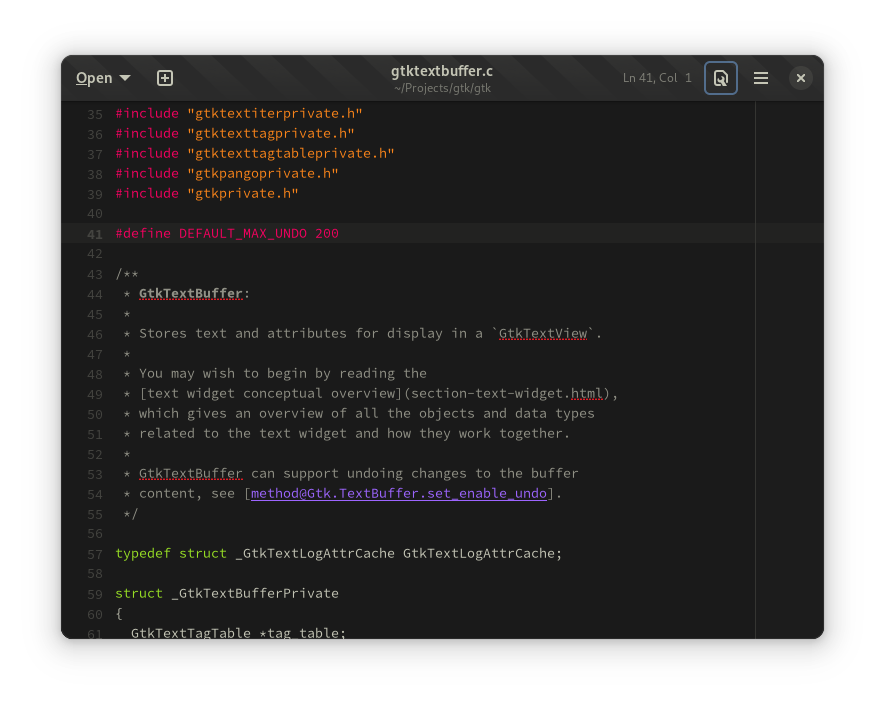
A screenshot of GNOME Text Editor with line numbers enabled containing the file gtktextbuffer.c.

It turns out that takes a lot more effort than you might think, particularly when you want to do it at 240hz with kinetic scrolling on crappy hardware that may barely have enough engine for the GL driver.

First, you need to have the line number as a string to be rendered. For a few years now, GtkSourceView has code which will optimizes the translation from number to strings with minimal overhead. If you g_snprintf(), you’re gonna be slow.

After that you need to know the X,Y coordinate of the particular line within the gutter and it’s line height when wrapped. Then you need to know the measured pixel width of the line number string. Further still you need the xalign/yalign and xpad/ypad to apply proper alignments based on application needs. You may even want to align based on first line, last wrapped line, or the entire cell.

In the GtkSourceView 5.x port I created GtkSourceGutterLines which can cache some of that information. It’s still extremely expensive to calculate but at least we only have to do it once per-frame now no matter how many GtkSourceGutterRenderer are packed into the GtkSourceGutter.

After that, we can create (well recycle) a PangoLayout to setup what we want to render. Except, that is also extremely expensive because you need to measure the contents and go through a PangoRenderer for each line you render.

If you are kinetic scrolling through a GtkSourceView with something like a touch pad there is a good chance that a decent chunk of CPU is wasted on line numbers. Nicht gut.

Astute readers will remember that I spent a little time making VTE render faster this cycle and one of the ways to do that was to avoid PangoLayout. We can do the same here as it’s extremely simple and controlled input. Just cache the PangoGlyphInfo for 0..9 and use that to build a suitable PangoGlyphString. Armed with a PangoFont and said string, we can use gsk_text_node_new() and gtk_snapshot_append_node() instead of gtk_snapshot_render_layout().

A quick hour or so later I have given you back double digit CPU percentages but more importantly, smoother and lower latency input.

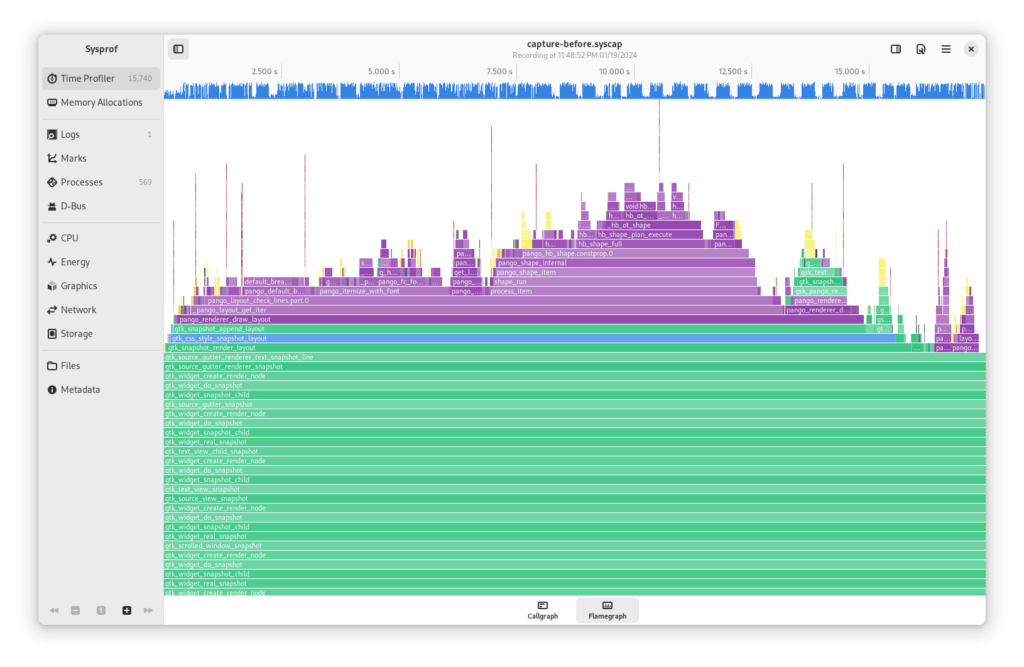
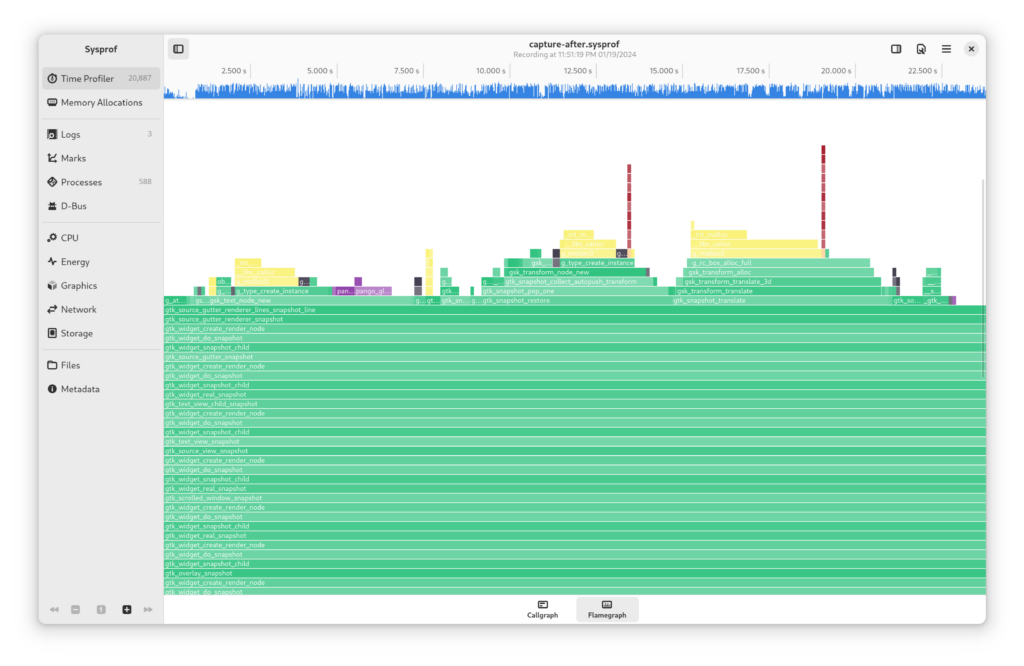
Sysprof makes it easy to locate, triage, and verify performance fixes.

A flamegraph showing that the line number gutter renderer in GtkSourceView was an extremely complex code path.

A flamegraph showing that line number rendering is now a very simple code path.

That said, in the future, if I were redesigning something to replace all of this I’d probably just use widgets for each line number and recycle them like GtkListView. Then you get GtkWidget render node caching for free. C’est la vie.

Flamegraphs for Sysprof

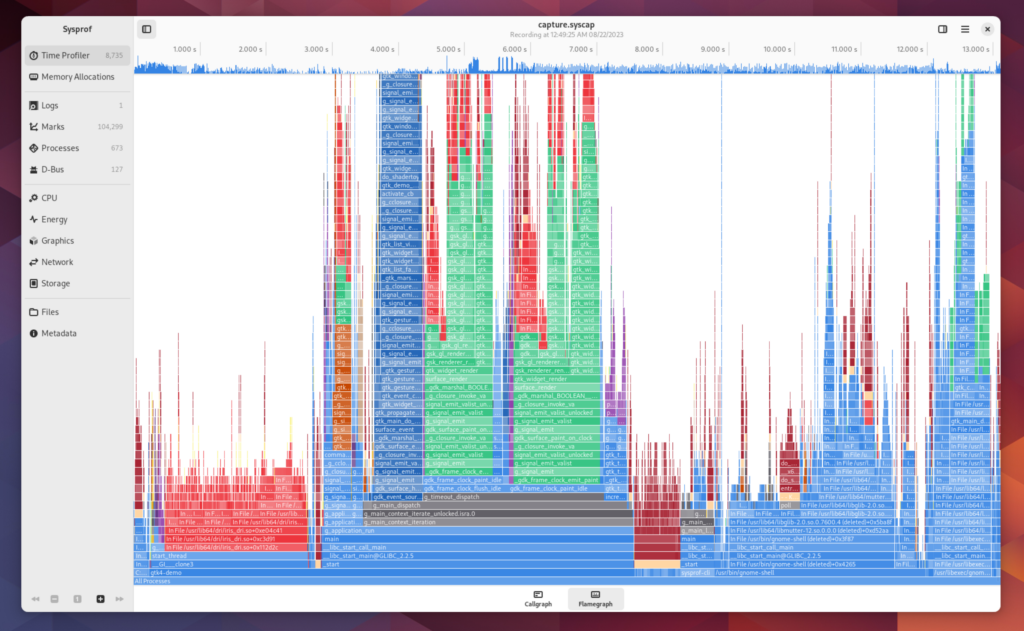
A long requested feature for Sysprof (and most profiler tools in general) is support for visualizing data as FlameGraphs. They are essentially a different view on the same callgraph data we already generate. So yesterday afternoon I spent a bit of time prototyping them to sneak into GNOME 45.

Many tools out there use the venerable flamegraphs.pl but since we already have all the data conveniently in memory, we just draw it with GtkSnapshot. Colorization comes from the same stacktrace categorization I wrote about previously.

A screenshot of flamegraph visualization of a callgraph in Sysprof.

If you select a new time range using the scrubber at the top, the flamegraph will update to stacktraces limited to that selection.

Selecting frames within the flamegraph will dive into those leaving enough breadcrumbs to work your way back out.

Visualizing Scheduler Details

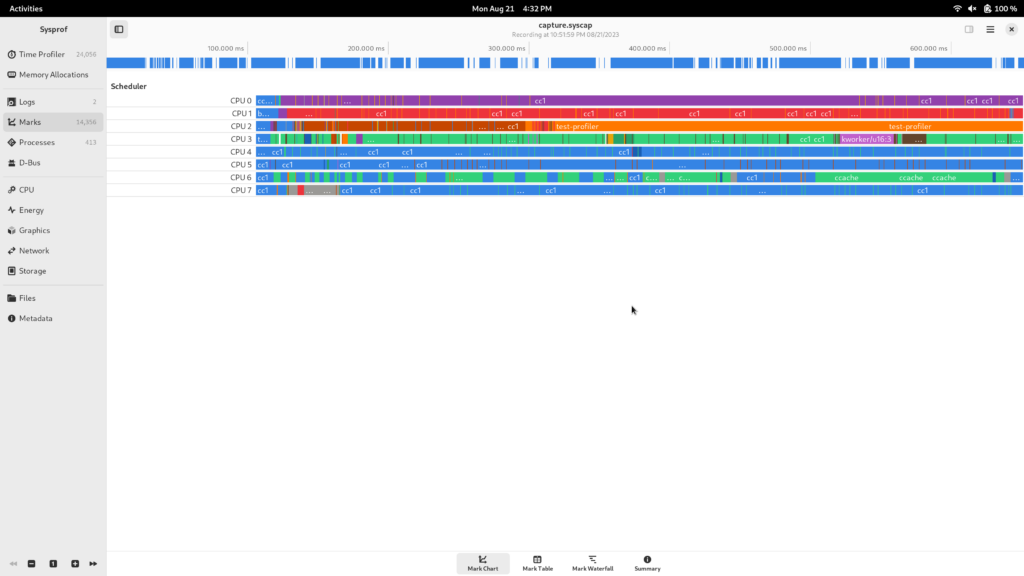
One thing we’ve wanted for a while in Sysprof is the ability to look at what the process scheduler is doing. It can be handy to see what processes where switched and how they may be dependent on one-another. Previously, I’d fire up kernelshark for that as it’s a pretty invaluable tool. But having scheduler data inline with everything else you capture is too useful to pass up.

So here we have the sched:sched_switch tracepoint integrated into Sysprof marks so you can correlate that with the rest of your recording.

Scheduled processes displayed in a time series, segmented by CPU.

Writing Fast Search

The problem we encountered in my last writing was that gnome-clocks was taking about 300 milliseconds to complete a basic search query. I guess the idea is that if you type “paris” into GNOME Shell you’ll get the time in either Paris, France or one of the Paris’ in the United States. I guess 300 milliseconds wouldn’t be so bad if it didn’t also consume 100% of the CPU during that time.

Thankfully in my career I’ve had plenty of opportunity to work with database search indexes. So I have some practical experience in making that stuff fast(er).

So this morning I put together a small search index which can be generated from the Locations.bin using the libgweather API. That search index contains the serialized document form and a series of trigrams for the GWeatherLocation textual representation. That search index is meant to be static and installed along side Locations.bin.

Then for search, you take your term list and generate another series of trigrams. The SearchIndex provides iterators for each of those trigrams to find documents which contain it. So if you line those up with a sorted document list you can create an O(n*m) worst case iterator across potentially matching documents. In practice you look at a very small subset of the corpus.

As you iterate through those, you do your full termlist matching as you would have previously. Except instead of looking at thousands of entries, you look at just a few.

Long story short, you can go from 100% CPU for 300 milliseconds repeatedly to about 10 milliseconds and it keeps getting faster the more you type.

Once again, without tools like Sysprof and distributions with courage to enable frame-pointers like GNOME OS and Fedora, finding this stuff can be quite nebulous.

How to use Sysprof (again)

Every once in a while I take a moment to test GNOME OS on physical hardware.

The experience today was quite a bit underwhelming. Fresh install, type a few characters into the search box, and things grind to a halt.

Being the system profiler author I am, where would I consider spending time to make this better? Here ya go, and please do help because I can make the tools but I need people like you to help go resolve them.

I had to build Sysprof from source quick on GNOME OS until new GNOME OS builds are out (soon).

$ sysprof-cli --session-bus --gnome-shell capture.syscap 
$ sysprof ./capture.syscap

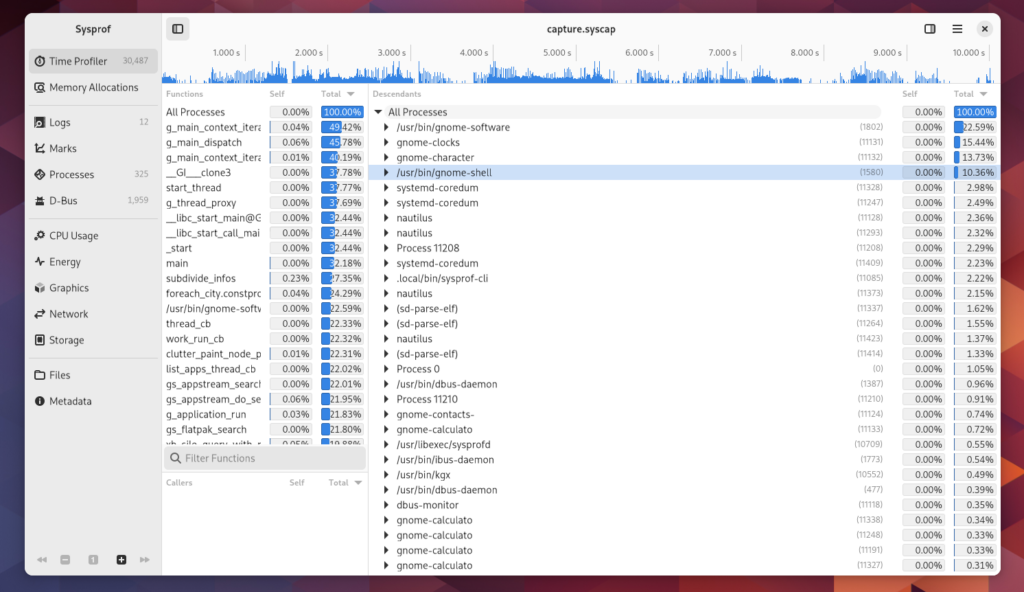
An overview of time spent in various processes

Interesting, a couple systemd-coredump processes busy doing ztsd compression on Nautilus crashes (in search providers). Issue filed.

Next up, gnome-software clocking in at 23% CPU (and remember, we’re competing against multiple zstd compressors for CPU time) which is busy doing appstream search for Flatpaks. Seems a bit high for something which is pre-compiled into a binary format and mmap()d at runtime to reduce CPU and memory overhead. Issue filed.

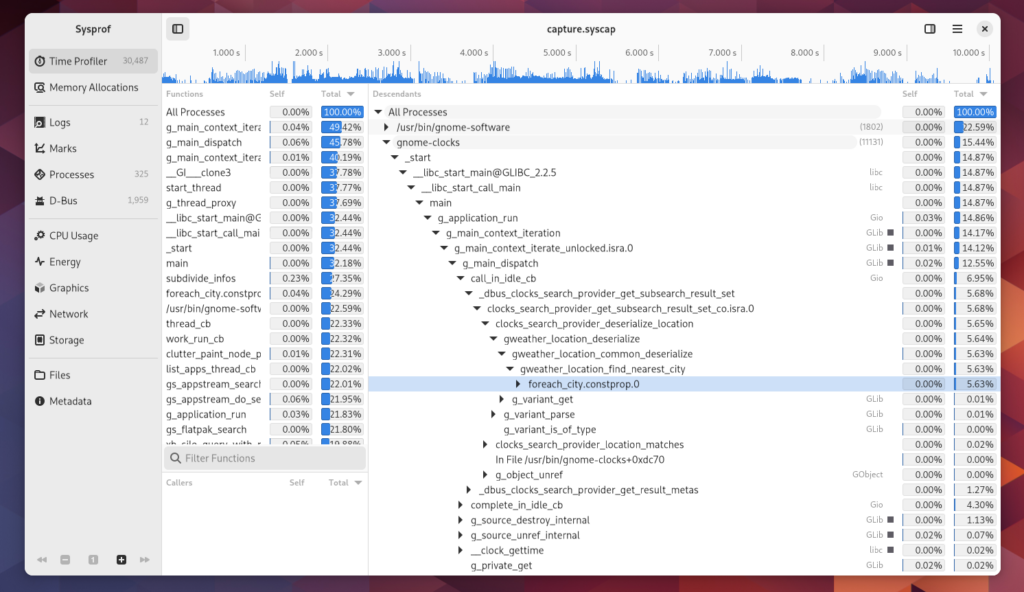
A screenshot of gnome-clocks search provider busyin libgweather deserialization.

Next is gnome-clocks at a whopping 15% to show me the time in cities near to whatever I type which is obviously “Riga” given GUADEC. Again, that’s 15% while competing with multiple zstd so in reality it’d be even more. Appears to be busy in libgweather doing deserialization, but specifically in finding the nearest city to a lat/lon position. A quick look at the code shows that this is probably one of the most expensive operations you can do and it’s done for every object deserialized. Probably could use some flags to avoid that from a search provider. Issue filed.

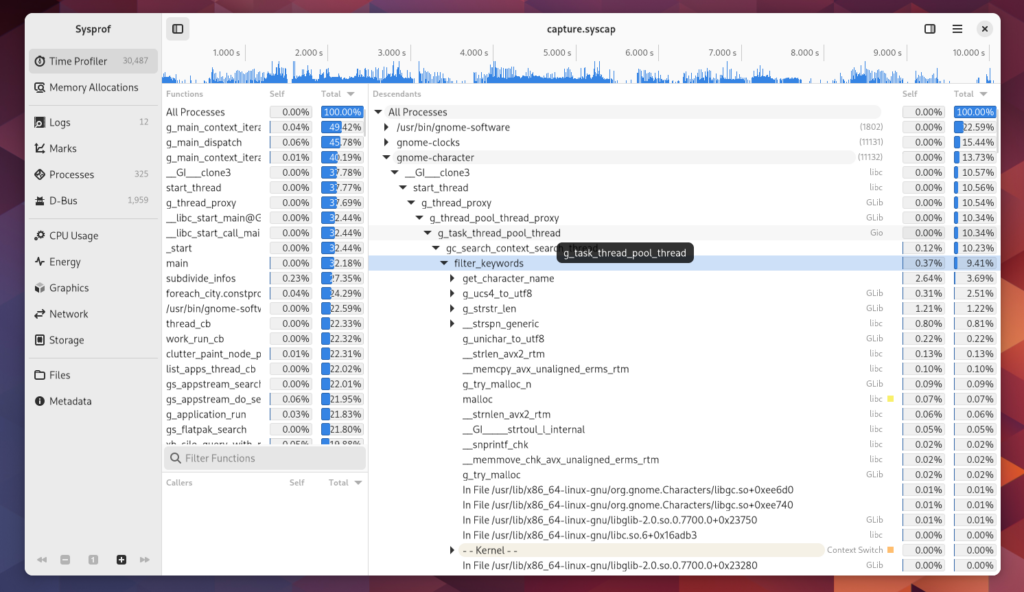
A screenshot of gnome-characters search provider taking 10% of system time in filter_keywords

Lastly in our top-offenders list is gnome-characters search provider. It’s clocking in at roughly 10% of system time (again, would be more if not for zstd) filtering keywords and getting character names. Considering we’re only showing up to maybe 3 of these results that seems significantly high. Issue filed.

So I implore my readers to go and make things fast.

Additionally, to be a good citizen myself, I put together an MR that makes search in Characters much, much faster.

And some fixes to make libxmlb faster (Software) here and here.

Sysprof 45

Unfortunately I couldn’t be at GUADEC this year, but that wont stop me from demoing new things!

I’ve been doing a lot of work on Sysprof now that we have semi-reliable frame unwinding on Fedora, Silverblue and GNOME OS. When I have tolling that works on the OS it makes it a lot easier to build profilers and make them useful.

Additionally, we’re at a good point in GTK 4 where you can do really powerful things if you design your data models correctly. So this cycle I’ve spent time redesigning how we record and process our captured data.

There is certainly more work to be done, but the big strokes of the new design are in place. It could really use the benefit of another person joining in to help polish various bits of the apps like scales and legends.

For 45 I decided to remove the tabbed interface and Builder will now just open captures with Sysprof directly. It’s too cumbersome to try to shove all this information into a single view widget just so I can embed it in Builder.

Greeter

The first thing you’ll see is a new greeter. It still has a bit more to finish but my primary goal was to elevate how things work. That was something lacking with just icons like we had previously.

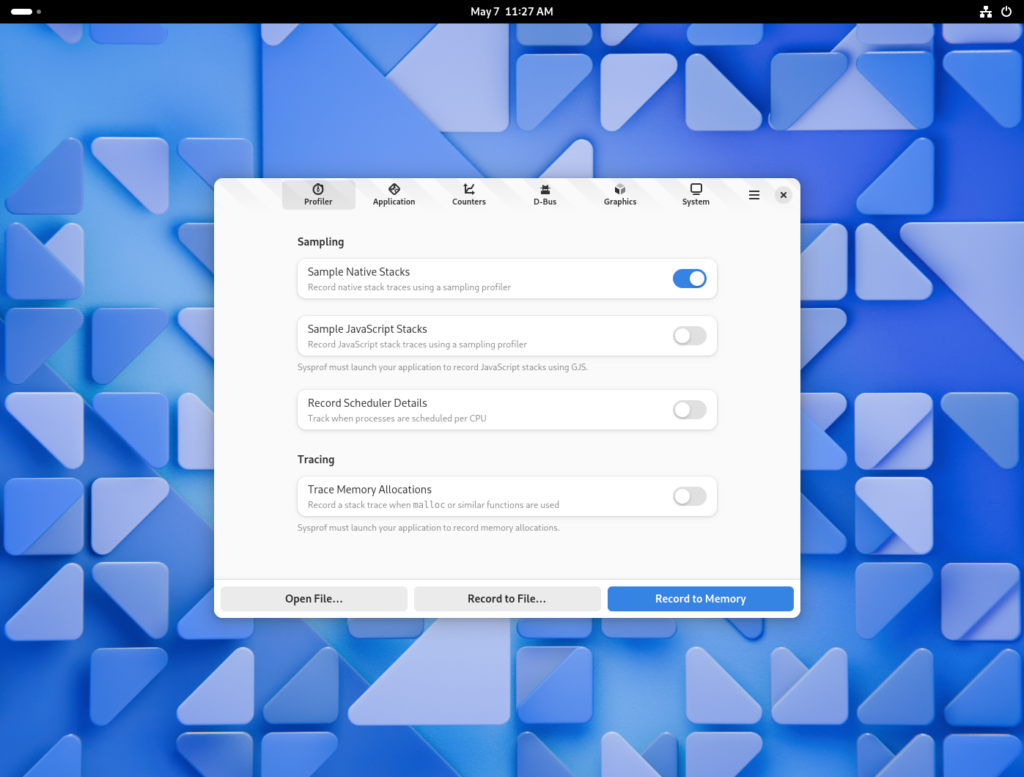
A screenshot of the window that displays when you start Sysprof 45

You’ll also notice you can capture either to disk or to memory. Depending on your situation that may be of use. For example, if you’re testing under memory pressure, creating an unbounded memfd may not be what you want. Instead you can capture to disk and the capture will periodically flush when the buffer is full.

Recording Pad

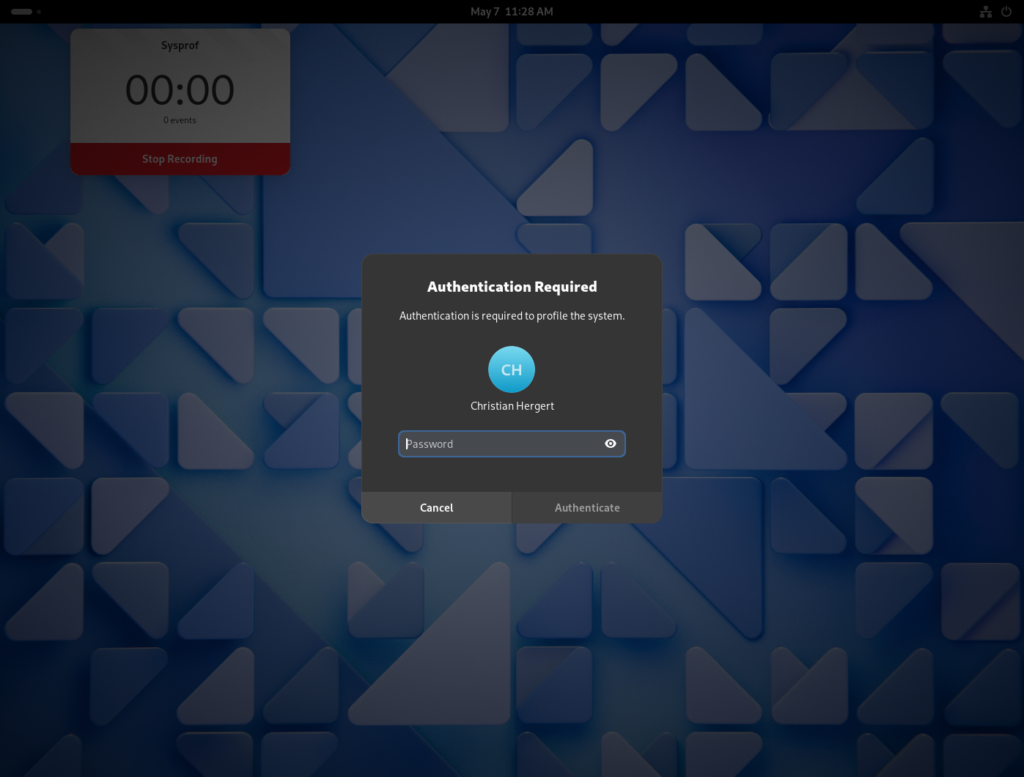
While recording, Sysprof now creates a much smaller recording pad that you can use to stop the recording. The goal here is to further reduce overhead created by Sysprof itself. It still updates once per second to give you an idea of how many data frames have been recorded to the capture.

A screenshot showing a small dialog that appears while recording to minimize rendering overhead.

Exploring Captures

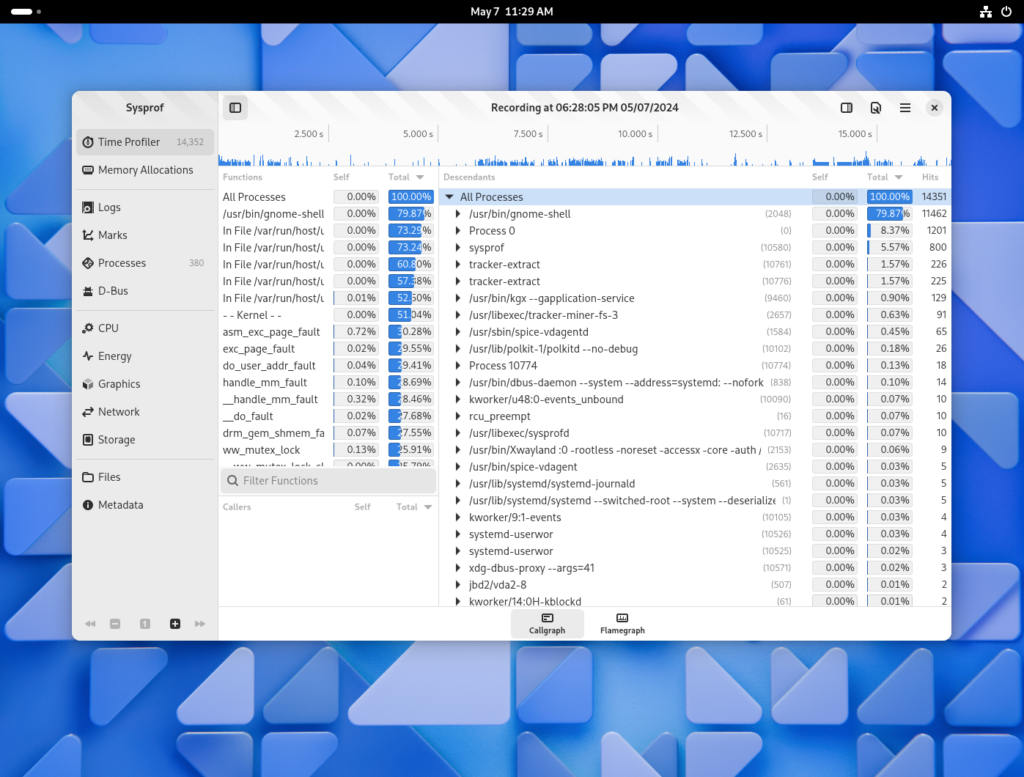
After capturing your system, you’ll be presented with a window to explore the capture.

A screenshot showing a window to explore captured data. It has categories along the left sidebar with a chart showing stack depth above a traditional callgraph display.

Things were getting pretty cramped before, so the new sections in the sidebar make it easier for us to put related information together in a way that is understandable.

I tried very hard to keep the callgraph in the three-section format we’ve used for many years. However, it has a nice filter now on the functions list thanks to GtkFilterListModel making it so easy.

Selecting Time Spans

Many parts of the window will automatically filter themselves based on the selected time span. Use the charts at the top of the window to select time ranges that are interesting. You can use the controls in the sidebar to navigate the capture as well.

You can click the + icon within the selection to zoom into that range.

A screenshot showing a time span selected with a filtered callgraph only containing stack traces from that time range.

Callgraph Options

There are a number of new callgraph options you can toggle.

  • Categorized Frames
  • Hide System Libraries
  • Include Threads
  • Bottom Up

A menu showing options for the callgraph.

They are all pretty standard things in a profiler so I don’t need to dwell on them much. But having a “Bottom Up” option means we have some help when you run into truncated stack traces and still want to get an idea of what’s going on by function fragments. The new “Include Threads” option lets you break up your callgraph by one more level, the thread that was running.

Categorized Stack Traces

While I was working on this I had to add a few things I’ve wanted for a while. One such thing was a utility sidebar that can be shown with additional information relative to the current selection. In this case, you can expand the callgraph and see a list of all the stack traces that contributed to that callgraph frame showing up in the capture. Additionally, we can categorize stack traces based on the libraries and functions contributing to them to give you a high-level overview of where time is being spent.

A screenshot showing the utility sidebar on the right of the callgraph with the ability to select and view stacktraces one-by-one and a categorization breakdown of recorded stacktraces such as Kernel, Memory Allocations, Paint, Layout, and more.

Logs View

When spawning an application from Sysprof it can write logs by integrating with libsysprof-capture-4.a. That’s not new but what is new is that Sysprof now has a journald collector which can be interposed in your capture.

A screenshot showing logs from Builder and journald side-by-side, captured as part of the system capture.

Marks

Marks have gone through substantial work to be more useful.

A mark is just a data frame in the capture that has a time and duration associated with a category, name, and optional message. These are used by GNOME Shell to annotate what is happening in the compositor as well as by GTK to denote what is happening during the frame cycles. Furthermore, GLib has optional Sysprof support which can annotate your main loop cycles so you can see why applications are waking up and for how long.

Marks Chart

The first new view we have for this is the “Mark Chart”. It contains a breakdown of the selected time span by category and name. The X axis is of course time.

A screenshot showing a chart of marks and their durations in a convenient and compact display.

Marks Table

Sysprof now has a long-requested mark table.

A screenshot containing a list of marks in a table which contains time, cpu, duration, and more all of which can be sorted.

Sometimes its easier to look at data in a more raw form. Especially since you can sort by column and dive into what you care about. It doesn’t hurt that this is much more accessibility friendly too.

Marks Waterfall

We still have the old waterfall style display as well so you can see how things naturally depend on one-another.

A screenshot of marks in order of time and duration which naturally shows dependency graphs.

You can double click on these waterfall entries and the visible time region will update to match that item’s duration.

Marks Summary

It was a bit hidden before, but we still have a mark summary. Although I’ve beefed it up a bit and provide median values in addition to mean. These are also sortable like the other tables you’ll find in Sysprof.

A screenshot showing the breakdown of marks and their min, max, mean, and median durations.

Processes

We now give you a bit more insight into the processes we discovered running during your capture. The new Processes section shows you a timeline of the processes that ran.

A timeline of processes that were run and their durations and command line arguments.

Additionally there is a table view, again more accessible and sometimes easier to read, sort, and analyze. If you double click a row you’ll get additional information on that process such as the address layout, mounts, and thread information we have.

This is all information that Sysprof collects to be able to do it’s job as a profiler and we might as well make that available to you too.

A screenshot showing the table of process information and the additional information on a single process including Address Layout.

D-Bus Messages

You can record D-Bus messages on your session or system bus now. We may end up needing to tweak how we get access to the system bus so that you are more certain to have privileges beyond just listening from your read socket.

There are no fancy viewers like Bustle yet, but you do have a table of messages. Someone could use this as a basis to connect the reply message with the send message so that you can draw proper message durations in a chart.

A screenshot containing a table of D-Bus messages that were recorded from the session bus.

Counters

Counters have been broken up a bit more so that we can expand on them going forward. Different sections have different additional data to view. For example the CPU section will give you the CPU breakdown we recorded such as processor model and what CPU id maps to what core.

I find it strange that my Xeon skips core 6 and 7.

A visual breakdown of CPU information.

There are all the same counters we had previously for CPU, Energy (RAPL), Battery Charge, Disk I/O, Network I/O, and GTK counters such as FPS.

A screenshot of the Graphics counters including FPS and GTK GL renderer specific information.

Files

Sysprof supports embedding files in chunks within the *.syscap file. The SysprofDocument exports a GListModel of those which can be reconstructed at will. Since we needed that support to be able to model process namespaces, we might as well give the user insight too. Lots of valuable information is stored here, typically compressed, although Sysprof will transparently decompress it for you.

This will hopefully speed up maintainers ability to get necessary system information without back-and-forths with someone filing an issue.

A screenshot showing the list of files embedded in the system capture, and a window display the contents of the /etc/os-release file.

Metadata

A metadata frame is just a key/value pair that you can embed into capture files. Sysprof uses them to store various information about the capture for quick reference later. Since we’re capturing information about a user’s system, we want to put them in control of knowing what is in that capture. But again, this is generally system statistics that help us track down issues without back-and-forths.

A screenshot containing a table of metadata such as the display environment variable, system memory usage, and the command line arguments used to spawn a profiled application.

Symbolizing

The symbolizing phase of Sysprof has also been redesigned. To effectively handle the changes in how systems are built now from when Sysprof was revamped requires quite a bit of hand-waving. We have containers with multiple and sometimes overlapping storage technologies, varying file-systems used for the operating system including those with subvolumes which might not match a processes, chroots and ostrees.

To make things mostly work across the number of systems I have at my fingertips to test with required quite a bit of iterative tweaking. The end result is that we basically try to model the mount namespace of the target process and the mount namespace of the host and cross-correlate to get a best guess at where to resolve the library path. At that point, we can try to resolve additional paths so that looking at .gnu_debuglink still results in something close to correct.

We also give you more data in the callgraph now so if you do get an inode mismatch or otherwise unresolveable symbol you at least get an offset within the .text section of the ELF you can manually disassemble in your debugger. Few people will likely do this, but I’ve had to a number of times.

To make that stuff fast, Sysprof has a new symbol cache. It is the combination of an augmented Red-Black tree with address ranges (so an interval tree). It’s maintained per-process and can significantly reduce decoding overhead.

PERF_EVENT_MMAP2 and build_id

Sysprof now records mmap2 records from Perf while also requesting build_id for executable pages. The goal here is that we would be able to use the build_id to resolve symbols rather than all the process mount namespace and .gnu_debuglink madness. In practice, I haven’t had too much success getting these values but in time I assume that would allow for symbolizing with tools such as debuginfod.

Writing your own Profiler

You can always write your own profiler using libsysprof and get exactly what you want. The API is significantly reduced and cleaned up for GNOME 45.

SysprofProfiler *profiler = sysprof_profiler_new ();
SysprofCaptureWriter *writer = sysprof_capture_writer_new ("capture.syscap", 0);

sysprof_profiler_add_instrument (profiler, sysprof_sampler_new ());
sysprof_profiler_add_instrument (profiler, sysprof_network_usage_new ());
sysprof_profiler_add_instrument (profiler, sysprof_disk_usage_new ());
sysprof_profiler_add_instrument (profiler, sysprof_energy_usage_new ());
sysprof_profiler_add_instrument (profiler, sysprof_power_profile_new ("performance"));

/* If you want to symbolize at end of capture and attach to the capture,
 * use this. It makes your capture more portable for sharing.
 */
sysprof_profiler_add_instrument (profiler, sysprof_symbols_bundle_new ());

sysprof_profiler_record_async (profiler, writer, record_cb, NULL, NULL);

You get the idea.

Writing your own Analyzer

You can also use libsysprof to analyze an existing capture.

SysprofDocumentLoader *loader = sysprof_document_loader_new ("capture.syscap");

/* there is a sensible default symbolizer, but you can even disable it if you
 * know you just want to look at marks/counters/etc.
 */
sysprof_document_loader_set_symbolizer (loader, sysprof_no_symbolizer_get ());

SysprofDocument *document = sysprof_document_loader_load (loader, NULL, &error);

GListModel *counters = sysprof_document_list_counters (document);
GListModel *samples = sysprof_document_list_samples (document);
GListModel *marks = sysprof_document_list_marks (document);

This stuff is all generally fast because at load time we’ve indexed the whole thing into low-cardinality indexes that can be intersected. The SysprofDocument itself is also a GListModel of every data frame in the capture which makes for fun data-binding opportunities.

Thanks for reading and happy performance hacking!

Sysprof and Podman

With the advent of immutable/re-provisional/read-only operating systems like Fedora’s Silverblue, people will be doing a lot more computing inside of containers on their desktops (as if they’re not already).

When you want to profile an entire system with tools like perf this can be problematic because the files that are mapped into memory could be coming from strange places like FUSE. In particular, fuse-overlayfs.

There doesn’t seem to be a good way to decode all this indirection which means in Sysprof, we’ve had broken ELF symbol decoding for your things running inside of podman containers (such as Fedora’s toolbox). For those of us who have to develop inside those containers, that can really be a drag.

The problem at the core is that Sysprof (and presumably other perf-based tooling) would think a file was mapped from somewhere like /usr/lib64/libglib-2.0.so according to the /proc/$pid/maps. Usually we translate that using /proc/$pid/mountinfo to the real mount or subvolume. But if fuse-overlayfs is in the picture, you don’t get any insight into that. When symbols are decoded, it looks at the host’s /usr/lib/libglib-2.0.so and finds an inode mismatch at which point it will stop trying to decode the instruction address.

But since we still have a limited number of container technologies to deal with today, we can just cheat. If we look at /proc/$pid/cgroup we can extract the libpod container identifier and use that to peek at ~/.local/share/containers/storage/overlay-containers/containers.json to get the overlayfs layer. With that, we can find the actual root for the container which might be something like ~/.local/share/containers/storage/overlay/$layer/diff.

It’s a nasty amount of indirection, and it’s brittle because it only works for the current user, but at least it means we can keep improving GNOME even if we have to do development in containers.

Obligatory screenshot of turtles. gtk4-demo running in jhbuild running in Fedora toolbox (podman) with a Fedora 34 image which uses fuse-overlayfs for file access within the container. Sysprof now can discover this and decode symbols appropriately alongside the rest of the system. Now if only we could get distributions to give up on omitting frame pointers everywhere just so their unjustifiable database benchmarks go up and to the right a pixel.

How to use Sysprof to… Part II

In the previous article of this series we covered Sysprof basics to help you use the tooling. Now I want to take a moment to show you how to use the command line tooling to profile systems like GNOME Shell.

Record an existing session

The easiest way to get started is to record your existing GNOME Shell session. With sysprof-cli, you can use the --gnome-shell option and it will attempt to connect to your active GNOME Shell instance over D-Bus to stream COGL pipeline information over a private file-descriptor.

This information can be combined with callgraphs to see what is happening during the duration of a COGL mark.

The details page can also provide some quick overview information about the marks and their duration. You will find this helpful when comparing patches to see if they really improved things over time.

The details button in the top right will show you information about marks and their min/max/avg duration.

Basic Shell Recording

Running something like a desktop session is complex. You have a D-Bus daemon, a compositor, series of background daemons, settings infrastructure, and programs saving to your home directory. For this reason you cannot really run two of them for the same user at the same time, or even nested.

Because of this, it is handy to log out of your desktop session and switch to a VT to profile GNOME Shell. Sysprof provides a sysprof-cli binary you can use to profile in complicated setups like this.
Start by switching to another VT like Control+Shift+3. I recommend stopping the current display server just so that it doesn’t get in the way of profiling, but usually it’s okay to not. Then we can enter our JHBuild environment with a new D-Bus session before we start Sysprof and GNOME Shell.

Fedora 32 (Workstation Edition)
Kernel 5.6.0-0.rc4.git0.1.fc32.x86_64 (tty3)

startdust login: christian
Password: 
$ sudo service gdm stop
$ dbus-run-session jhbuild shell
$ 

At this point, we can spawn GNOME Shell with Sysprof to start recording.

You can use -- to specify the command you want sysprof-cli to execute while it records. When that application exits, sysprof-cli will extract all the known symbols and finish it’s recording.

I want to mention briefly that the --gnome-shell option only works with an existing GNOME session. I hope to fix that in the near future though.

$ sysprof-cli -- gnome-shell --wayland --display-server

At this point, GNOME Shell will have spawned and you can exercise it to exhibit the behavior you’d like to improve. When done, open a terminal window to kill GNOME shell so that the profiler can clean up.

kill -9 $(pidof gnome-shell) seems to work well for me

Now you’ll have a capture.syscap file in your current directory. Open that up with Sysprof to view the contents of your profiling session. Often I just spawn gnome-shell directly to open the syscap file and explore.

Recording JavaScript stacks

Sometimes you want to profile JavaScript instead of the C code from Shell, Mutter, and friends. To do this, use the --gjs command line option. Currently, this can give mixed results if you also sample callstacks with the Linux perf support, as the timings are not guaranteed to be equivalent. My recommendation is to disable perf when sampling JavaScript using the --no-perf option.

$ sysprof-cli --gjs --no-perf -- gnome-shell --wayland --display-server

Now when you open the callgraph in Sysprof, you’ll see JavaScript samples.

JavaScrpt callgraph example

Recording Energy Consumption

On Linux, we have support for tracking energy usage as “Rolling Average Power Limit” or RAPL for short. Sysprof can include this information for you in your capture if you have the turbostat utility available. It provides power information per “package” such as the GPU and CPU.

Keeping power consumption low is an important part of a modern desktop that aims to be useful on laptops and smaller form factors. It’s useful to check in now and again to ensure that we’re keeping things tip top.

$ sysprof-cli --rapl --no-perf -- gnome-shell --wayland --display-server

You might want to disable sampling while testing power consumption because that could have a larger effect in terms of wattage than the thing you’re profiling.

Don’t forget to check the counter and energy menus for additional graphs.

Reducing Memory Allocations

Plugging memory leaks is a great thing to do. But sometimes it’s better to never allocate things to begin with. The --memprof option can help you find extraneous allocations in your program. For example, I tested the --memprof option on GNOME Shell when writing it and immediately found a way to reduce temporary allocations by hundreds of MiB per minute of use.

$ sysprof-cli --memprof -- gnome-shell --wayland --display-server

Avoiding Main Loop Stalls

This one requires you to build Sysprof until our next release, but you can use the --speedtrack option to find things running on your main loop that may not be a good idea. It will also insert marks for how long the main loop iterations run to find periods of time that you aren’t staying interactive.

$ sysprof-cli --speedtrack -- gnome-shell --wayland --display-server

Anyway, that does it for now! Hope you found this brain dump insightful enough to help us all push forward on the performance curve.