Unfortunately I couldn’t be at GUADEC this year, but that wont stop me from demoing new things!
I’ve been doing a lot of work on Sysprof now that we have semi-reliable frame unwinding on Fedora, Silverblue and GNOME OS. When I have tolling that works on the OS it makes it a lot easier to build profilers and make them useful.
Additionally, we’re at a good point in GTK 4 where you can do really powerful things if you design your data models correctly. So this cycle I’ve spent time redesigning how we record and process our captured data.
There is certainly more work to be done, but the big strokes of the new design are in place. It could really use the benefit of another person joining in to help polish various bits of the apps like scales and legends.
For 45 I decided to remove the tabbed interface and Builder will now just open captures with Sysprof directly. It’s too cumbersome to try to shove all this information into a single view widget just so I can embed it in Builder.
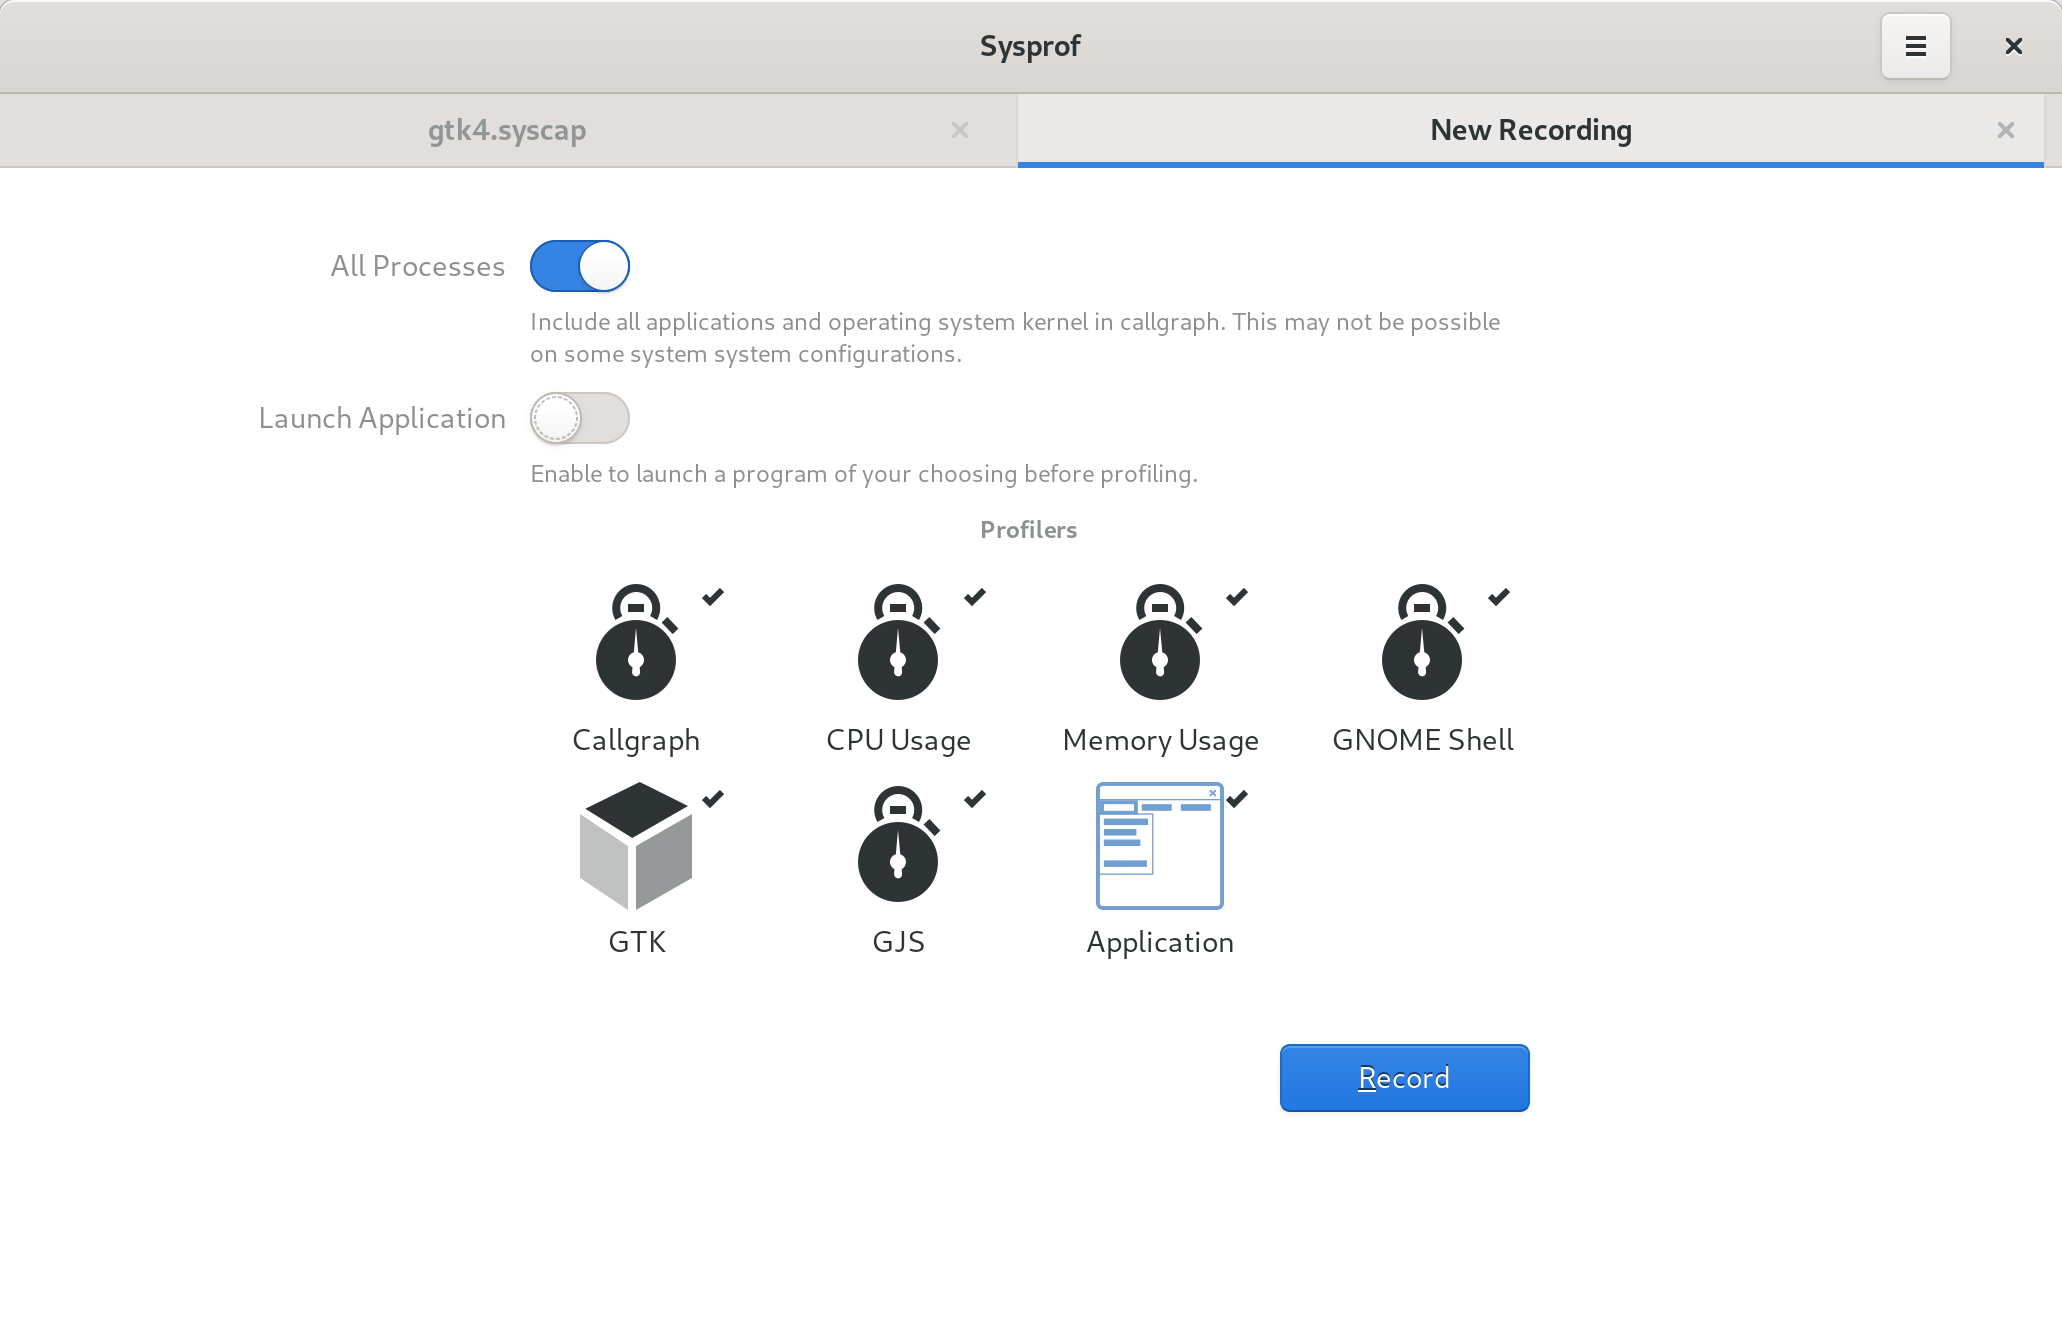
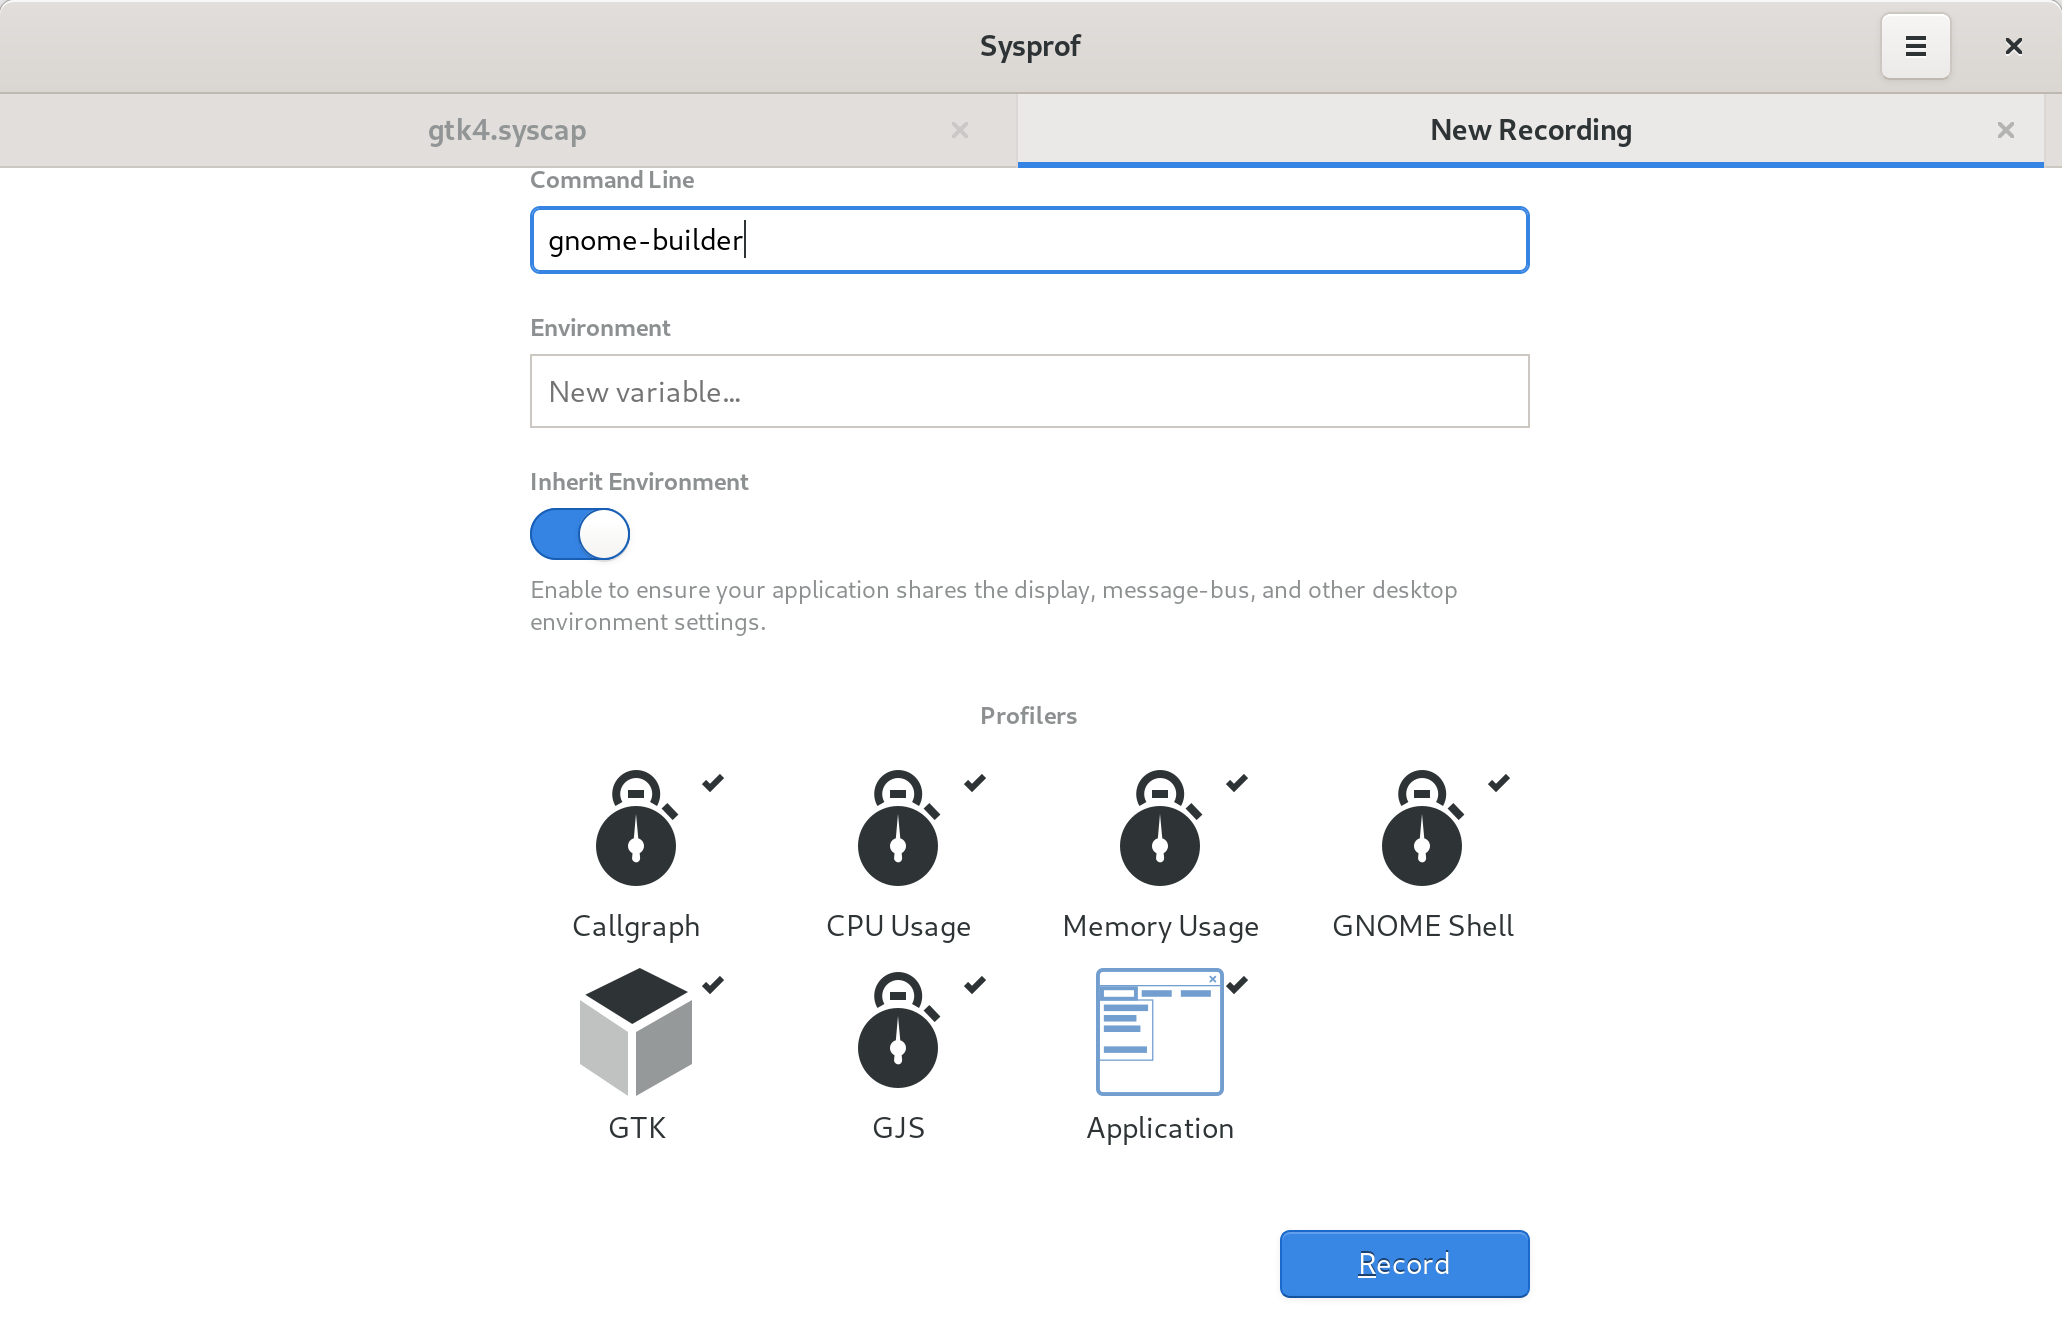
Greeter
The first thing you’ll see is a new greeter. It still has a bit more to finish but my primary goal was to elevate how things work. That was something lacking with just icons like we had previously.
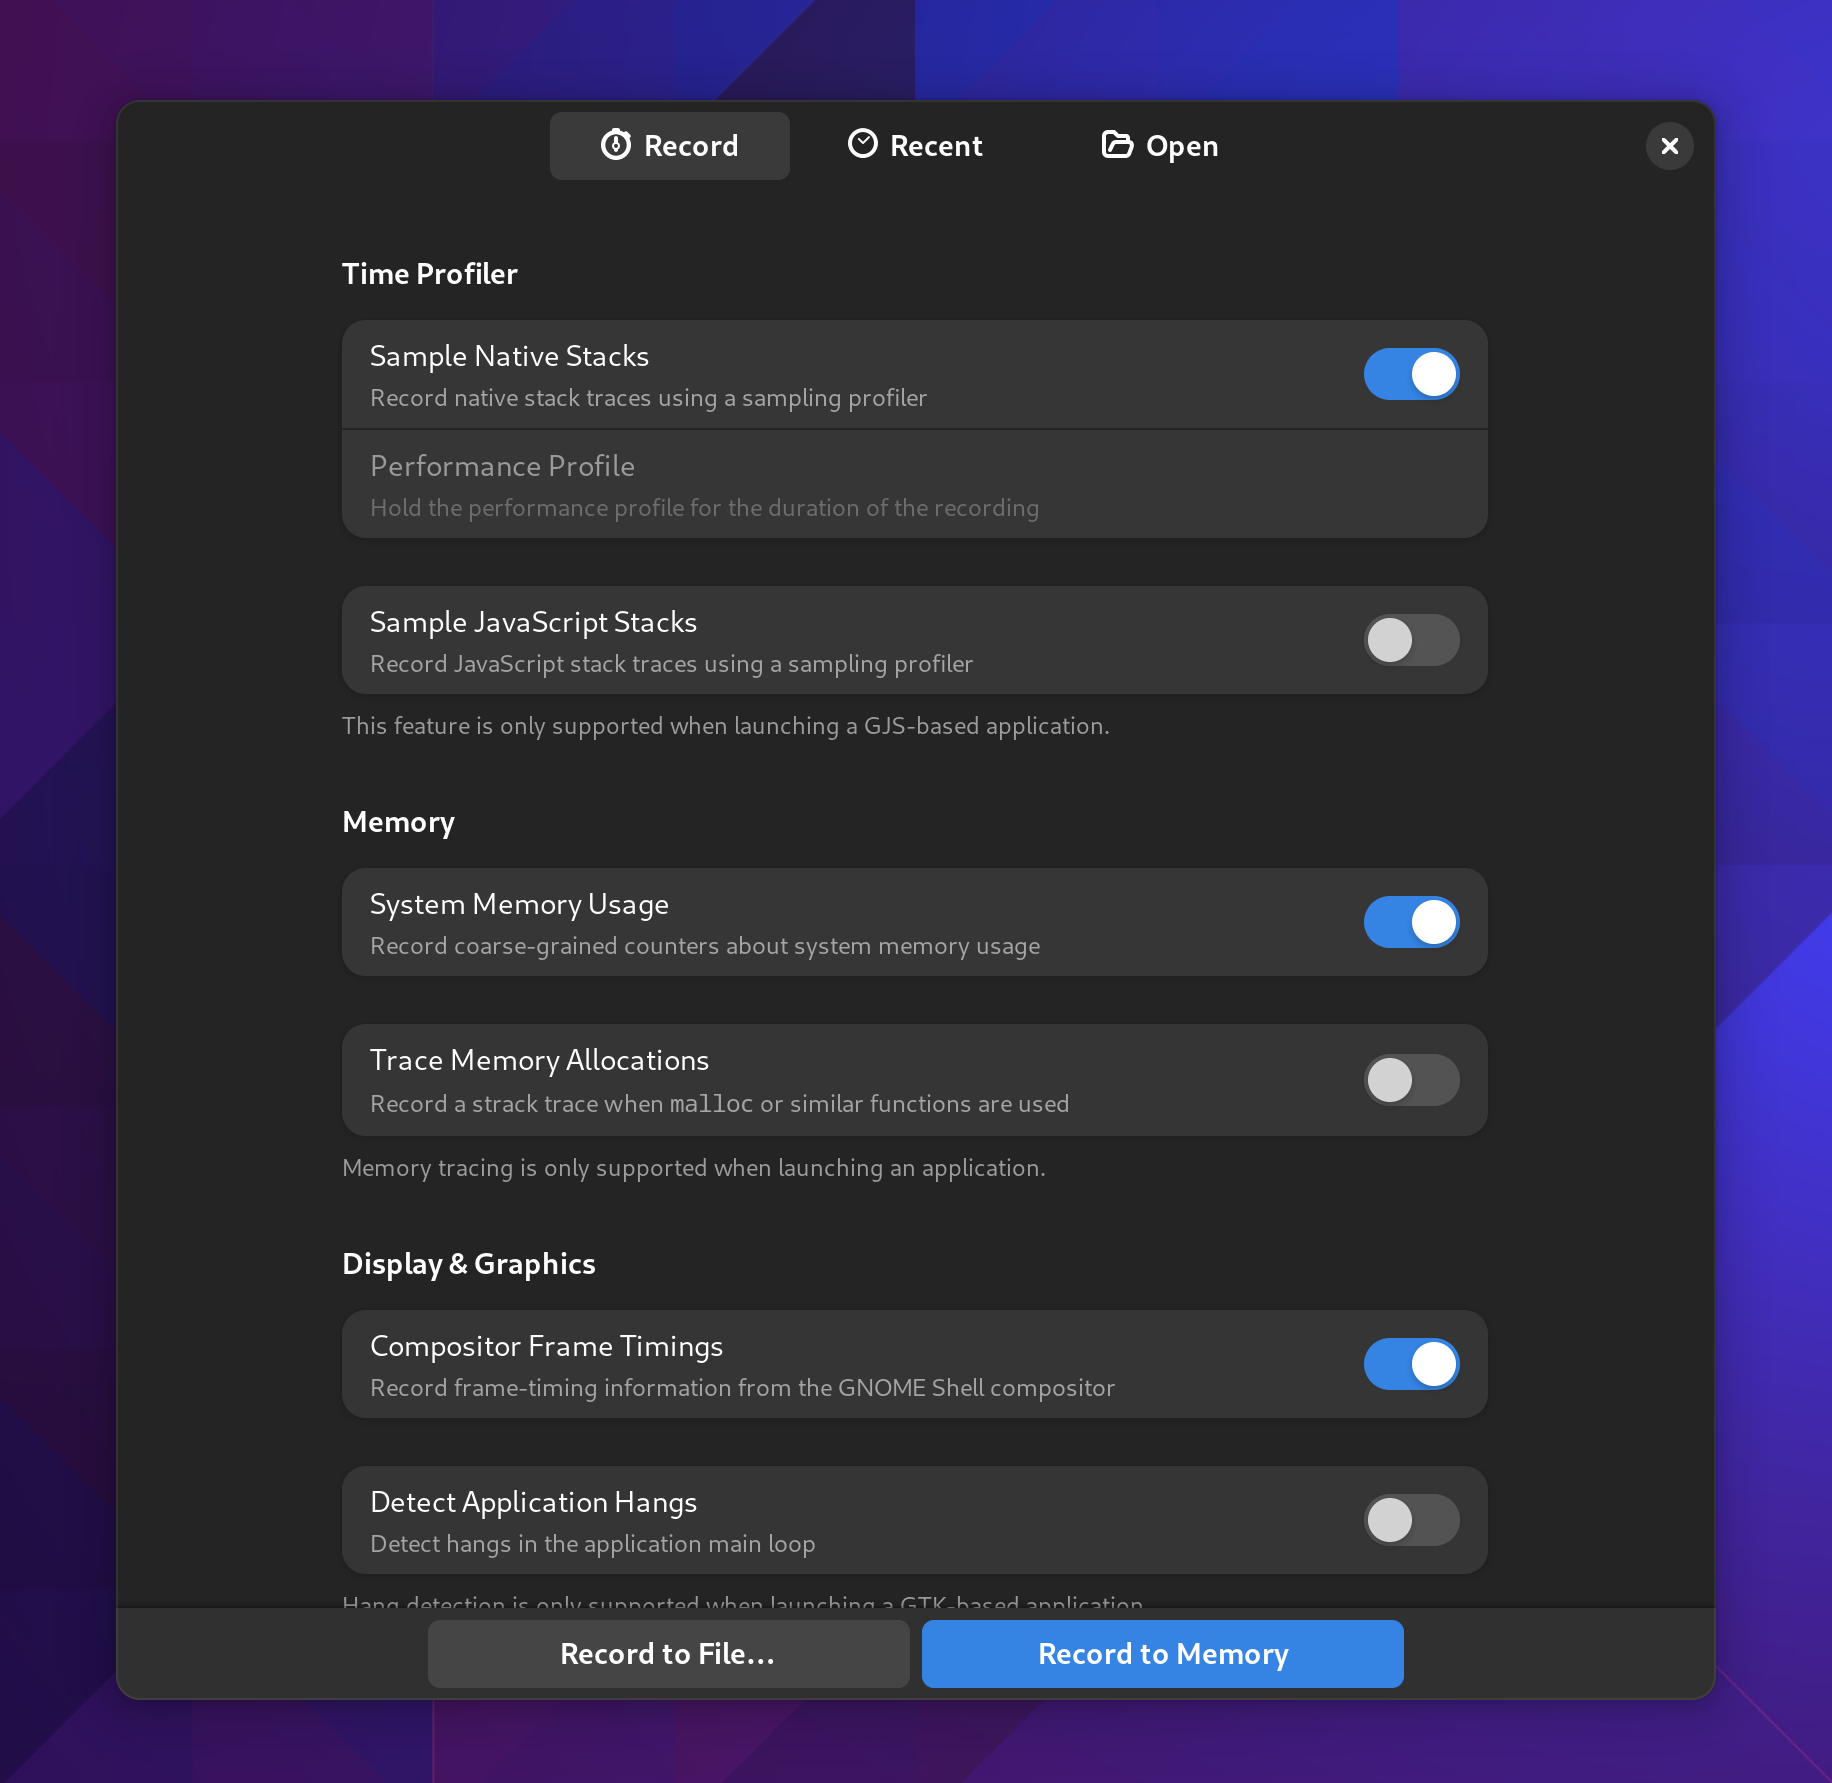
You’ll also notice you can capture either to disk or to memory. Depending on your situation that may be of use. For example, if you’re testing under memory pressure, creating an unbounded memfd may not be what you want. Instead you can capture to disk and the capture will periodically flush when the buffer is full.
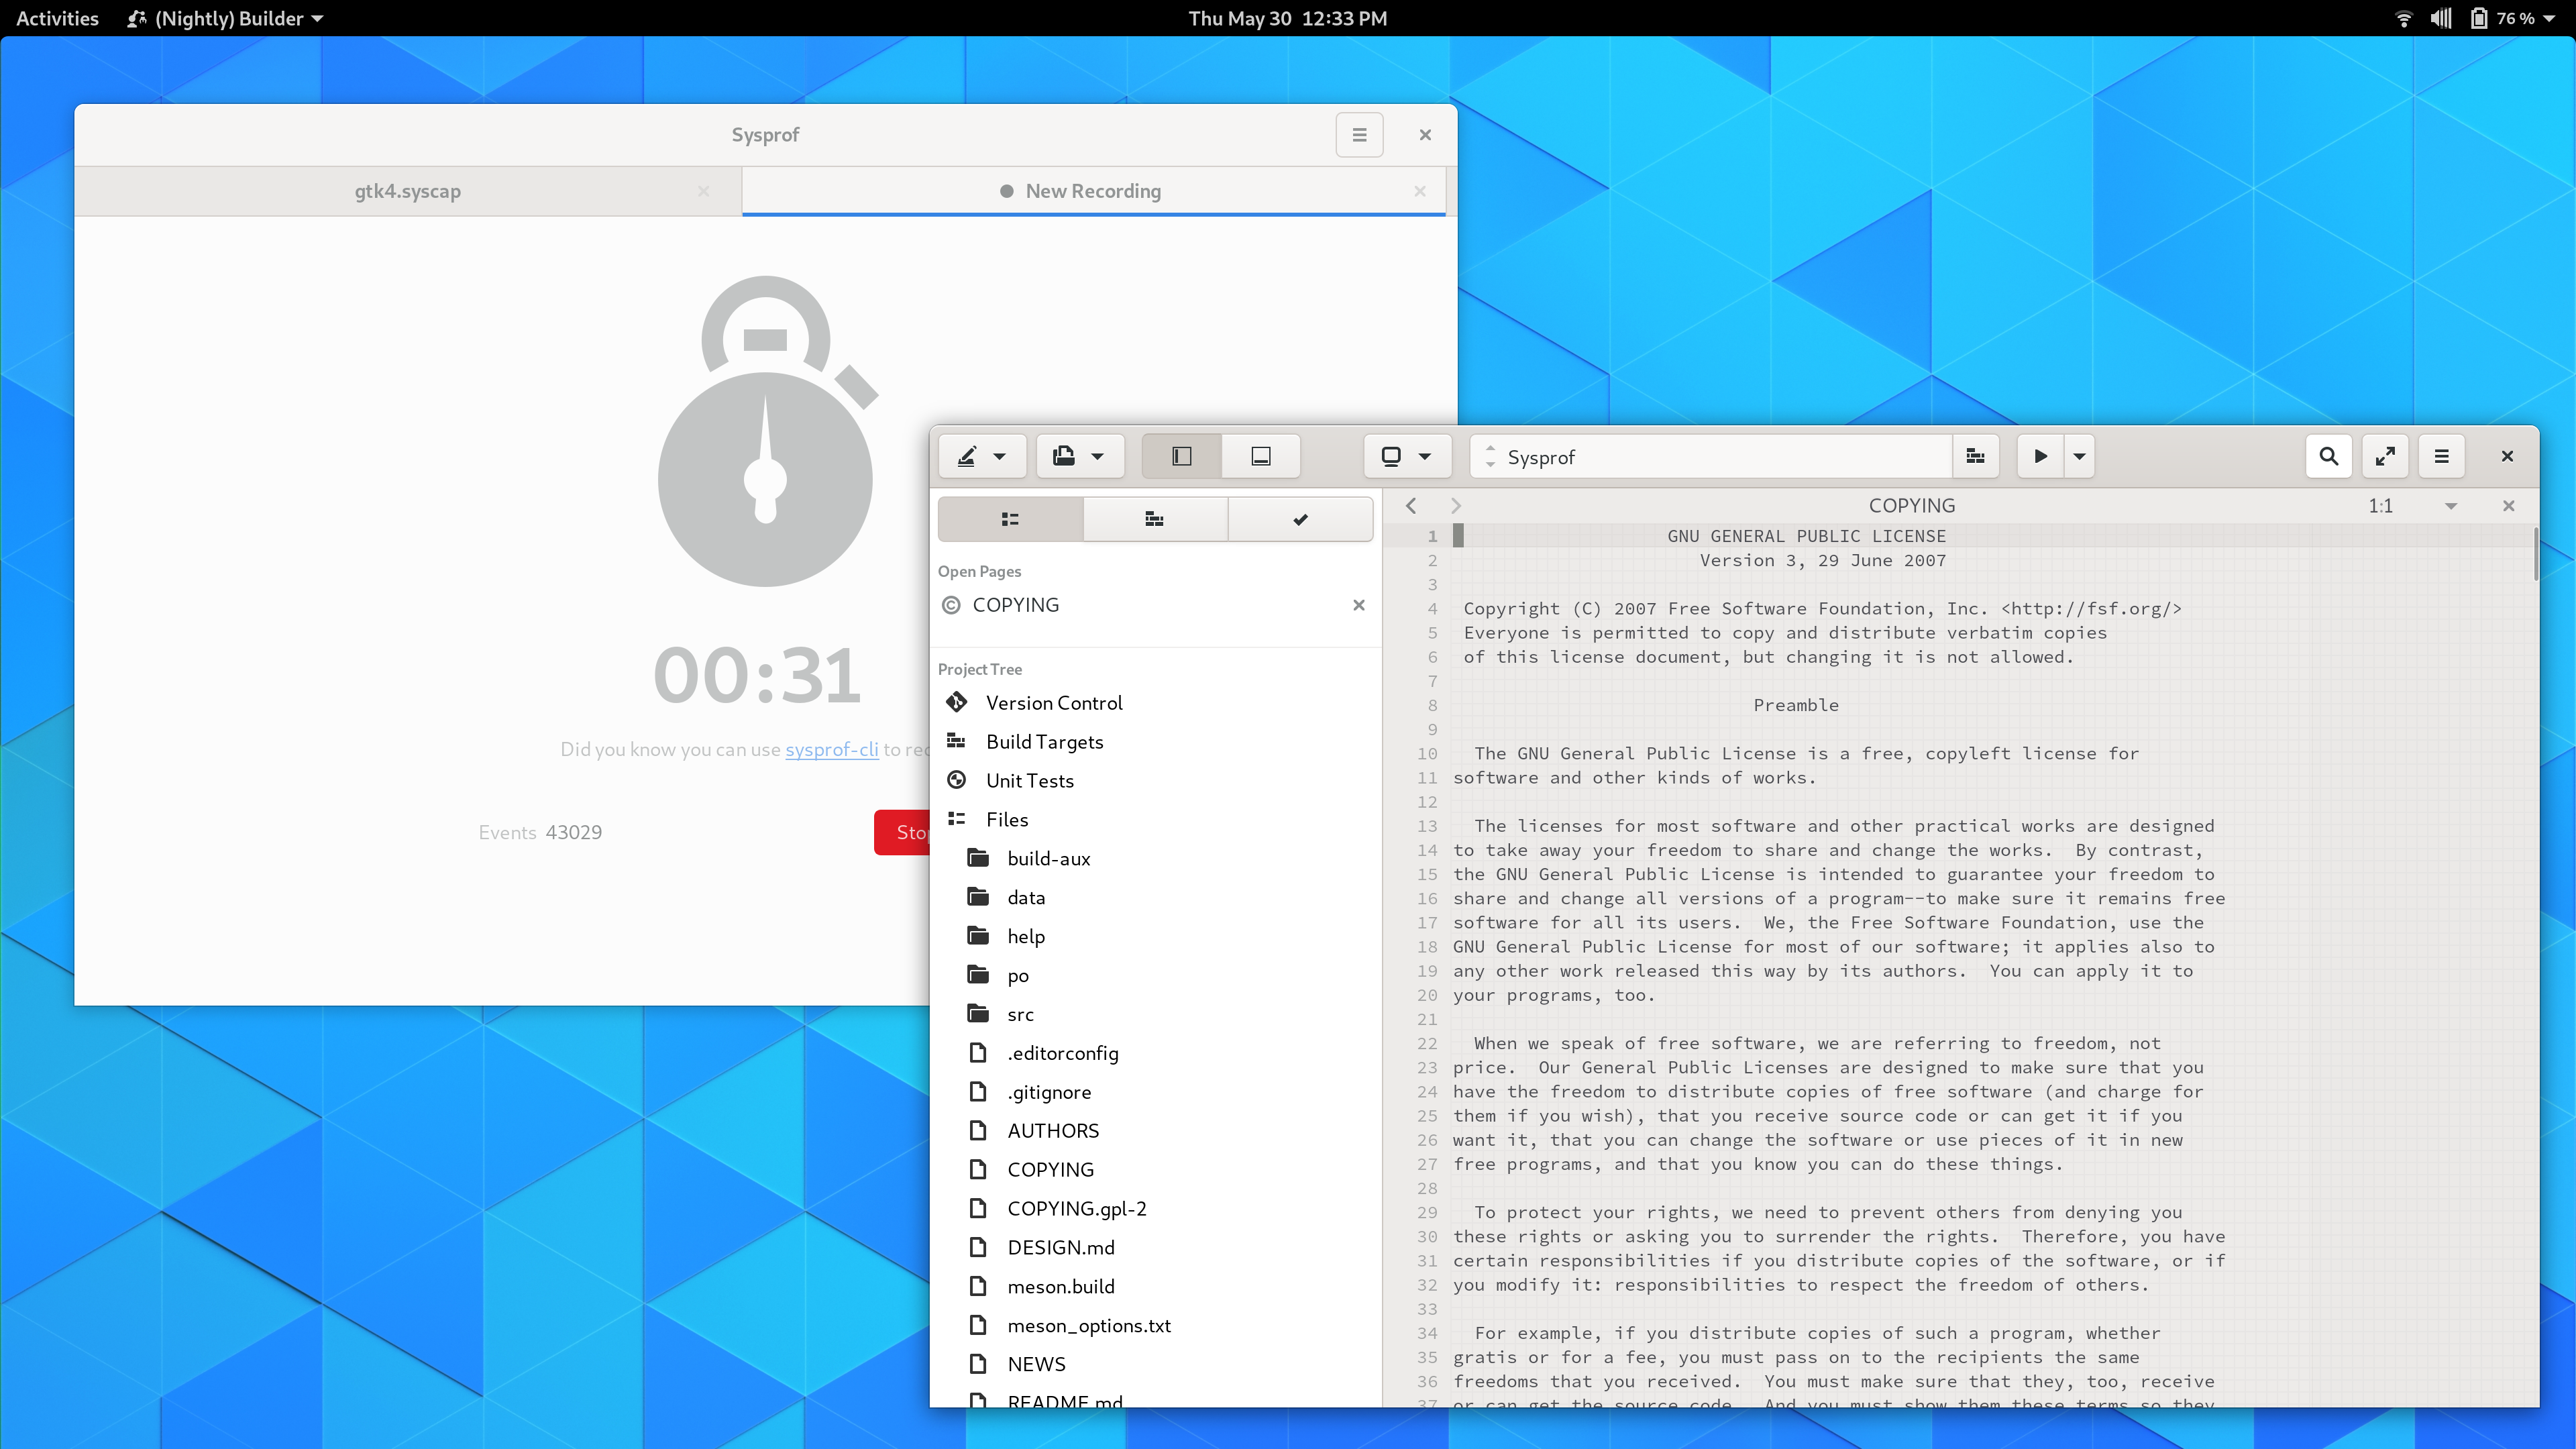
Recording Pad
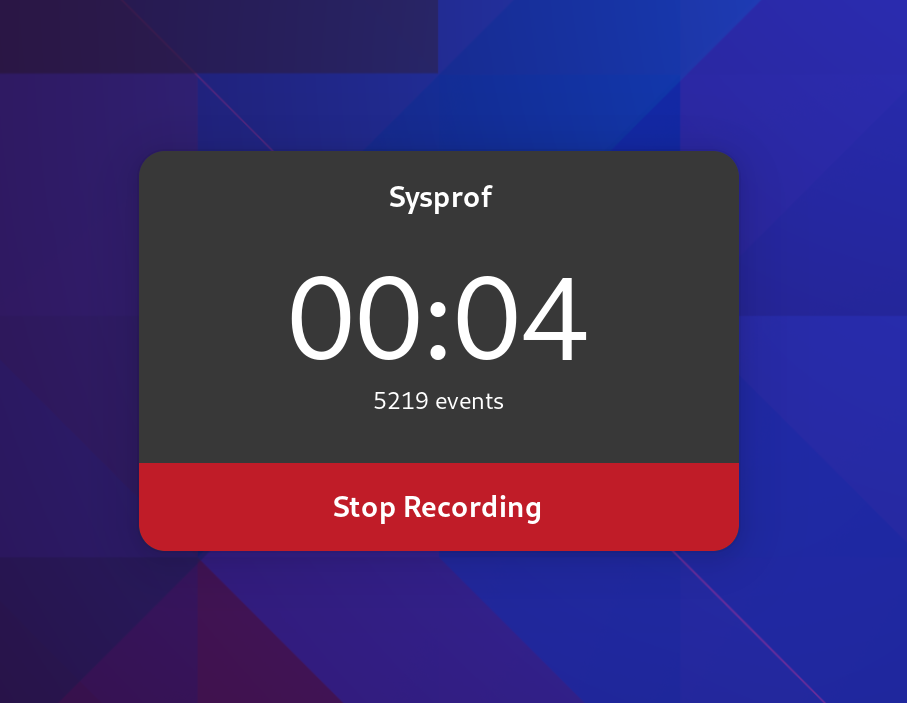
While recording, Sysprof now creates a much smaller recording pad that you can use to stop the recording. The goal here is to further reduce overhead created by Sysprof itself. It still updates once per second to give you an idea of how many data frames have been recorded to the capture.
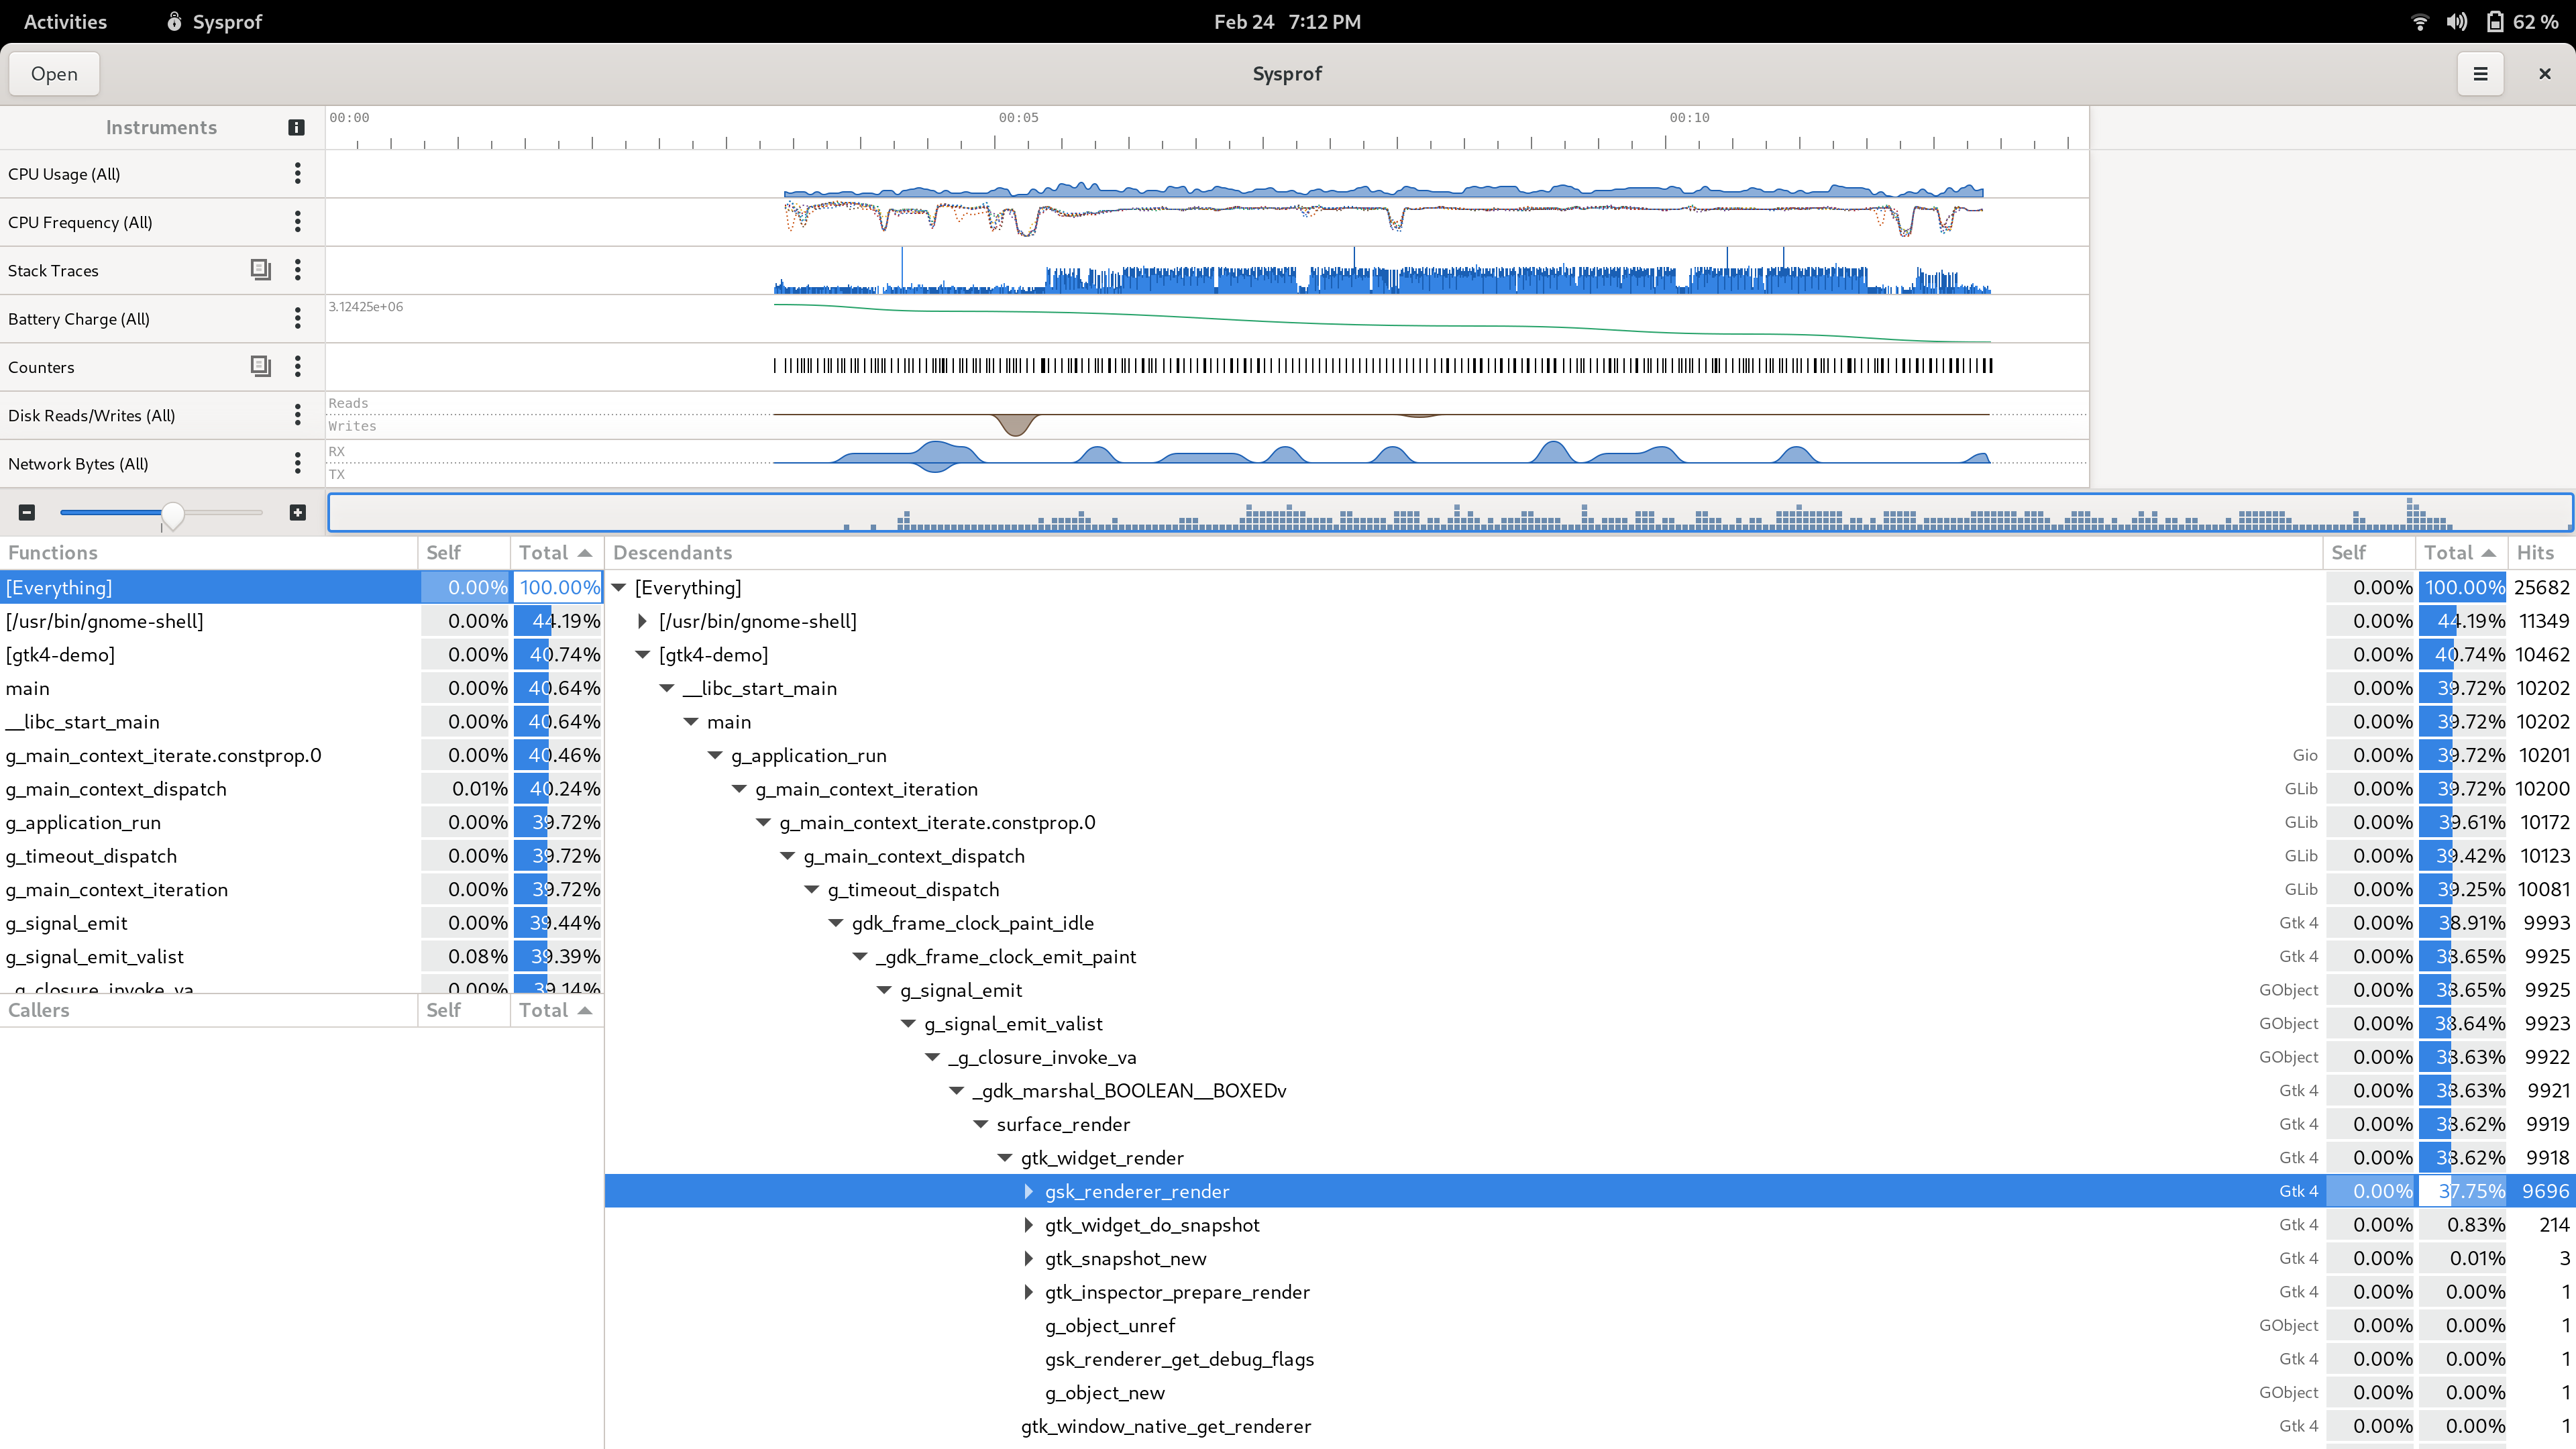
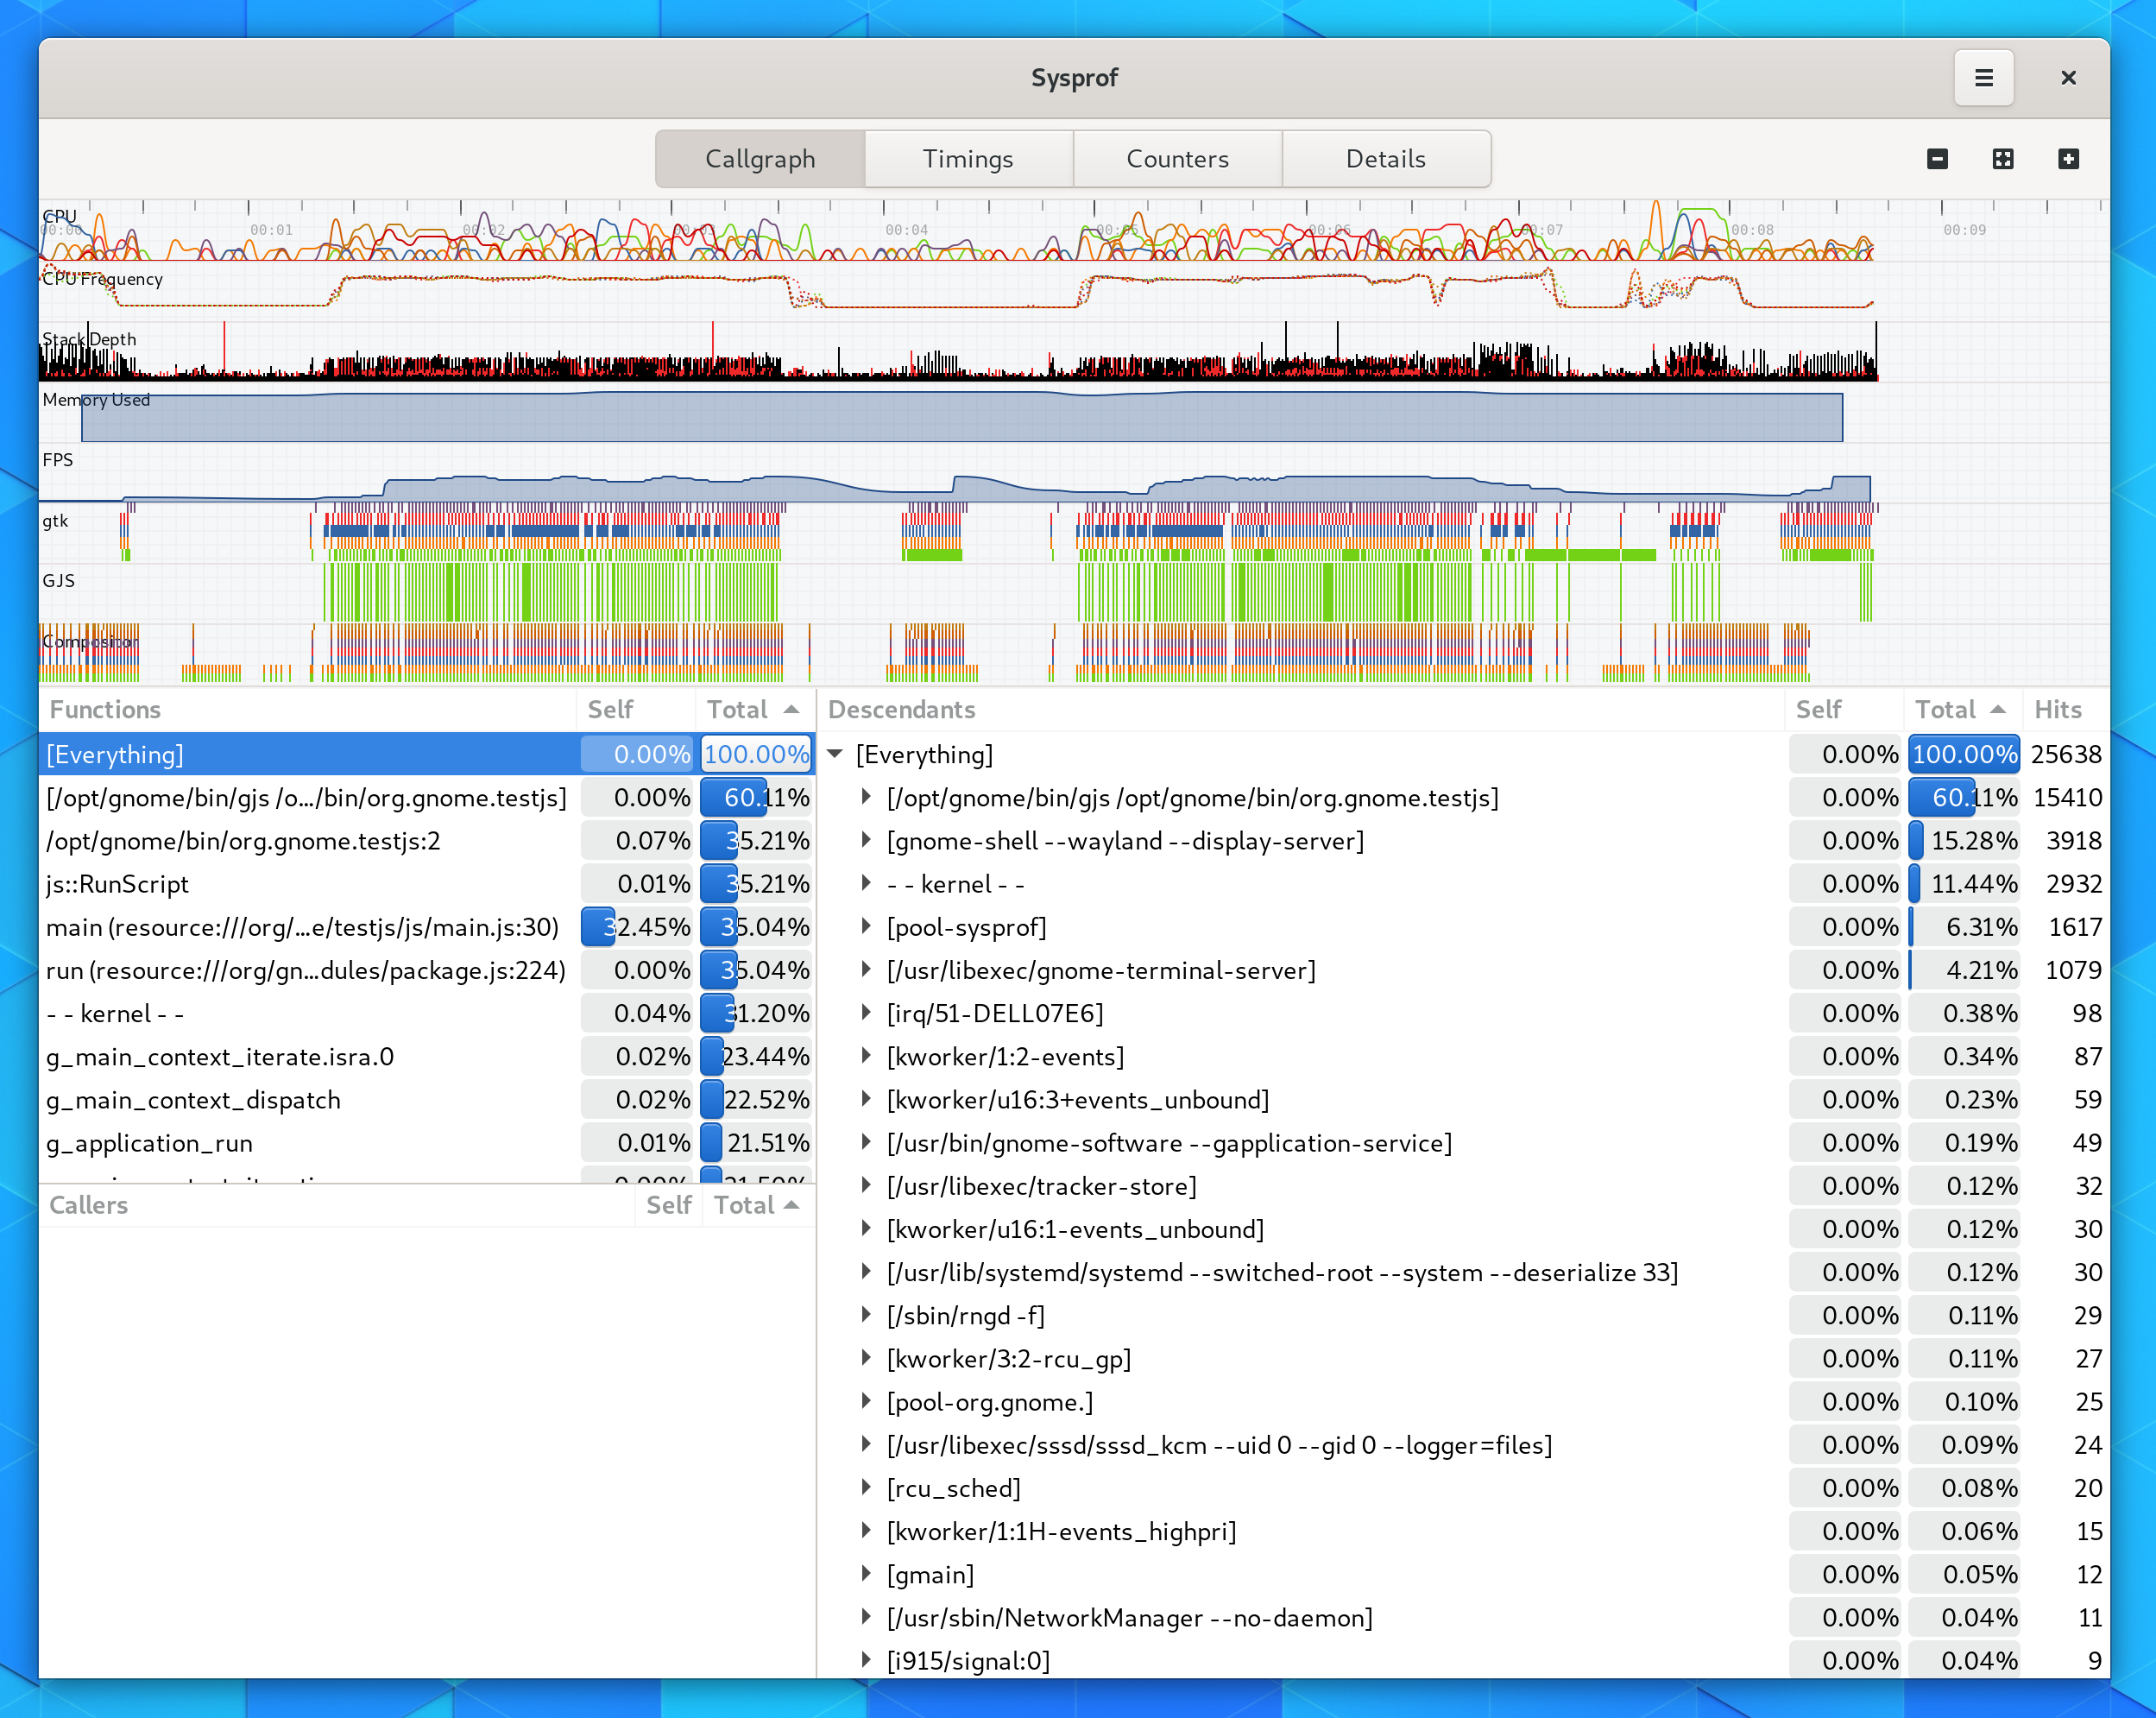
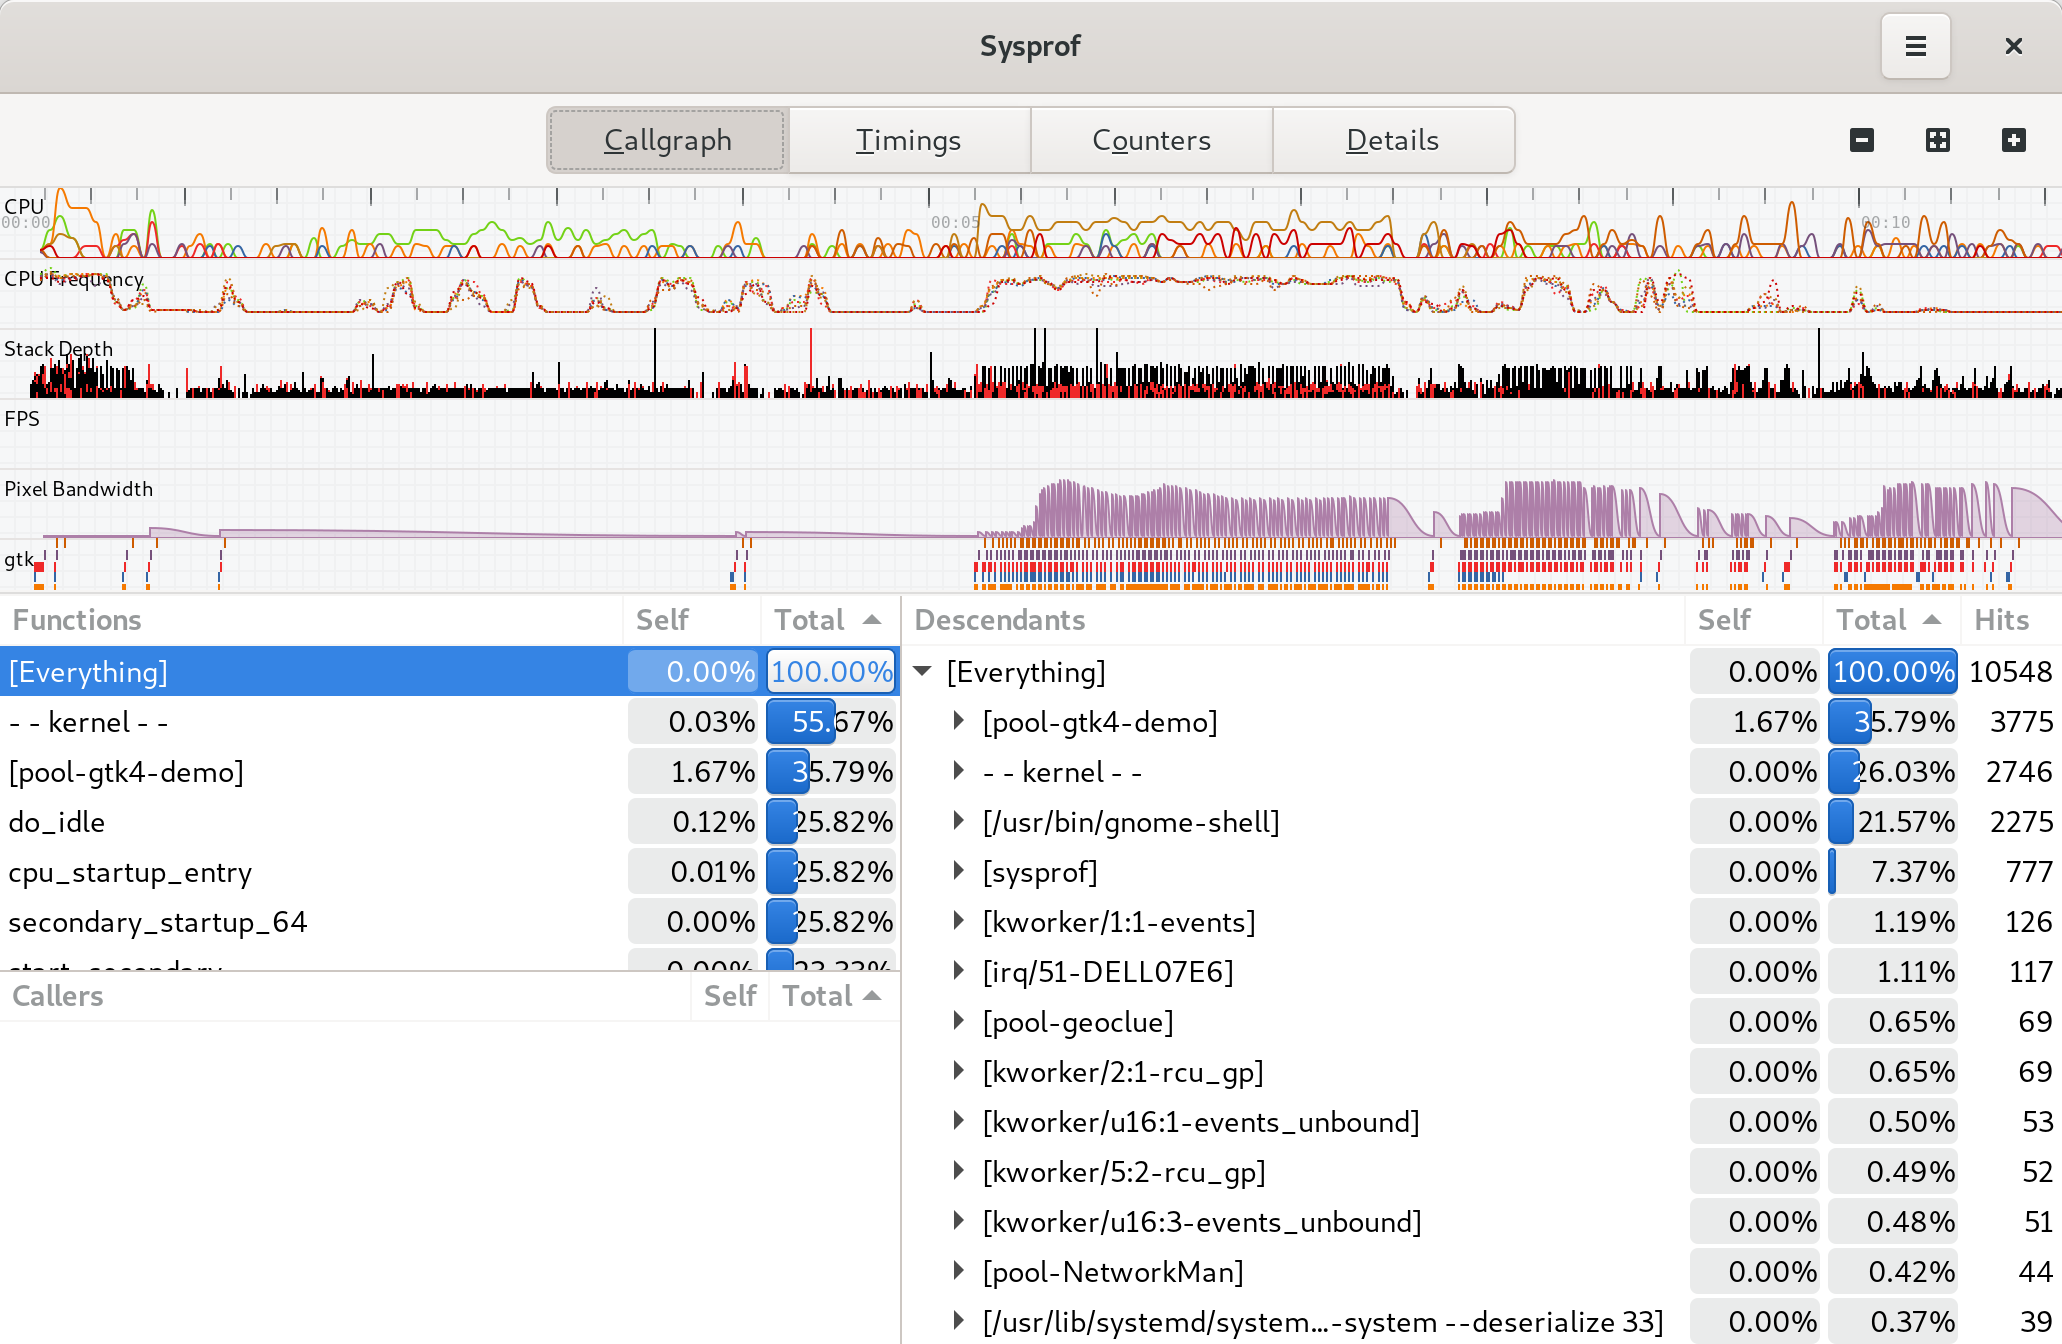
Exploring Captures
After capturing your system, you’ll be presented with a window to explore the capture.
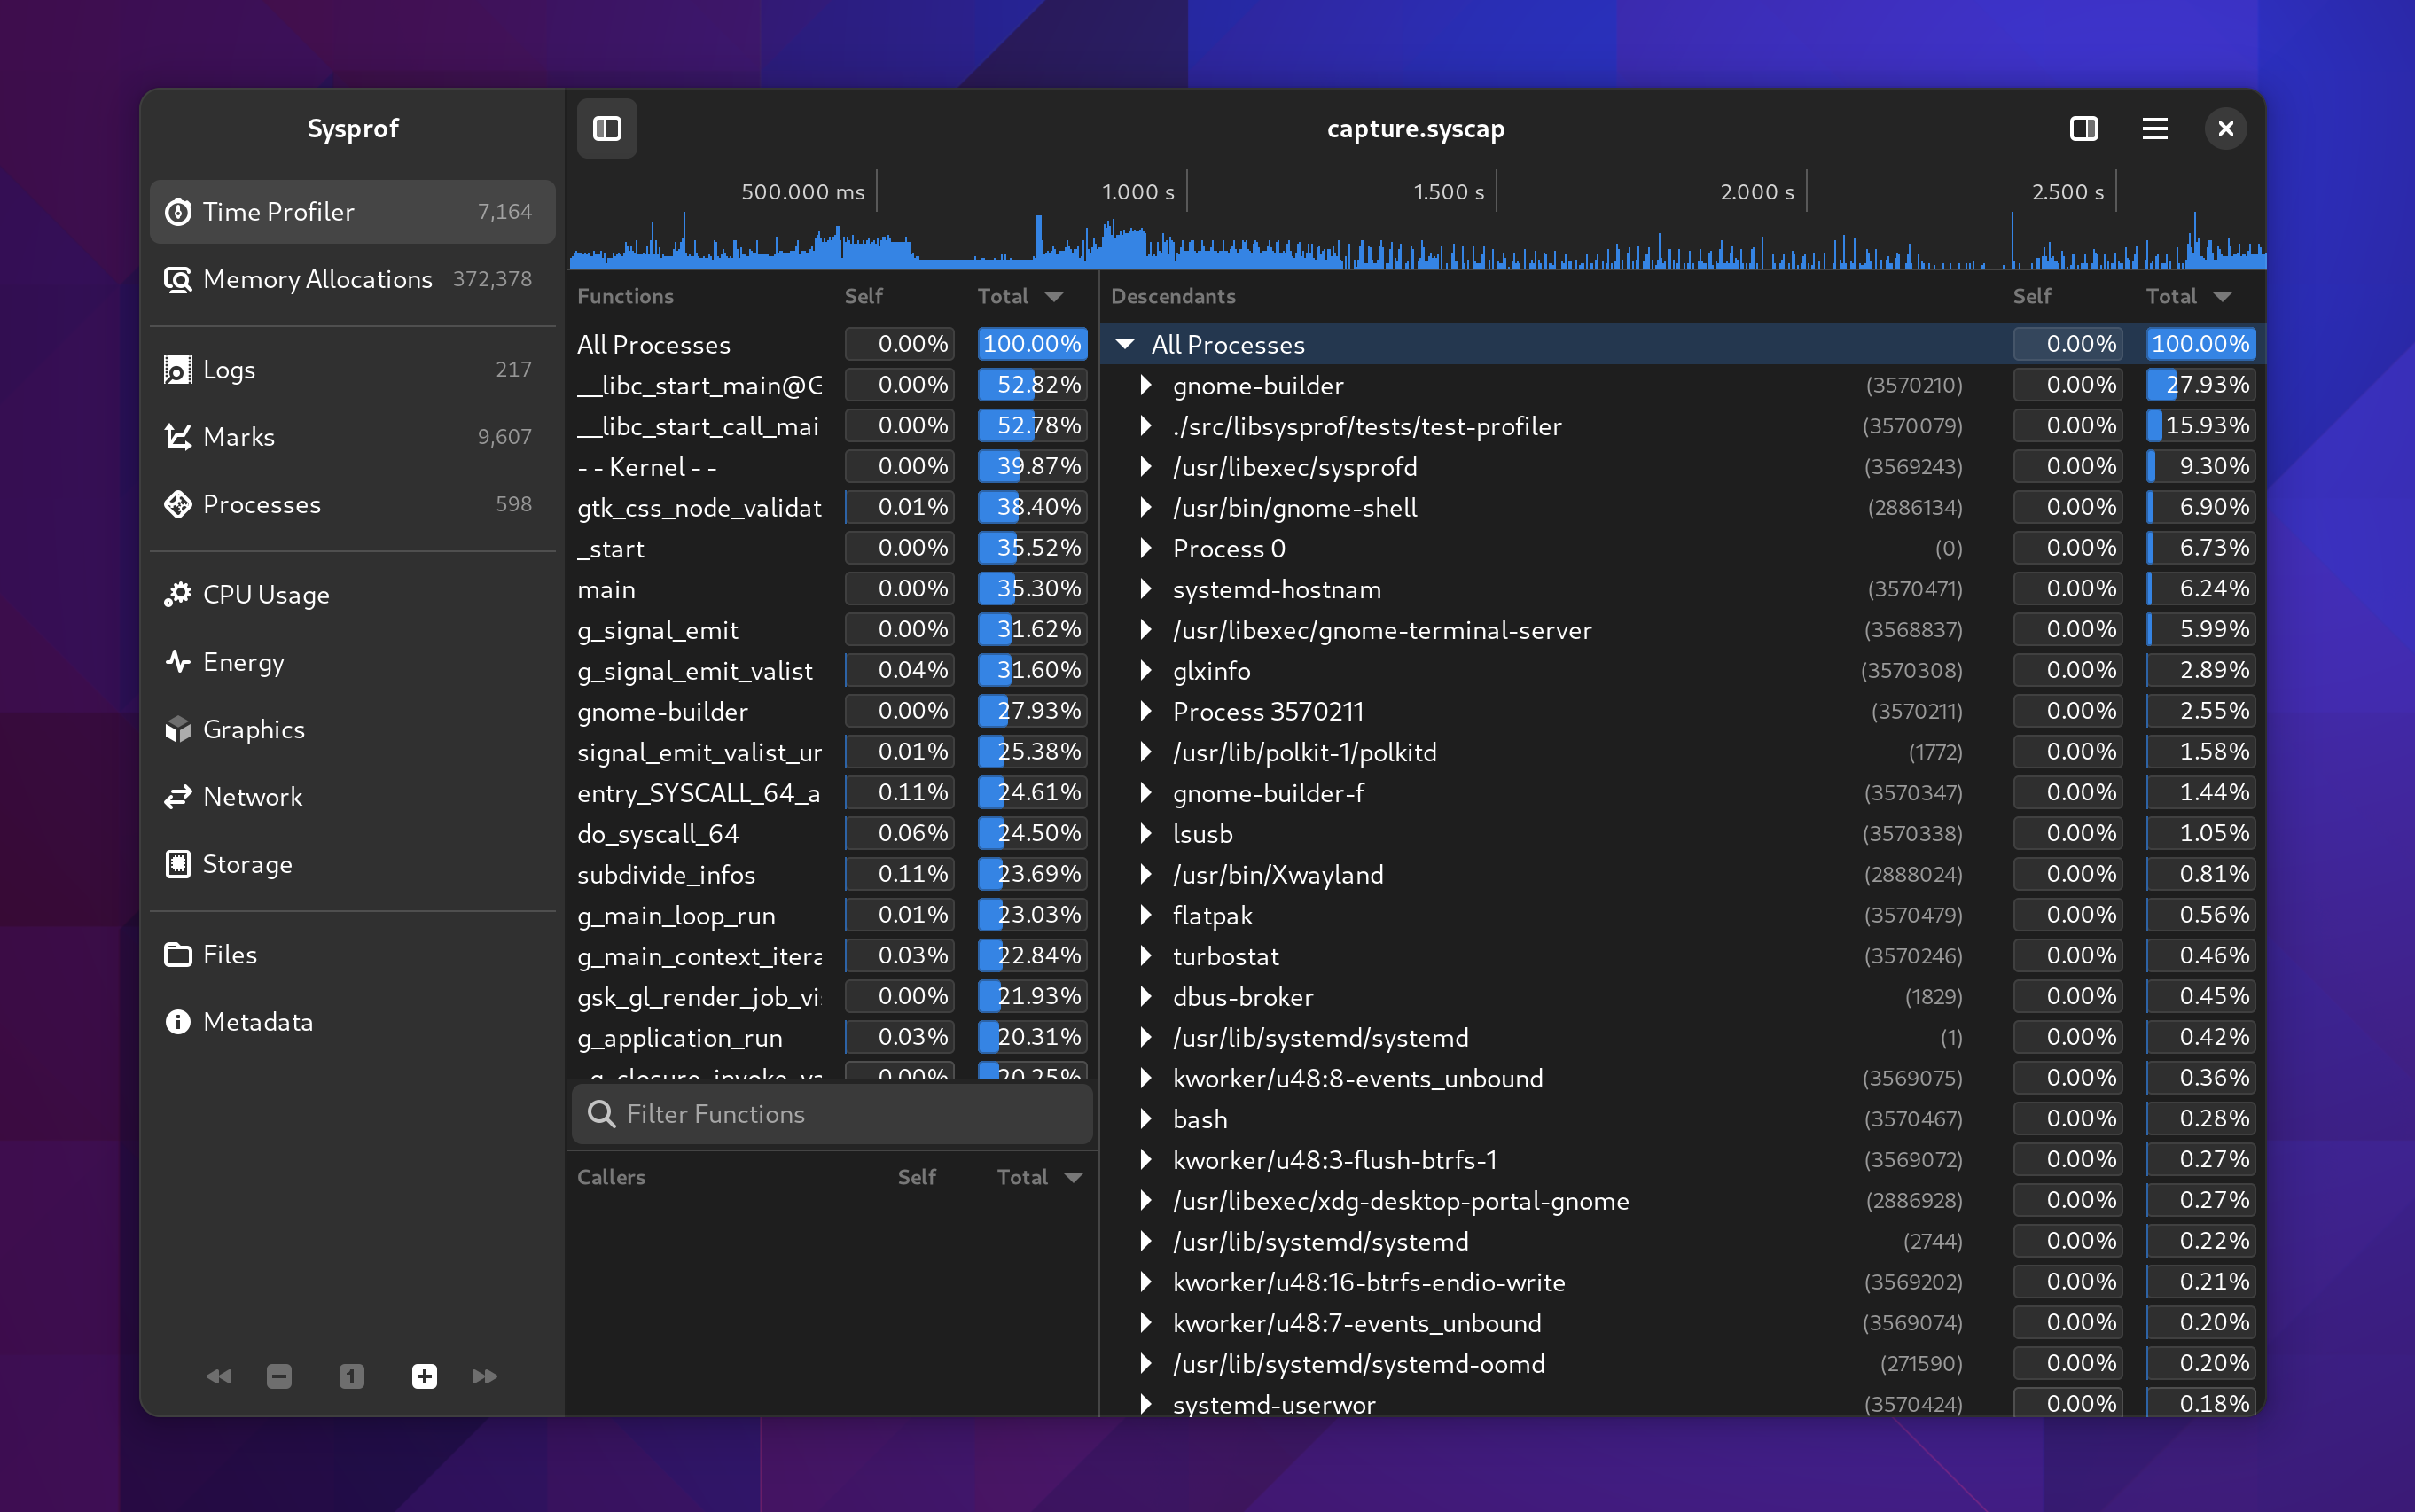
Things were getting pretty cramped before, so the new sections in the sidebar make it easier for us to put related information together in a way that is understandable.
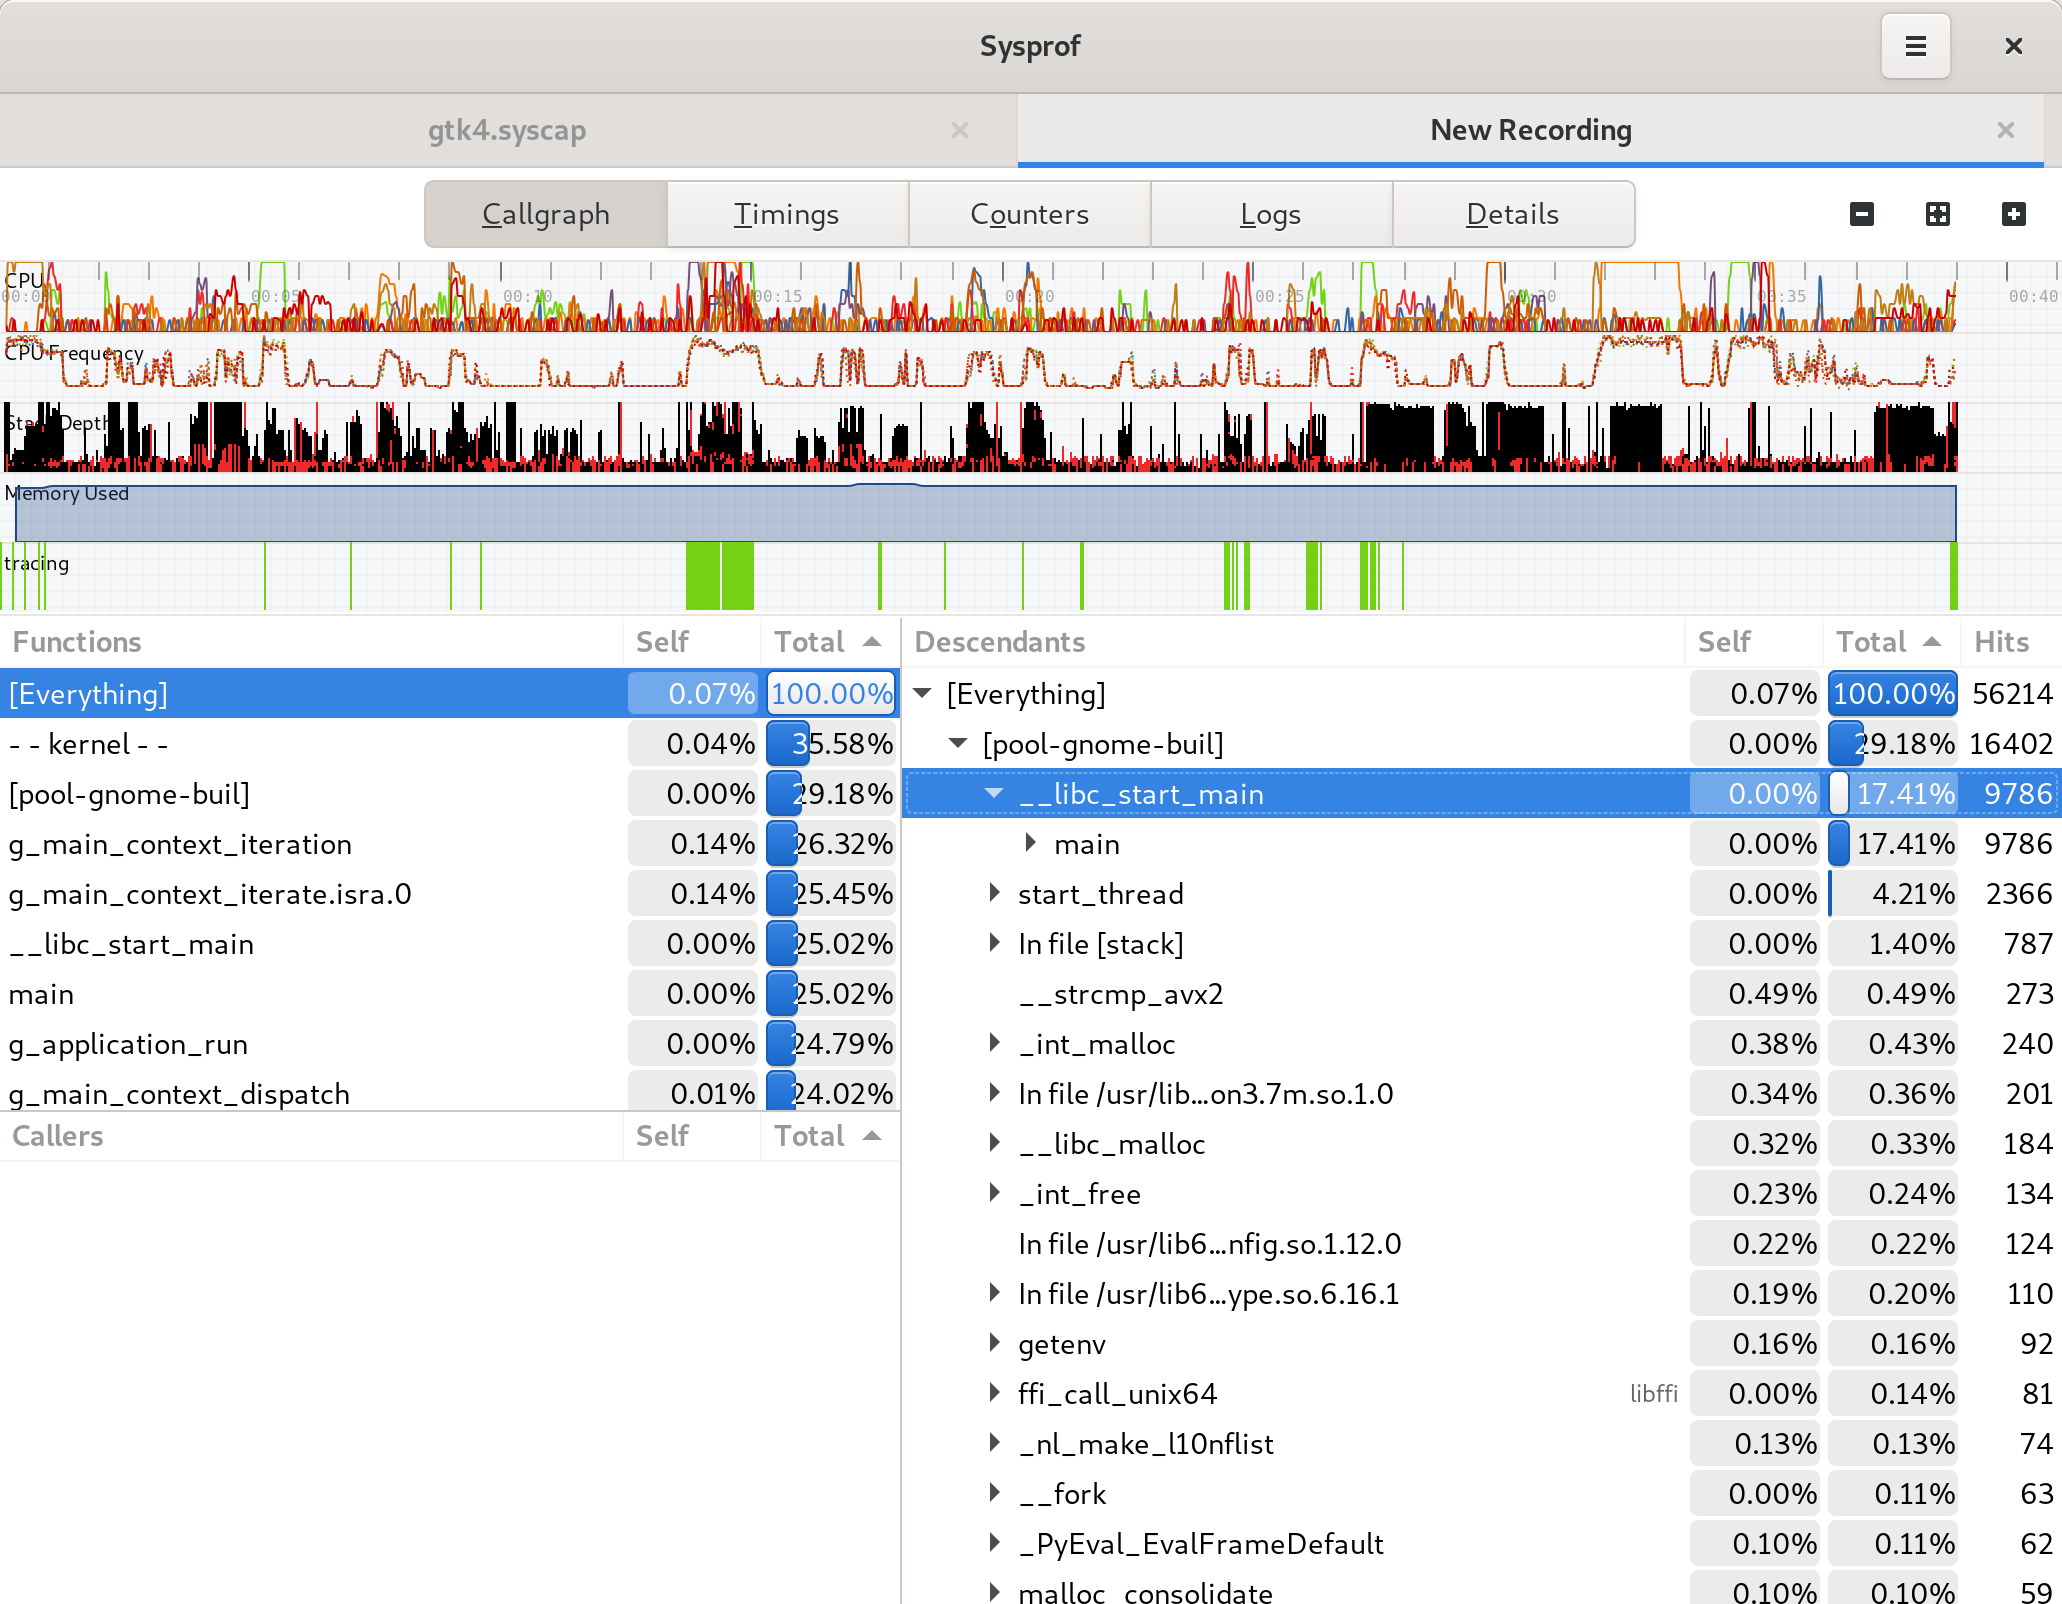
I tried very hard to keep the callgraph in the three-section format we’ve used for many years. However, it has a nice filter now on the functions list thanks to GtkFilterListModel making it so easy.
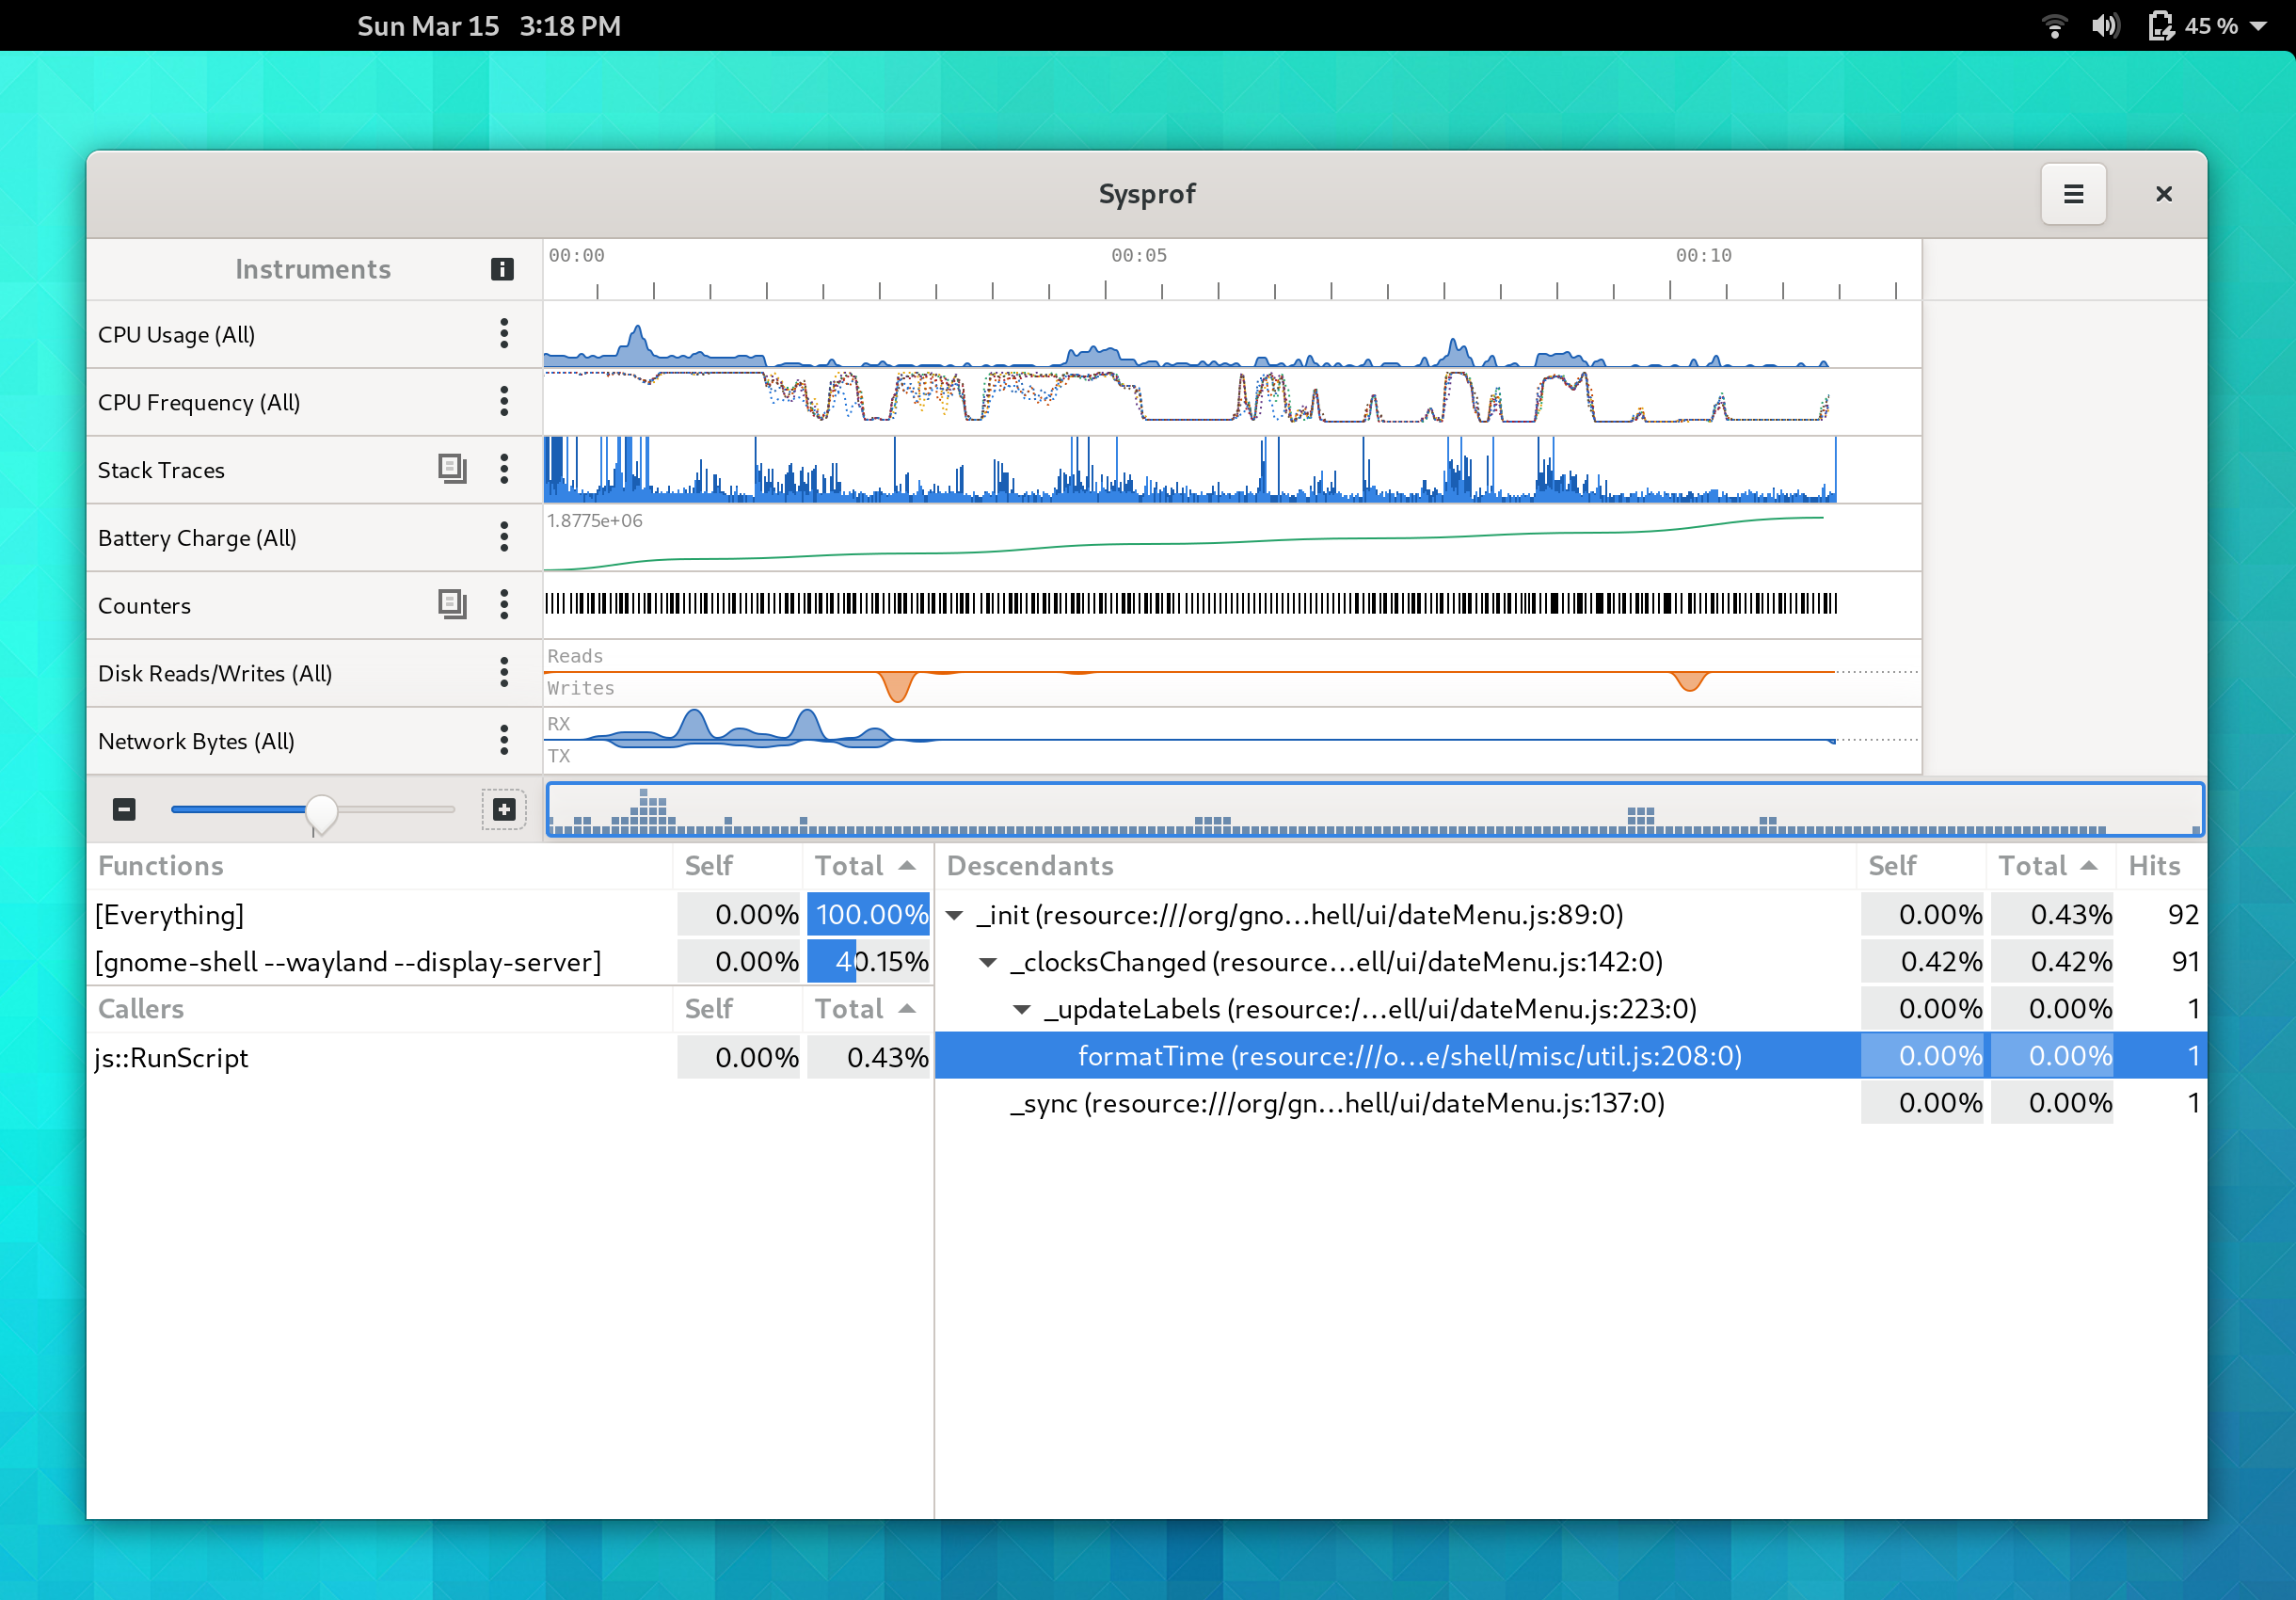
Selecting Time Spans
Many parts of the window will automatically filter themselves based on the selected time span. Use the charts at the top of the window to select time ranges that are interesting. You can use the controls in the sidebar to navigate the capture as well.
You can click the + icon within the selection to zoom into that range.
Callgraph Options
There are a number of new callgraph options you can toggle.
- Categorized Frames
- Hide System Libraries
- Include Threads
- Bottom Up
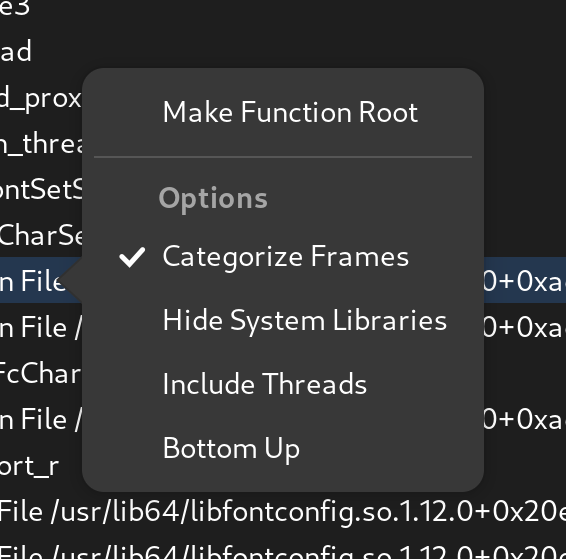
They are all pretty standard things in a profiler so I don’t need to dwell on them much. But having a “Bottom Up” option means we have some help when you run into truncated stack traces and still want to get an idea of what’s going on by function fragments. The new “Include Threads” option lets you break up your callgraph by one more level, the thread that was running.
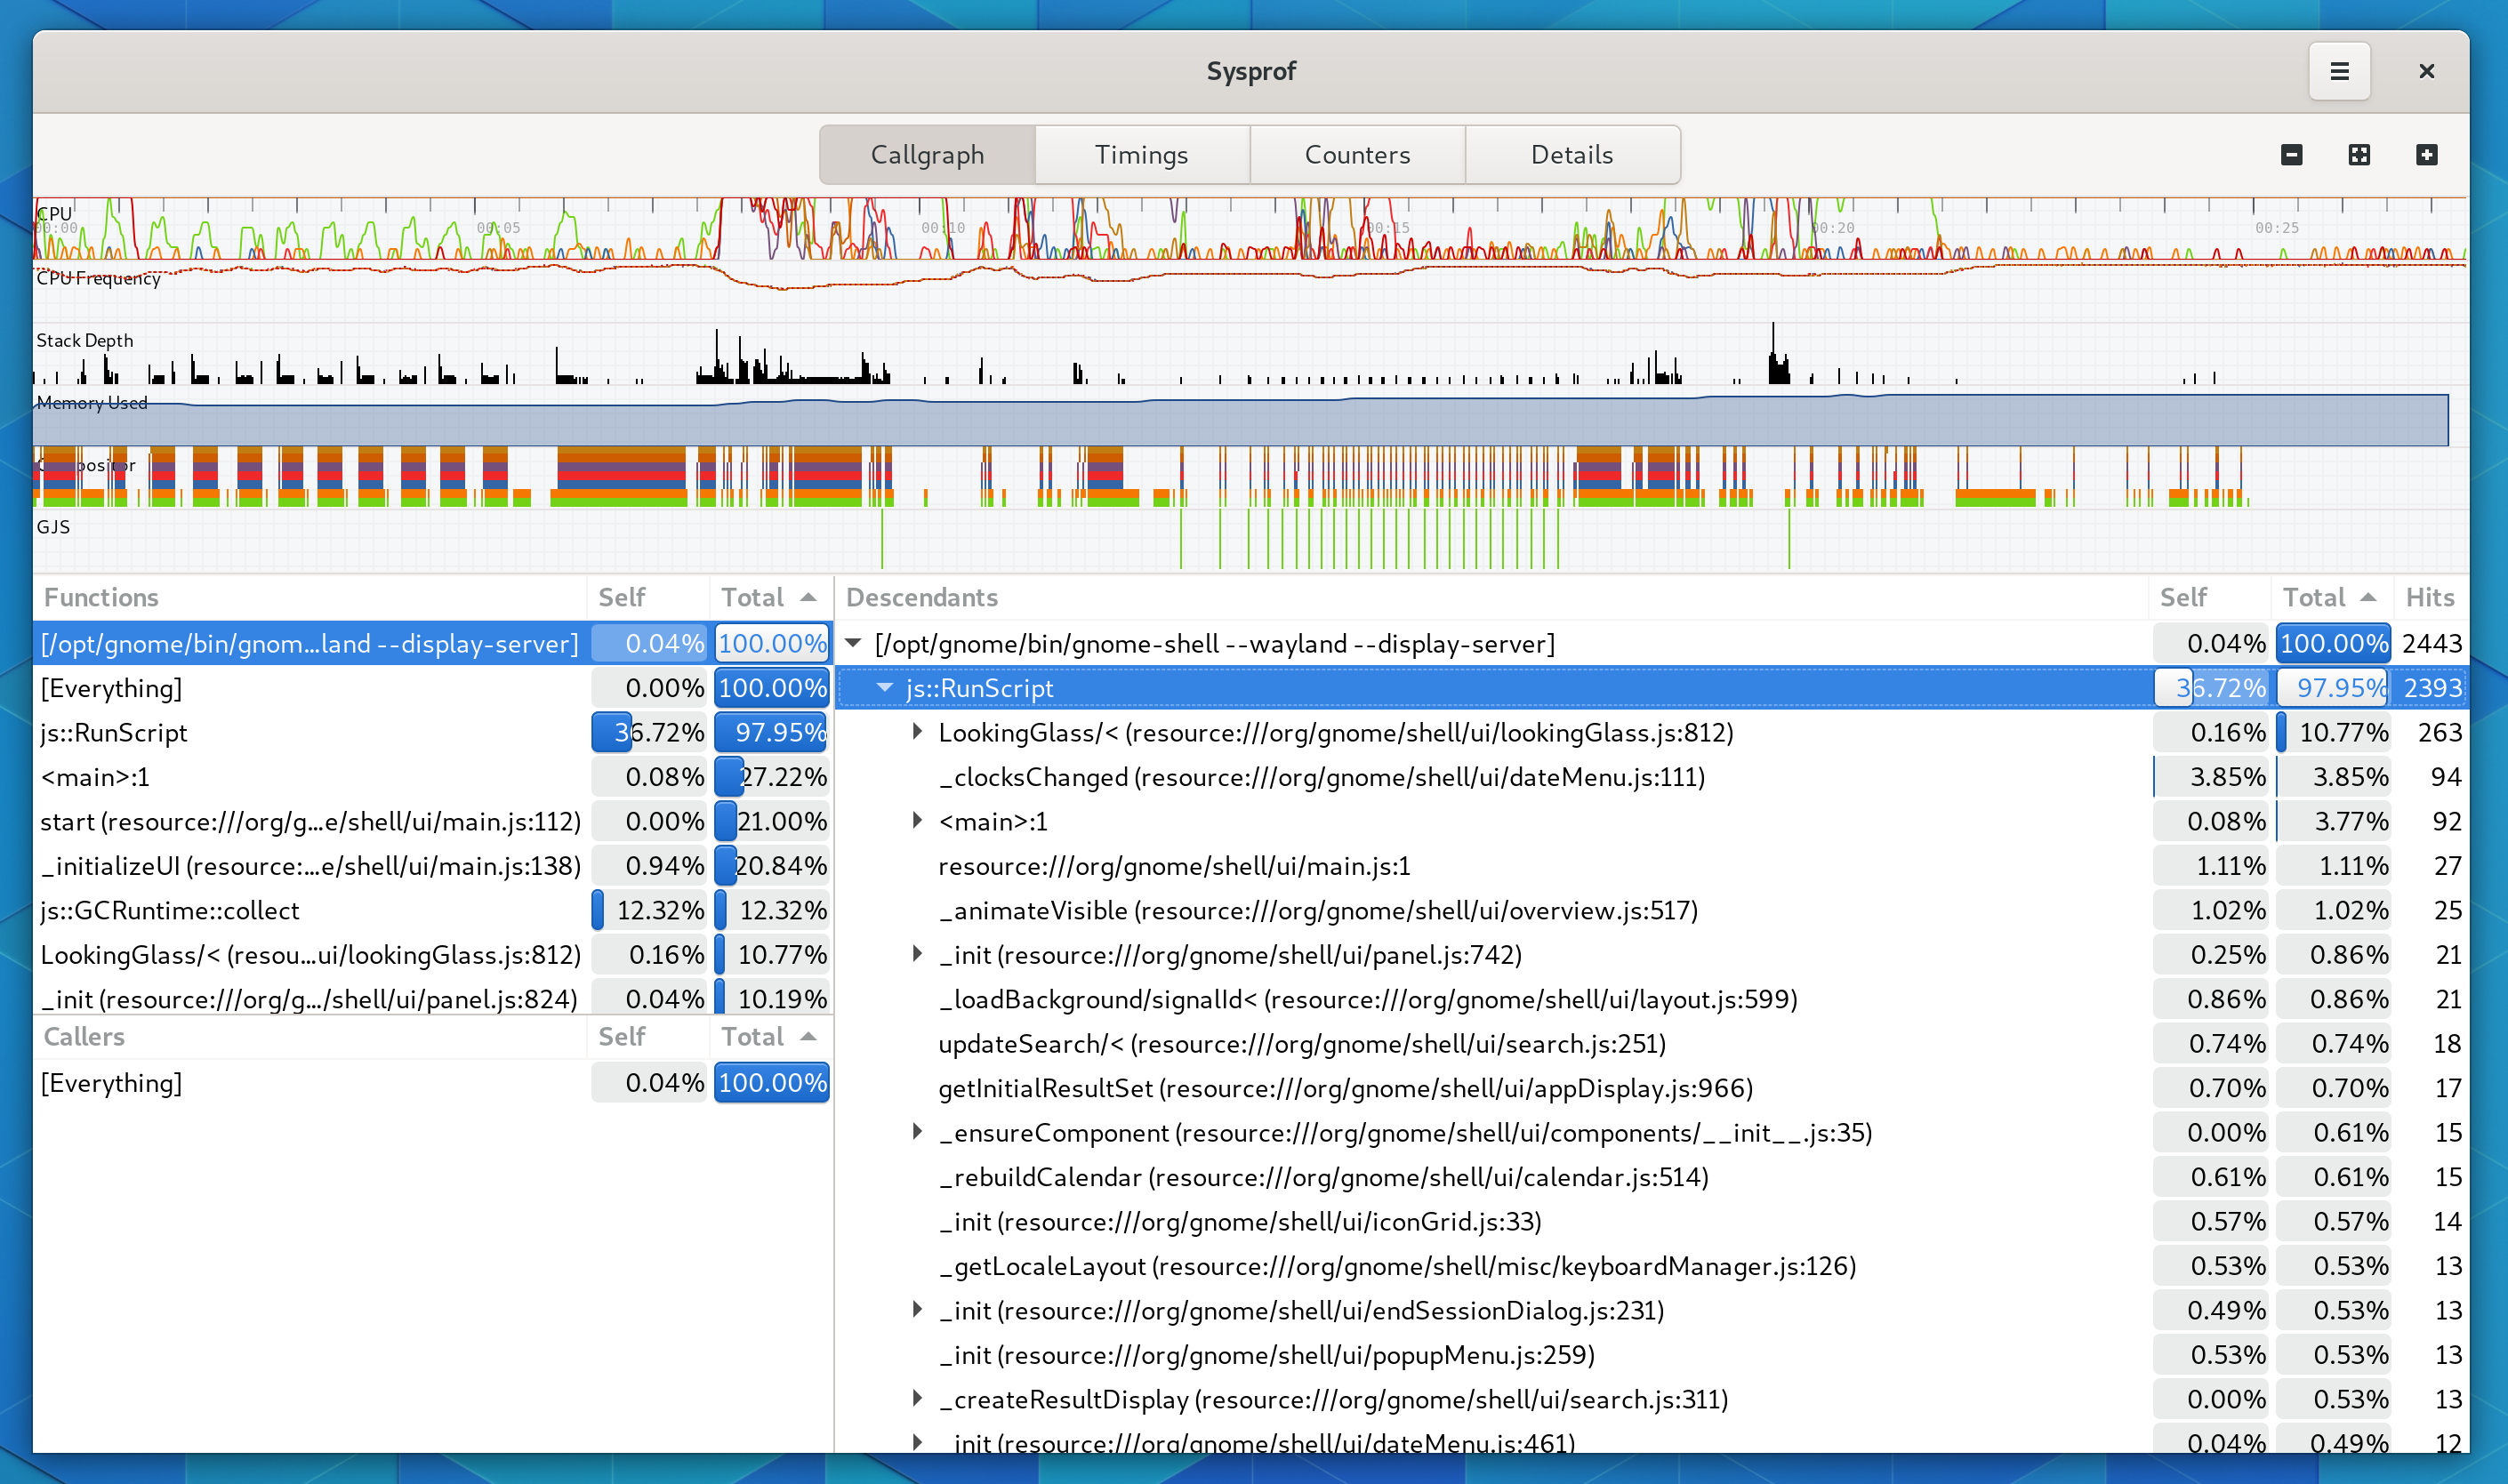
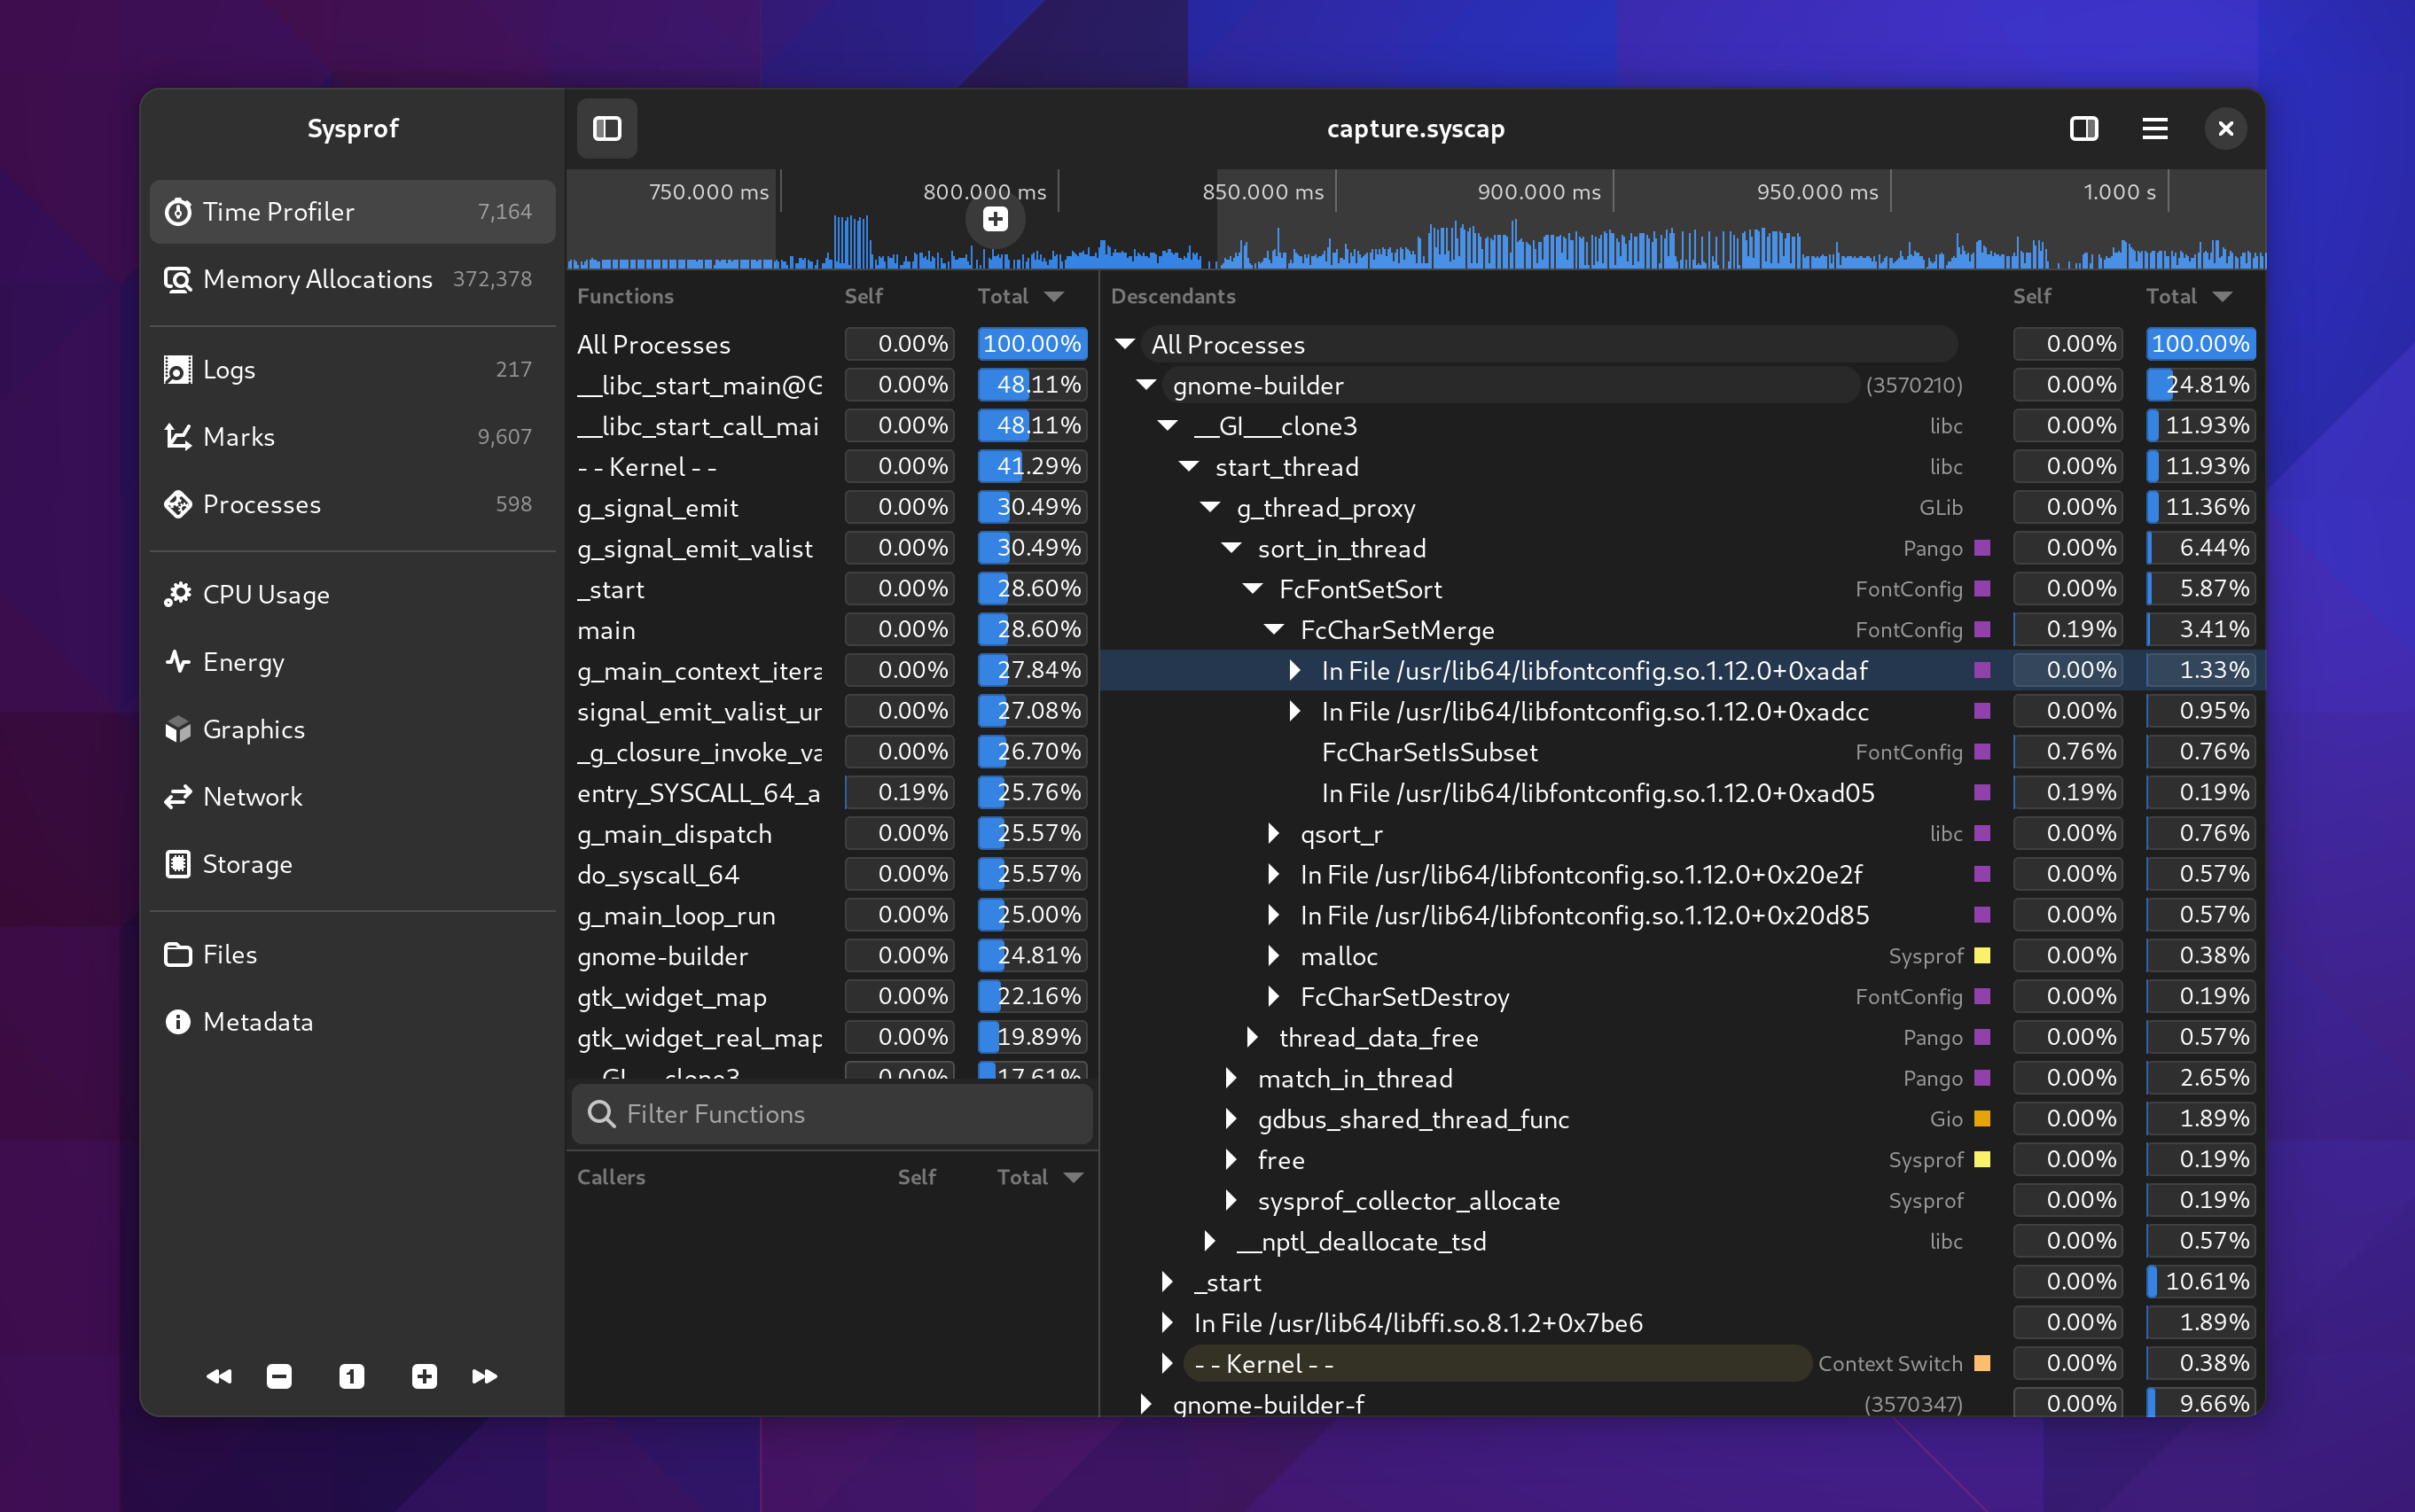
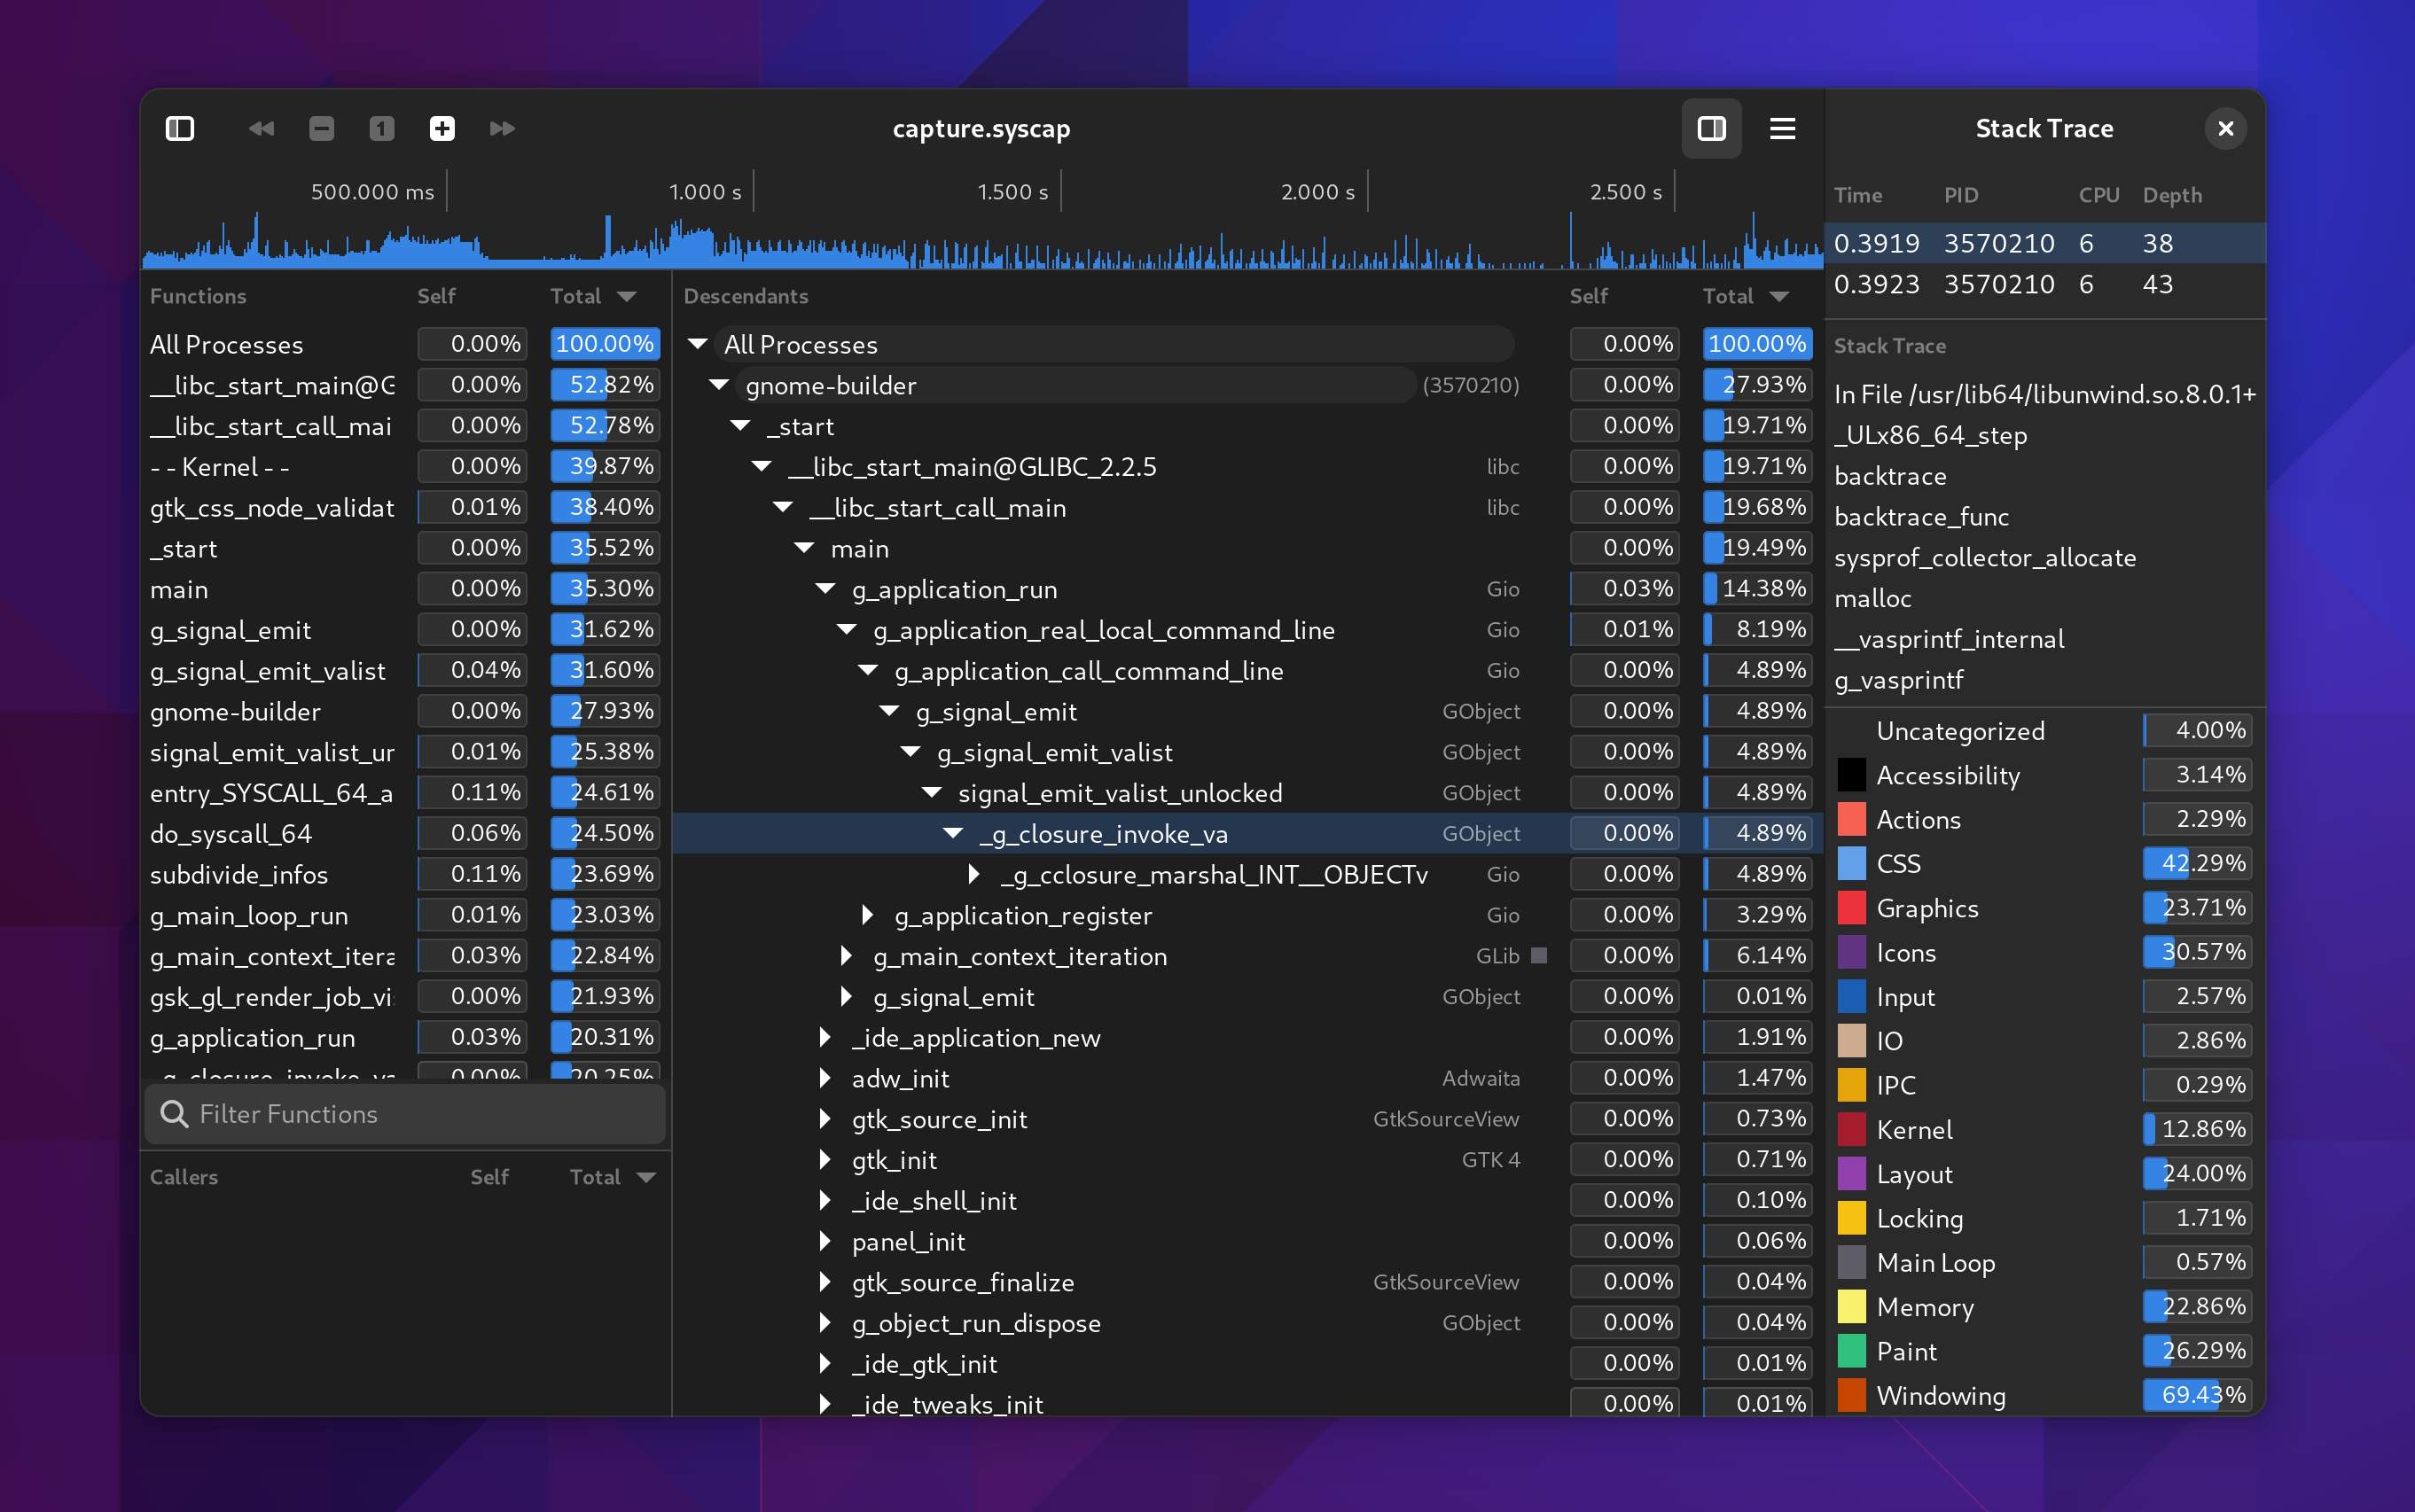
Categorized Stack Traces
While I was working on this I had to add a few things I’ve wanted for a while. One such thing was a utility sidebar that can be shown with additional information relative to the current selection. In this case, you can expand the callgraph and see a list of all the stack traces that contributed to that callgraph frame showing up in the capture. Additionally, we can categorize stack traces based on the libraries and functions contributing to them to give you a high-level overview of where time is being spent.
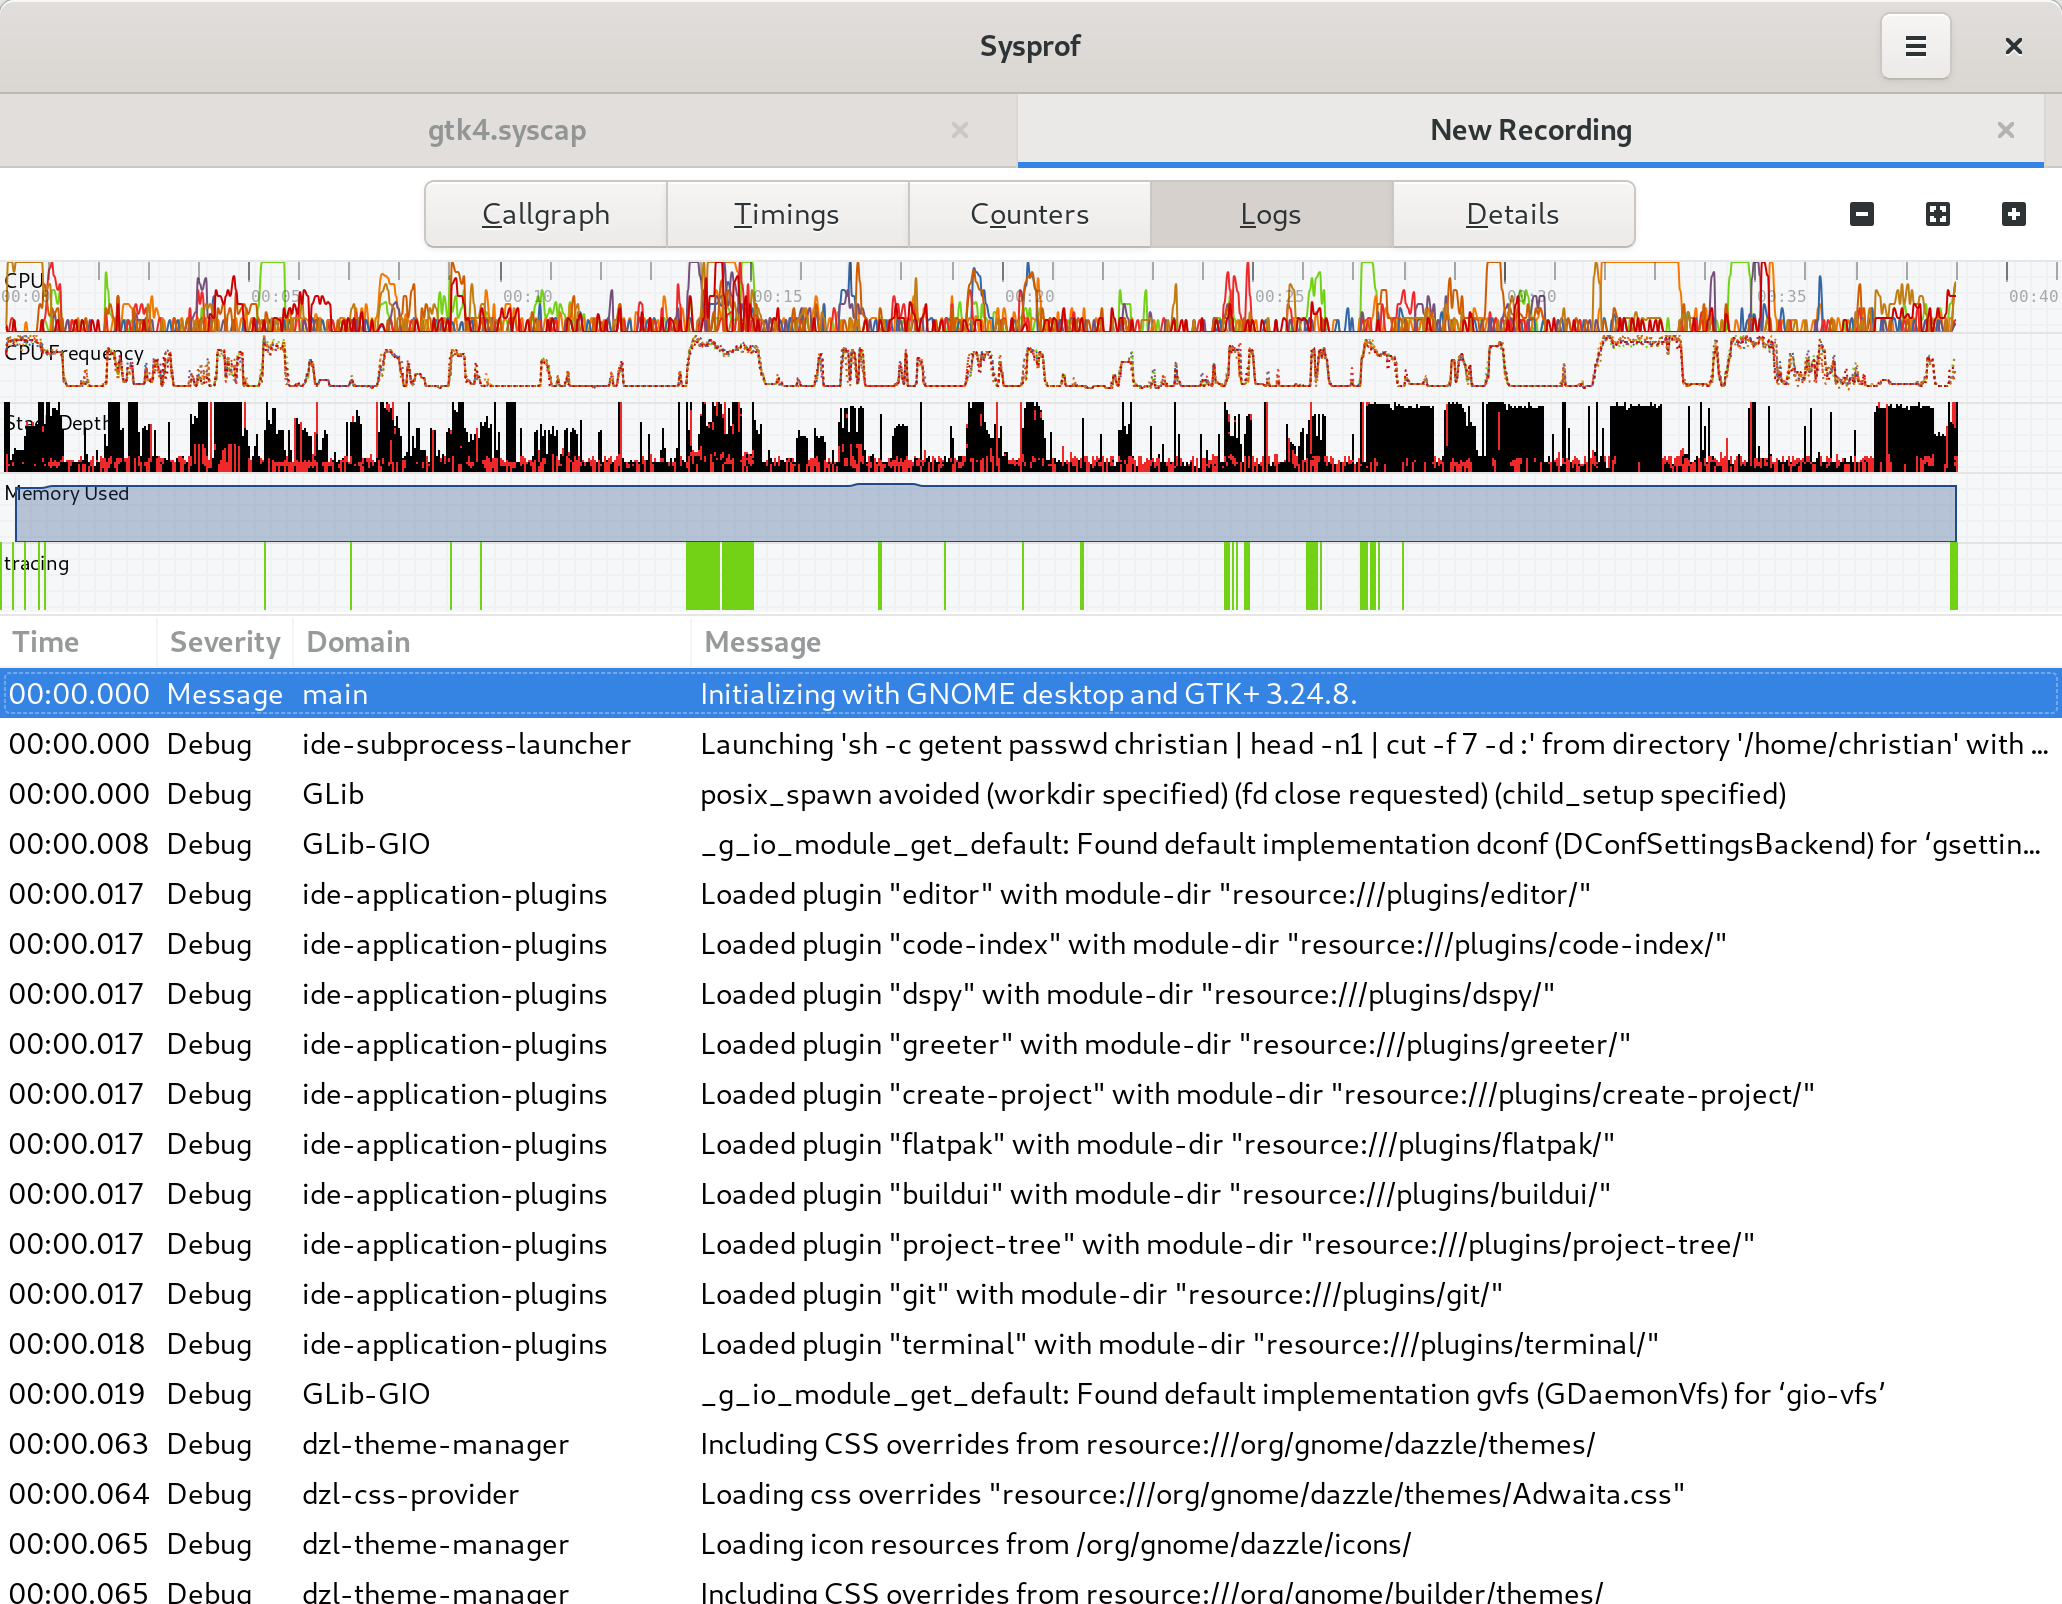
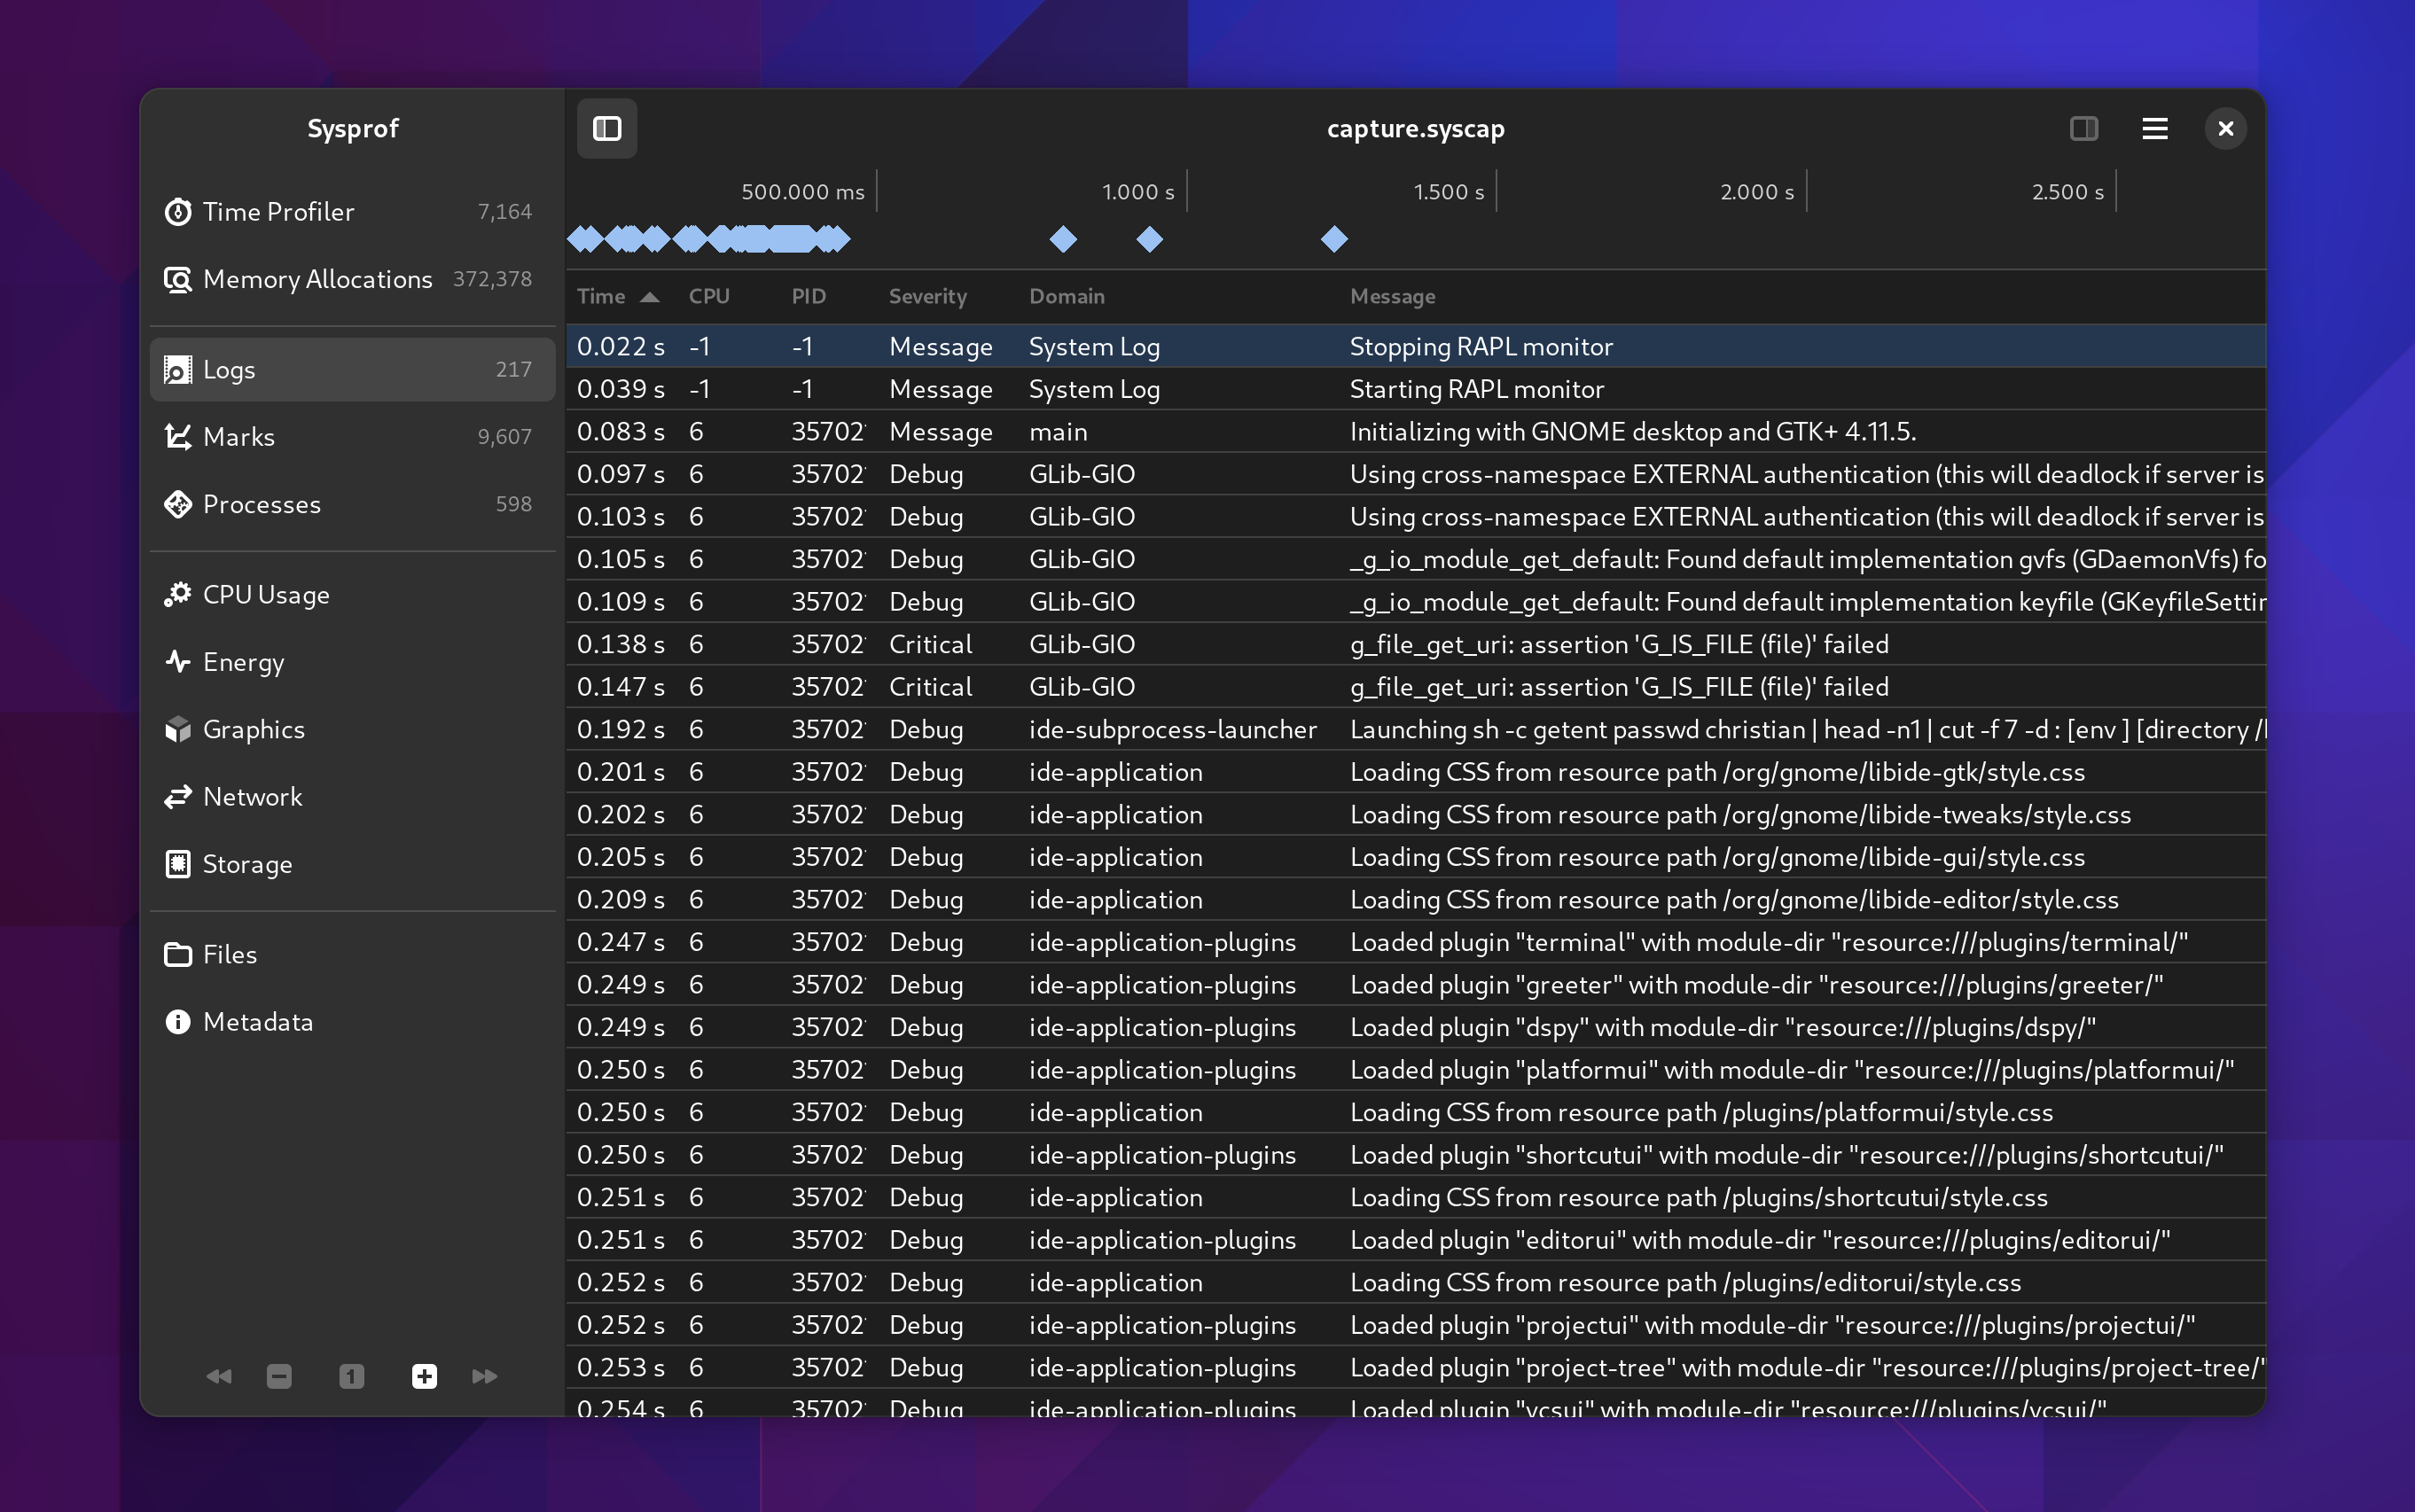
Logs View
When spawning an application from Sysprof it can write logs by integrating with libsysprof-capture-4.a. That’s not new but what is new is that Sysprof now has a journald collector which can be interposed in your capture.
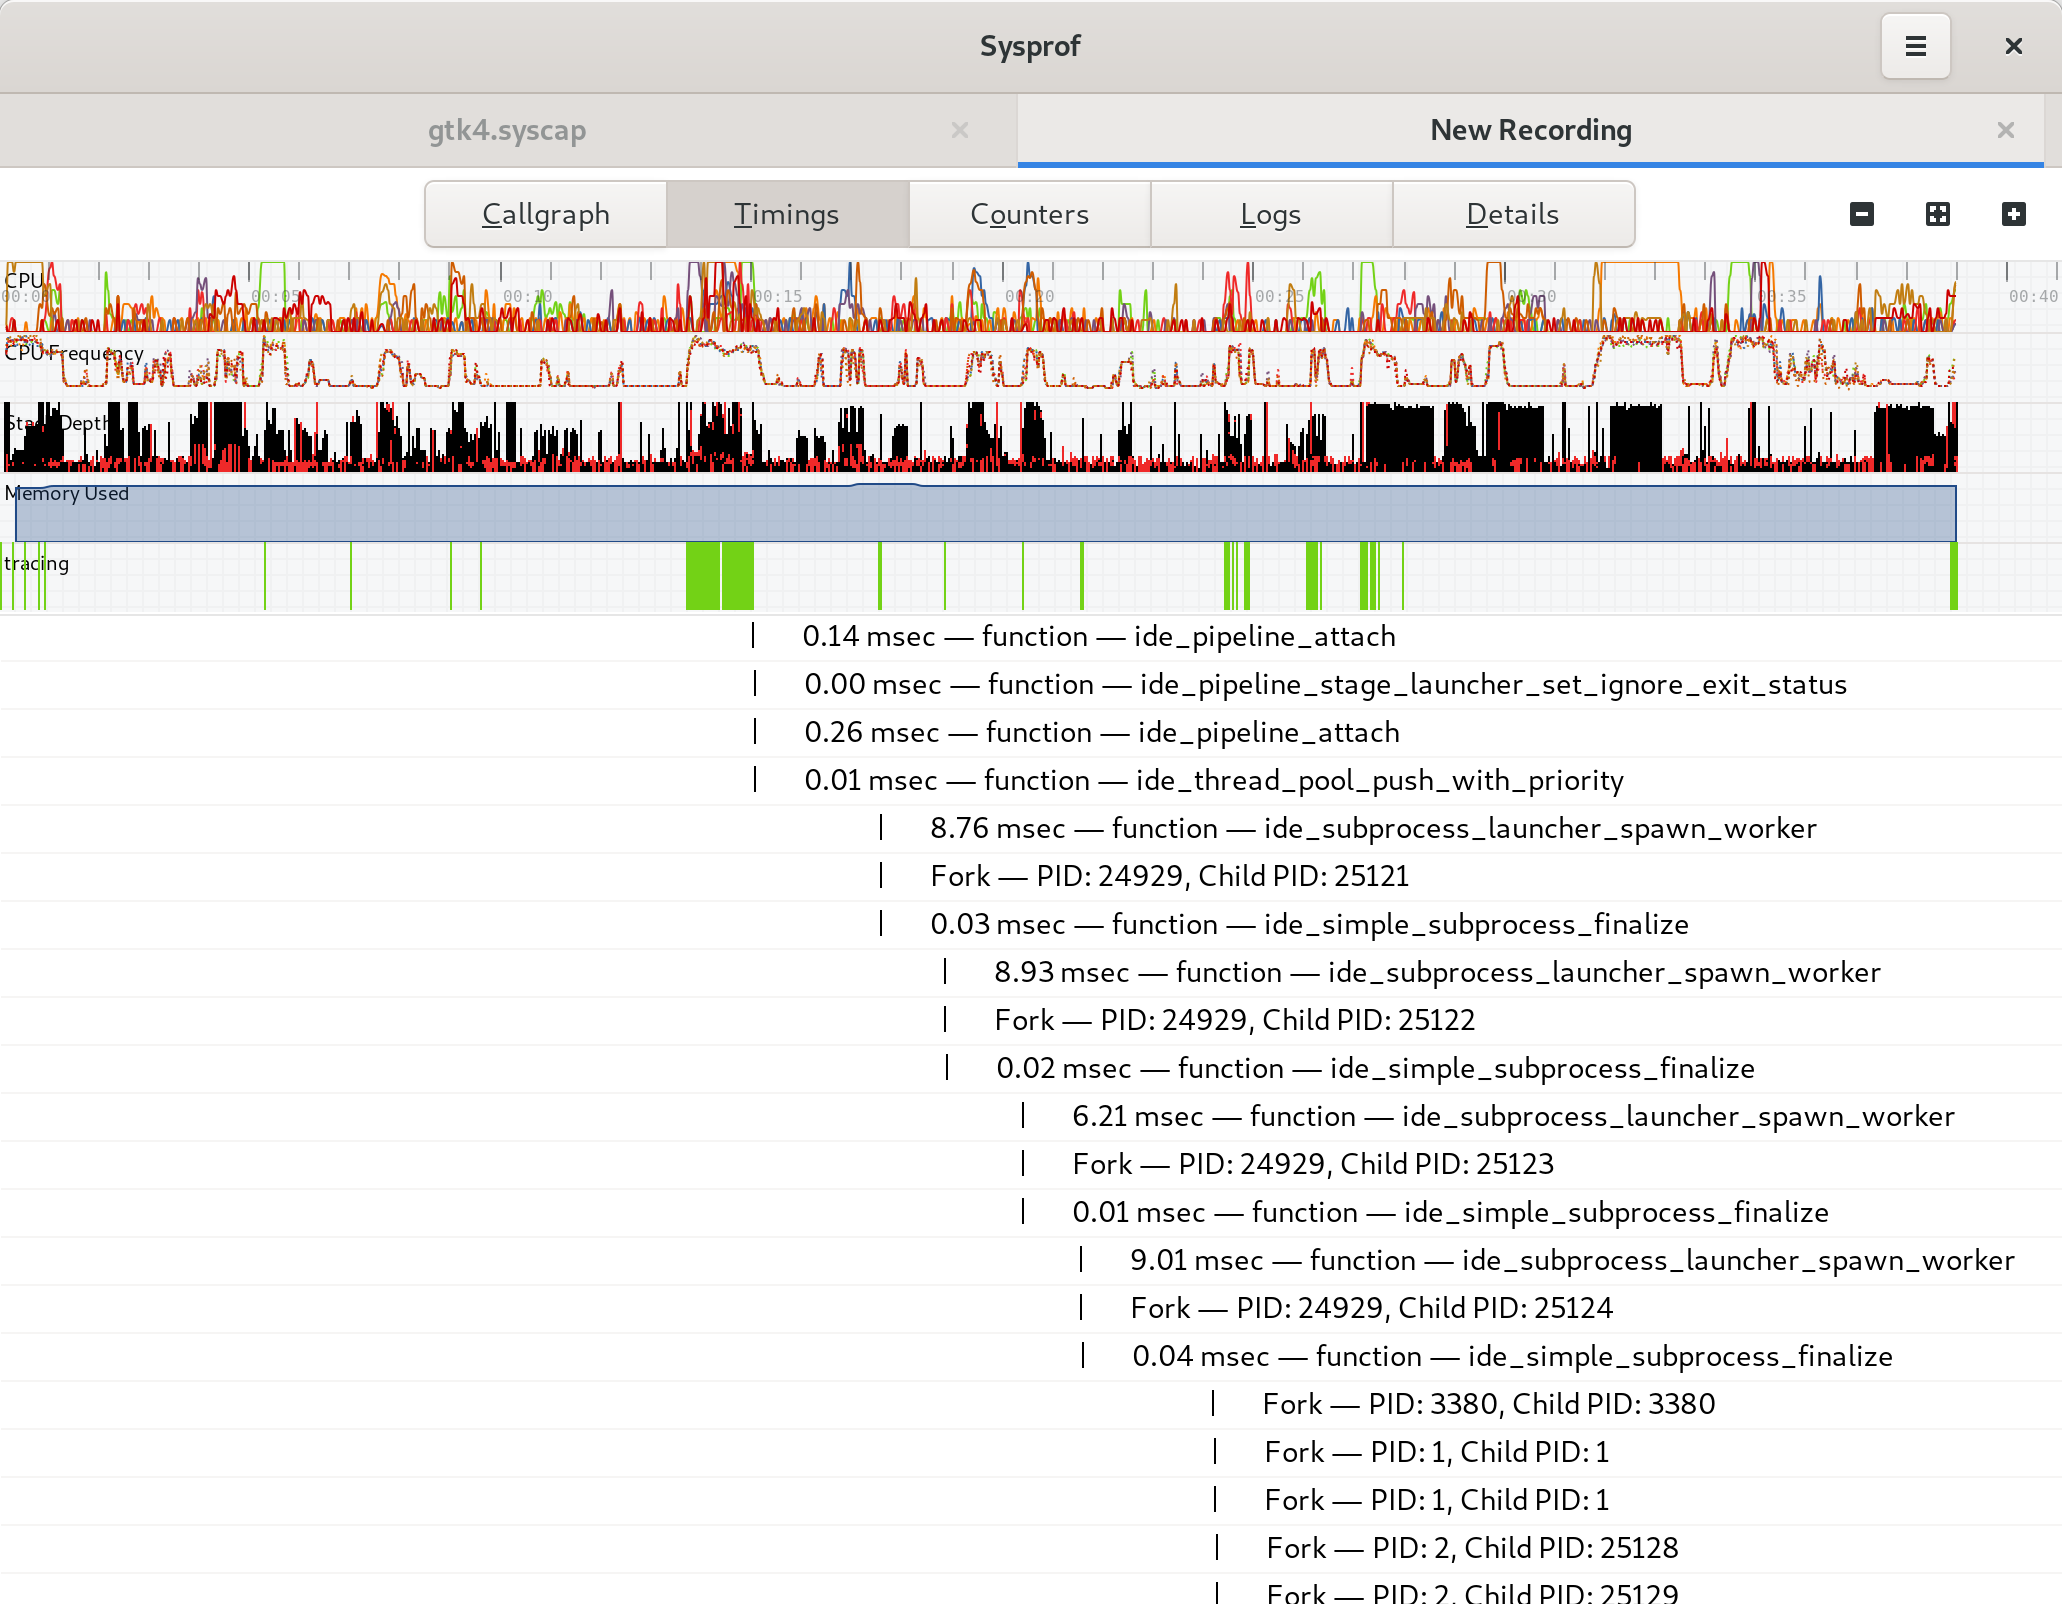
Marks
Marks have gone through substantial work to be more useful.
A mark is just a data frame in the capture that has a time and duration associated with a category, name, and optional message. These are used by GNOME Shell to annotate what is happening in the compositor as well as by GTK to denote what is happening during the frame cycles. Furthermore, GLib has optional Sysprof support which can annotate your main loop cycles so you can see why applications are waking up and for how long.
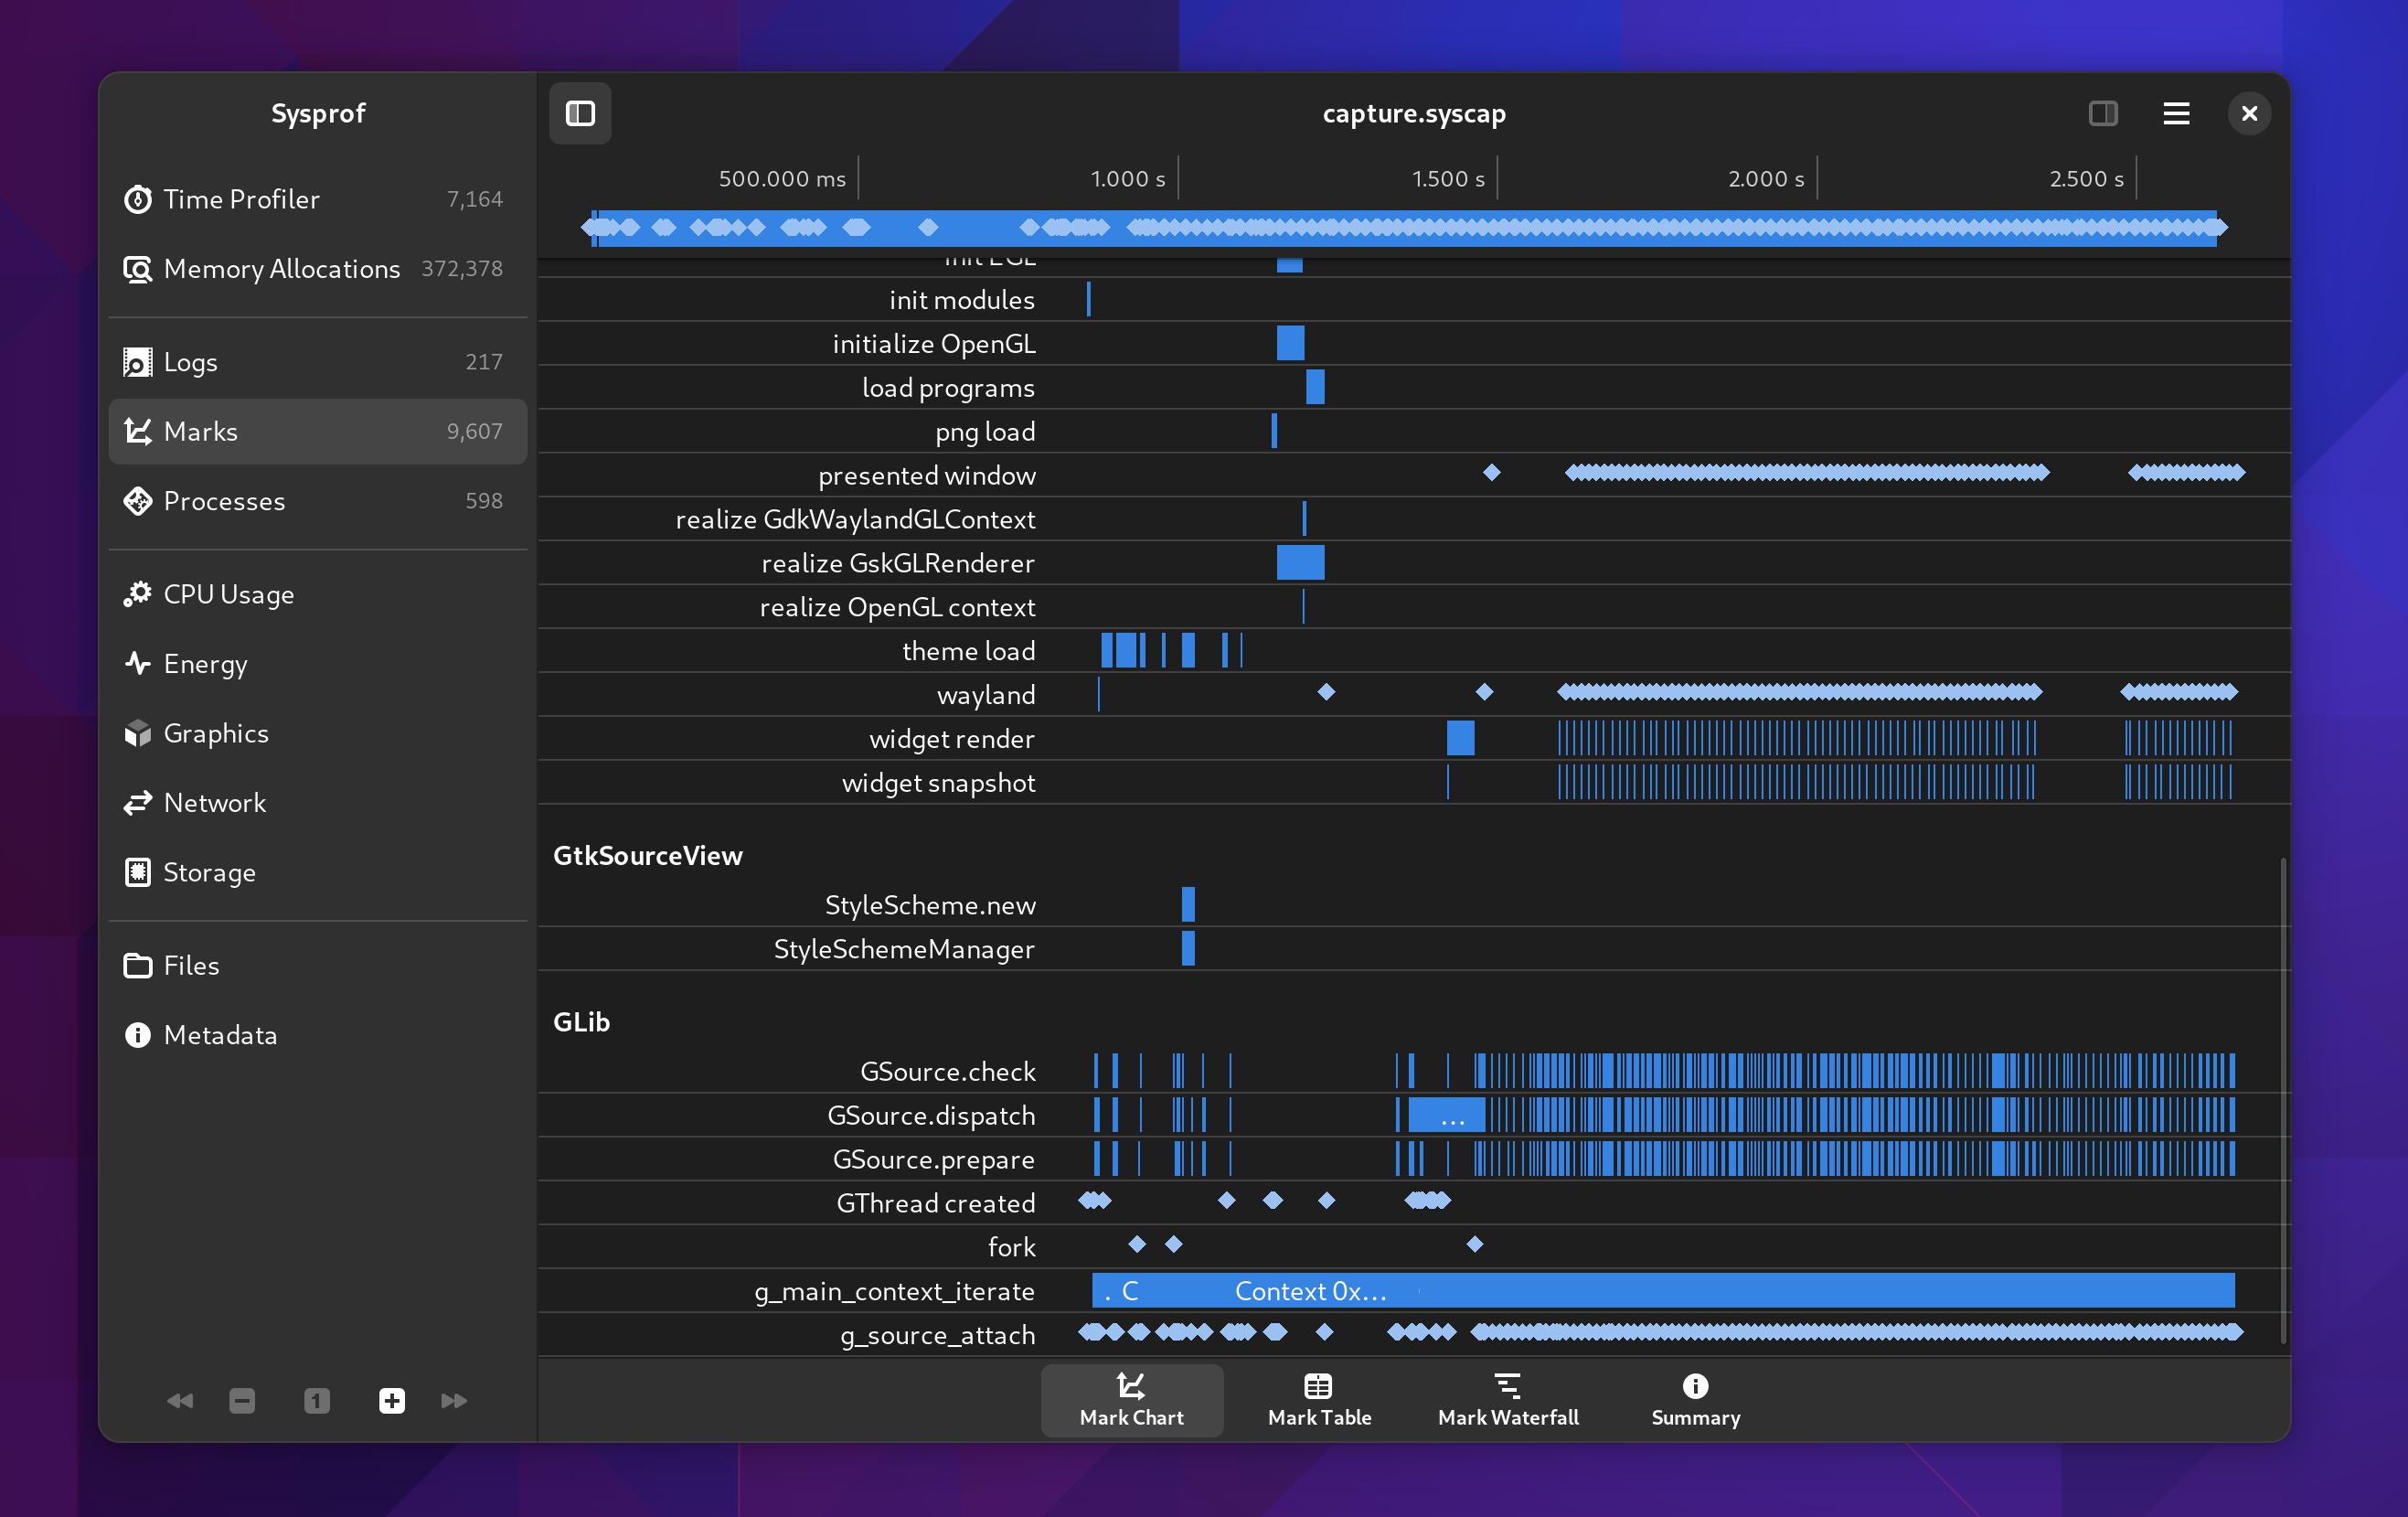
Marks Chart
The first new view we have for this is the “Mark Chart”. It contains a breakdown of the selected time span by category and name. The X axis is of course time.
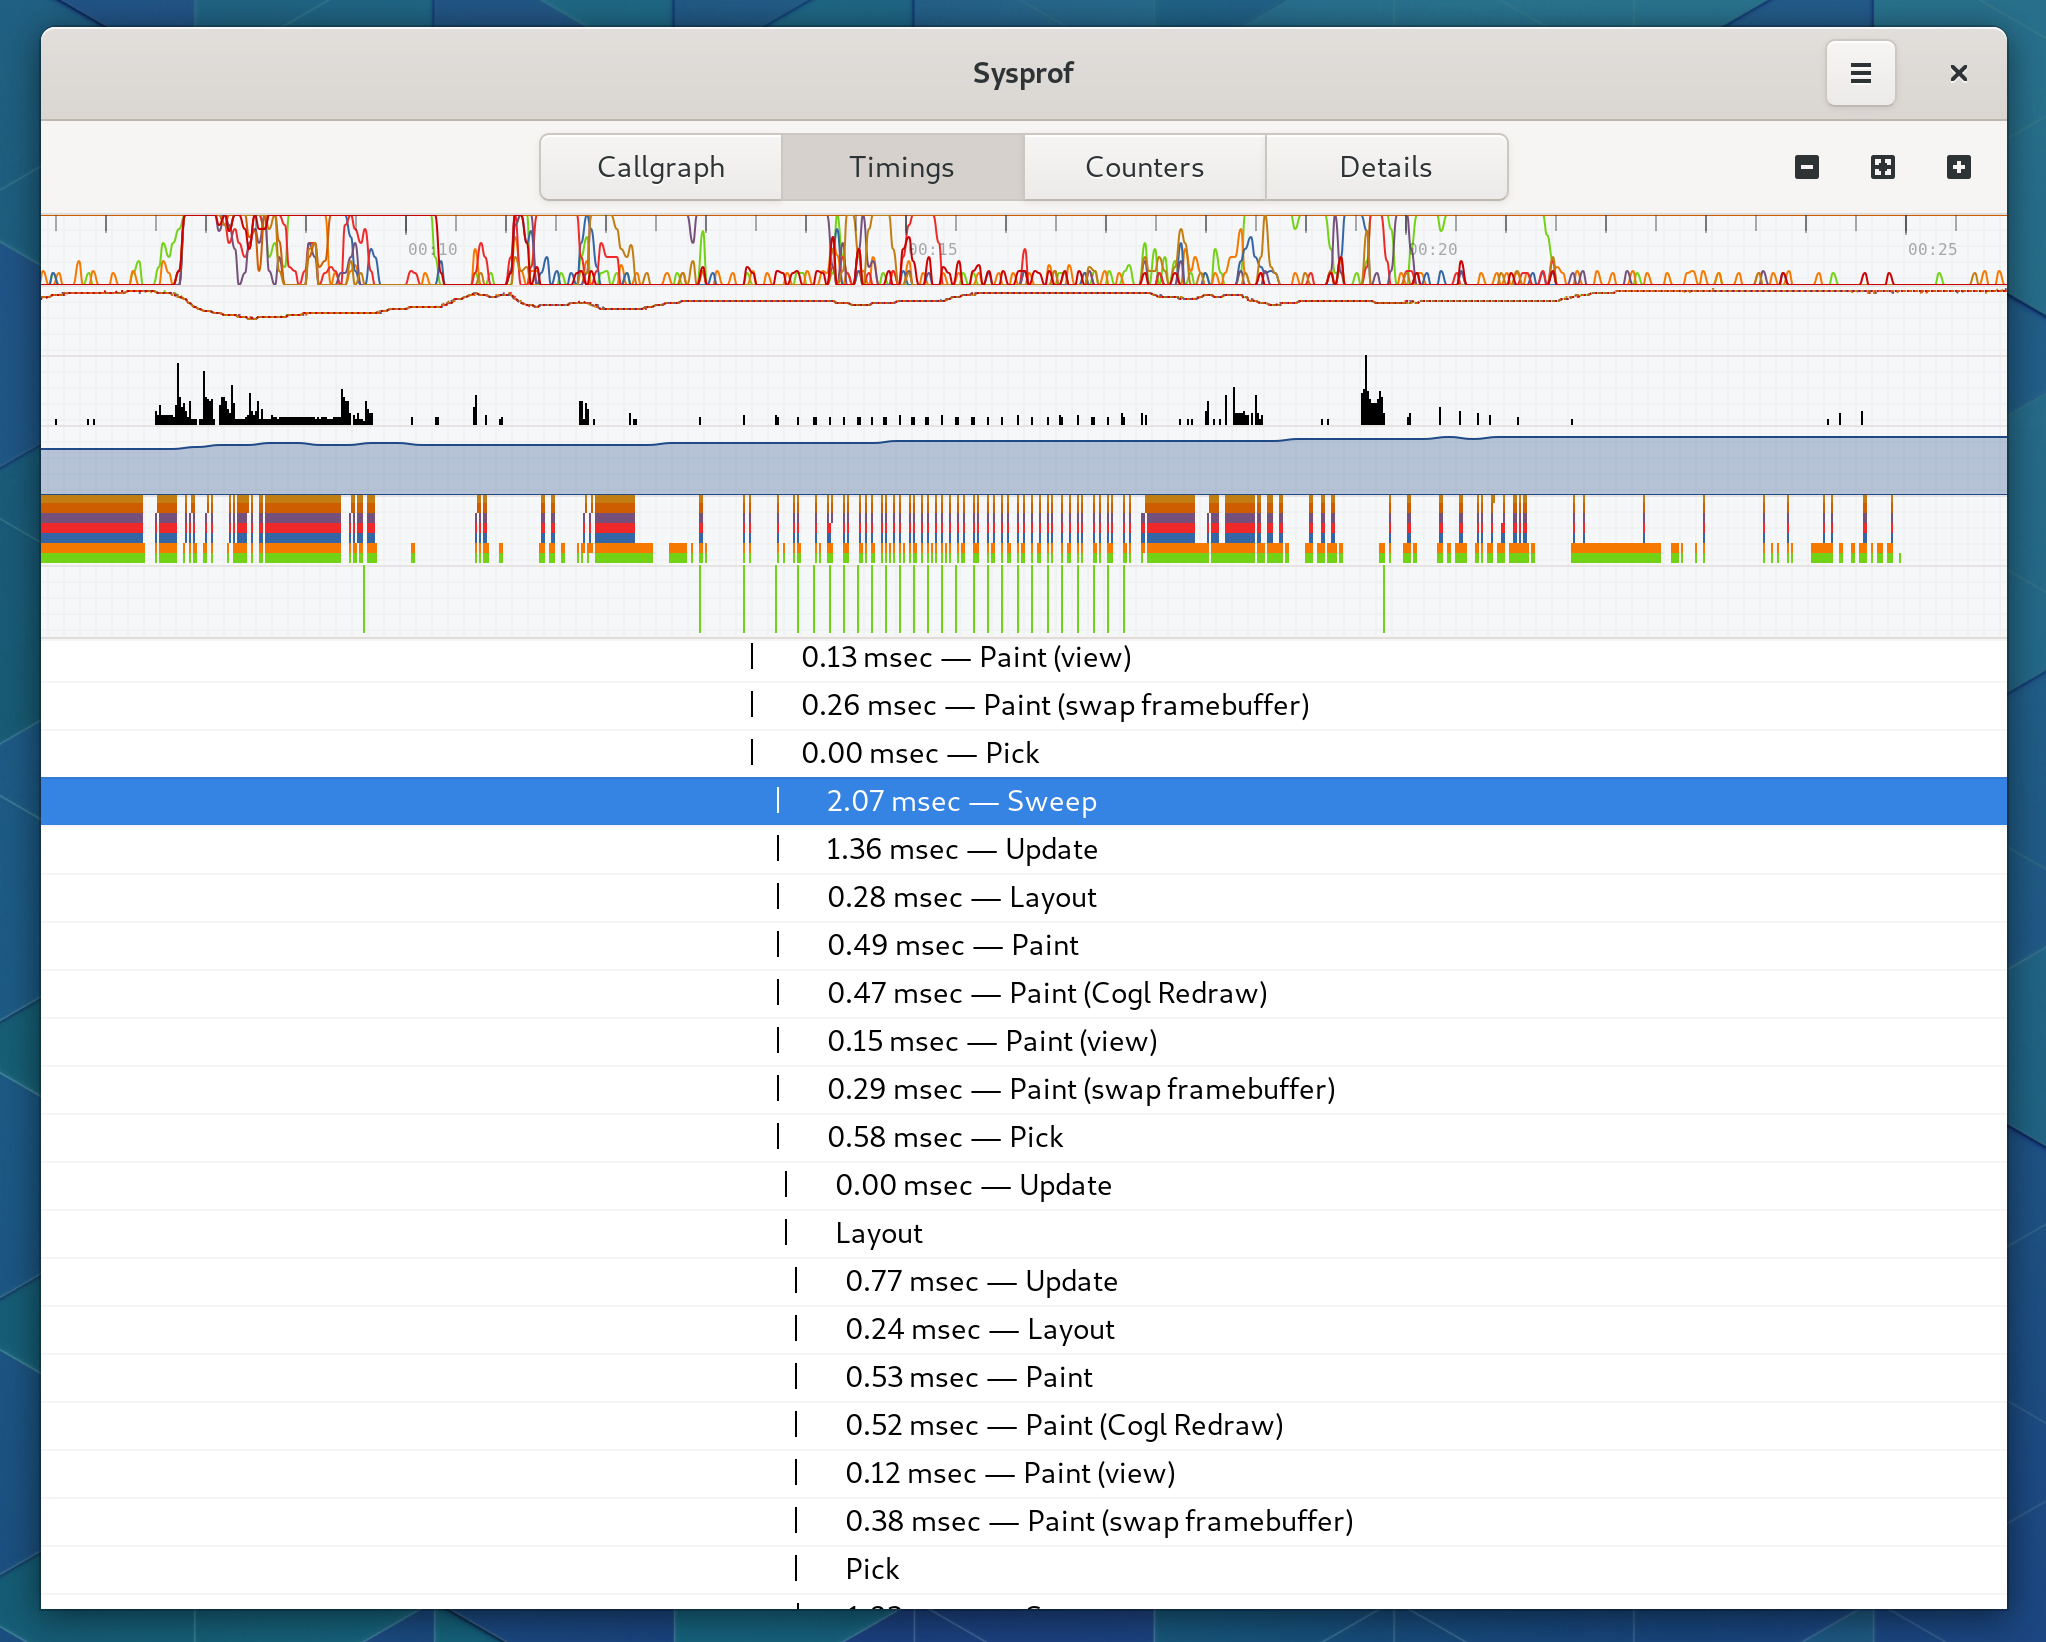
Marks Table
Sysprof now has a long-requested mark table.
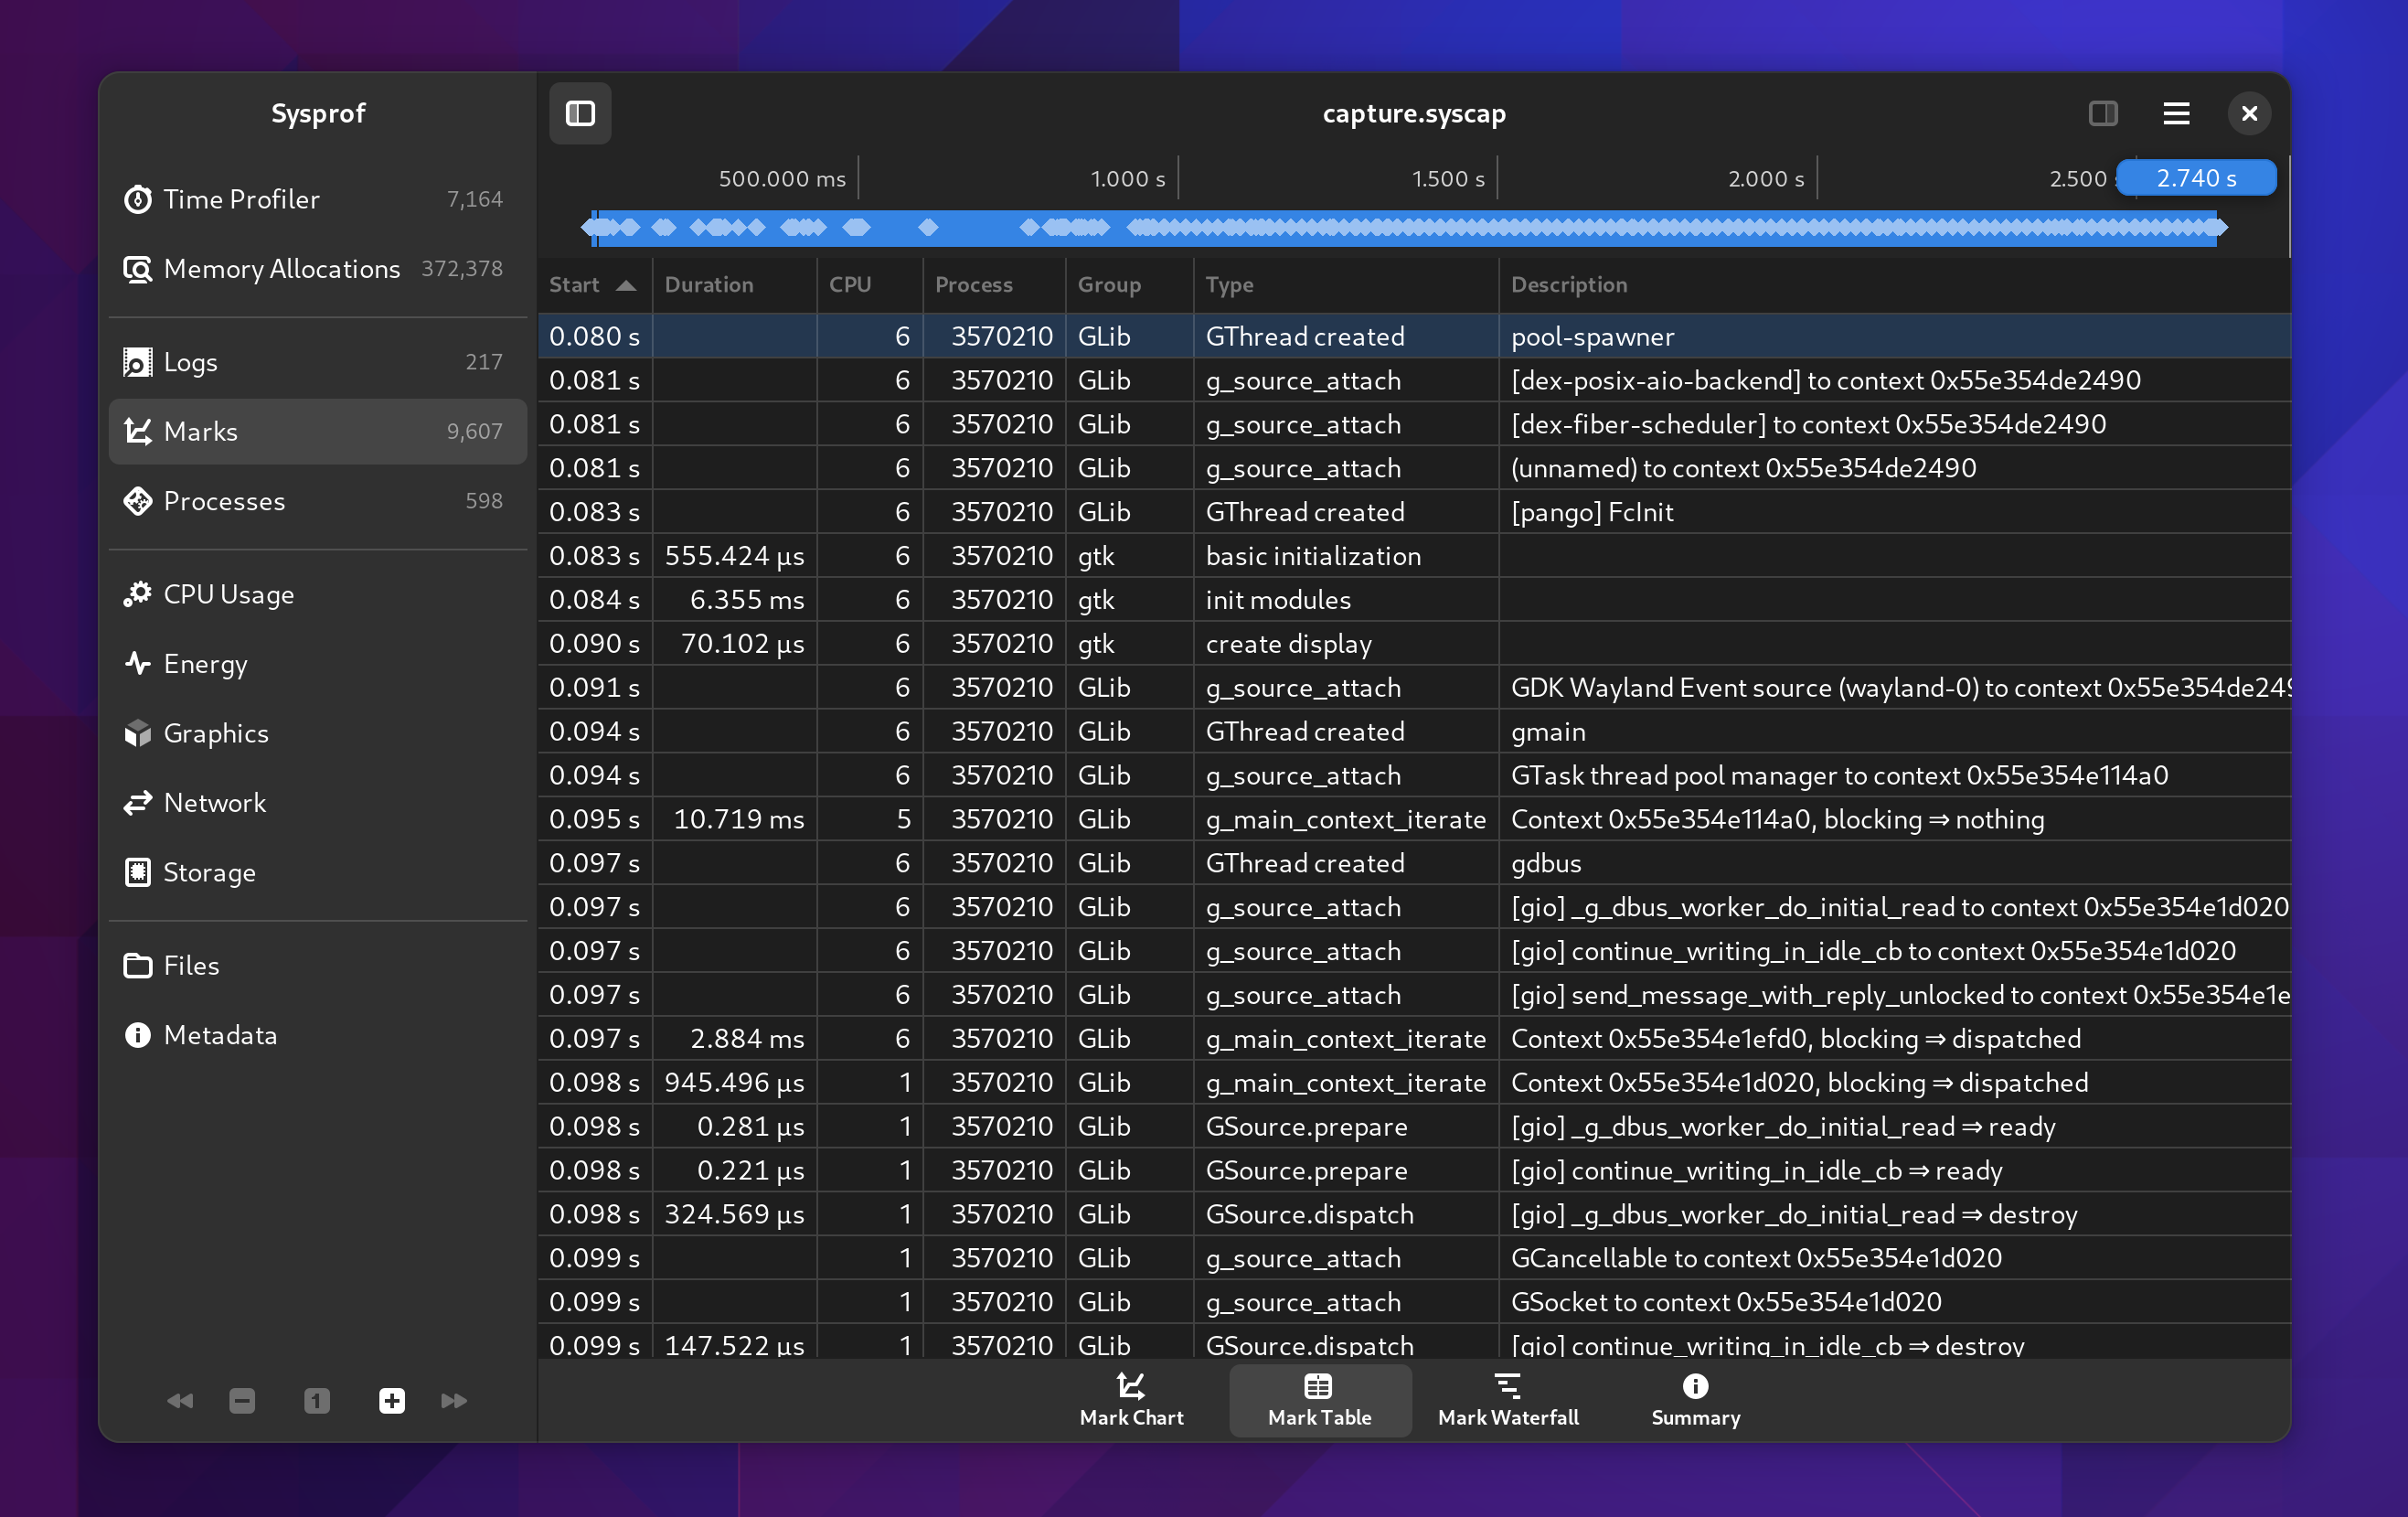
Sometimes its easier to look at data in a more raw form. Especially since you can sort by column and dive into what you care about. It doesn’t hurt that this is much more accessibility friendly too.
Marks Waterfall
We still have the old waterfall style display as well so you can see how things naturally depend on one-another.
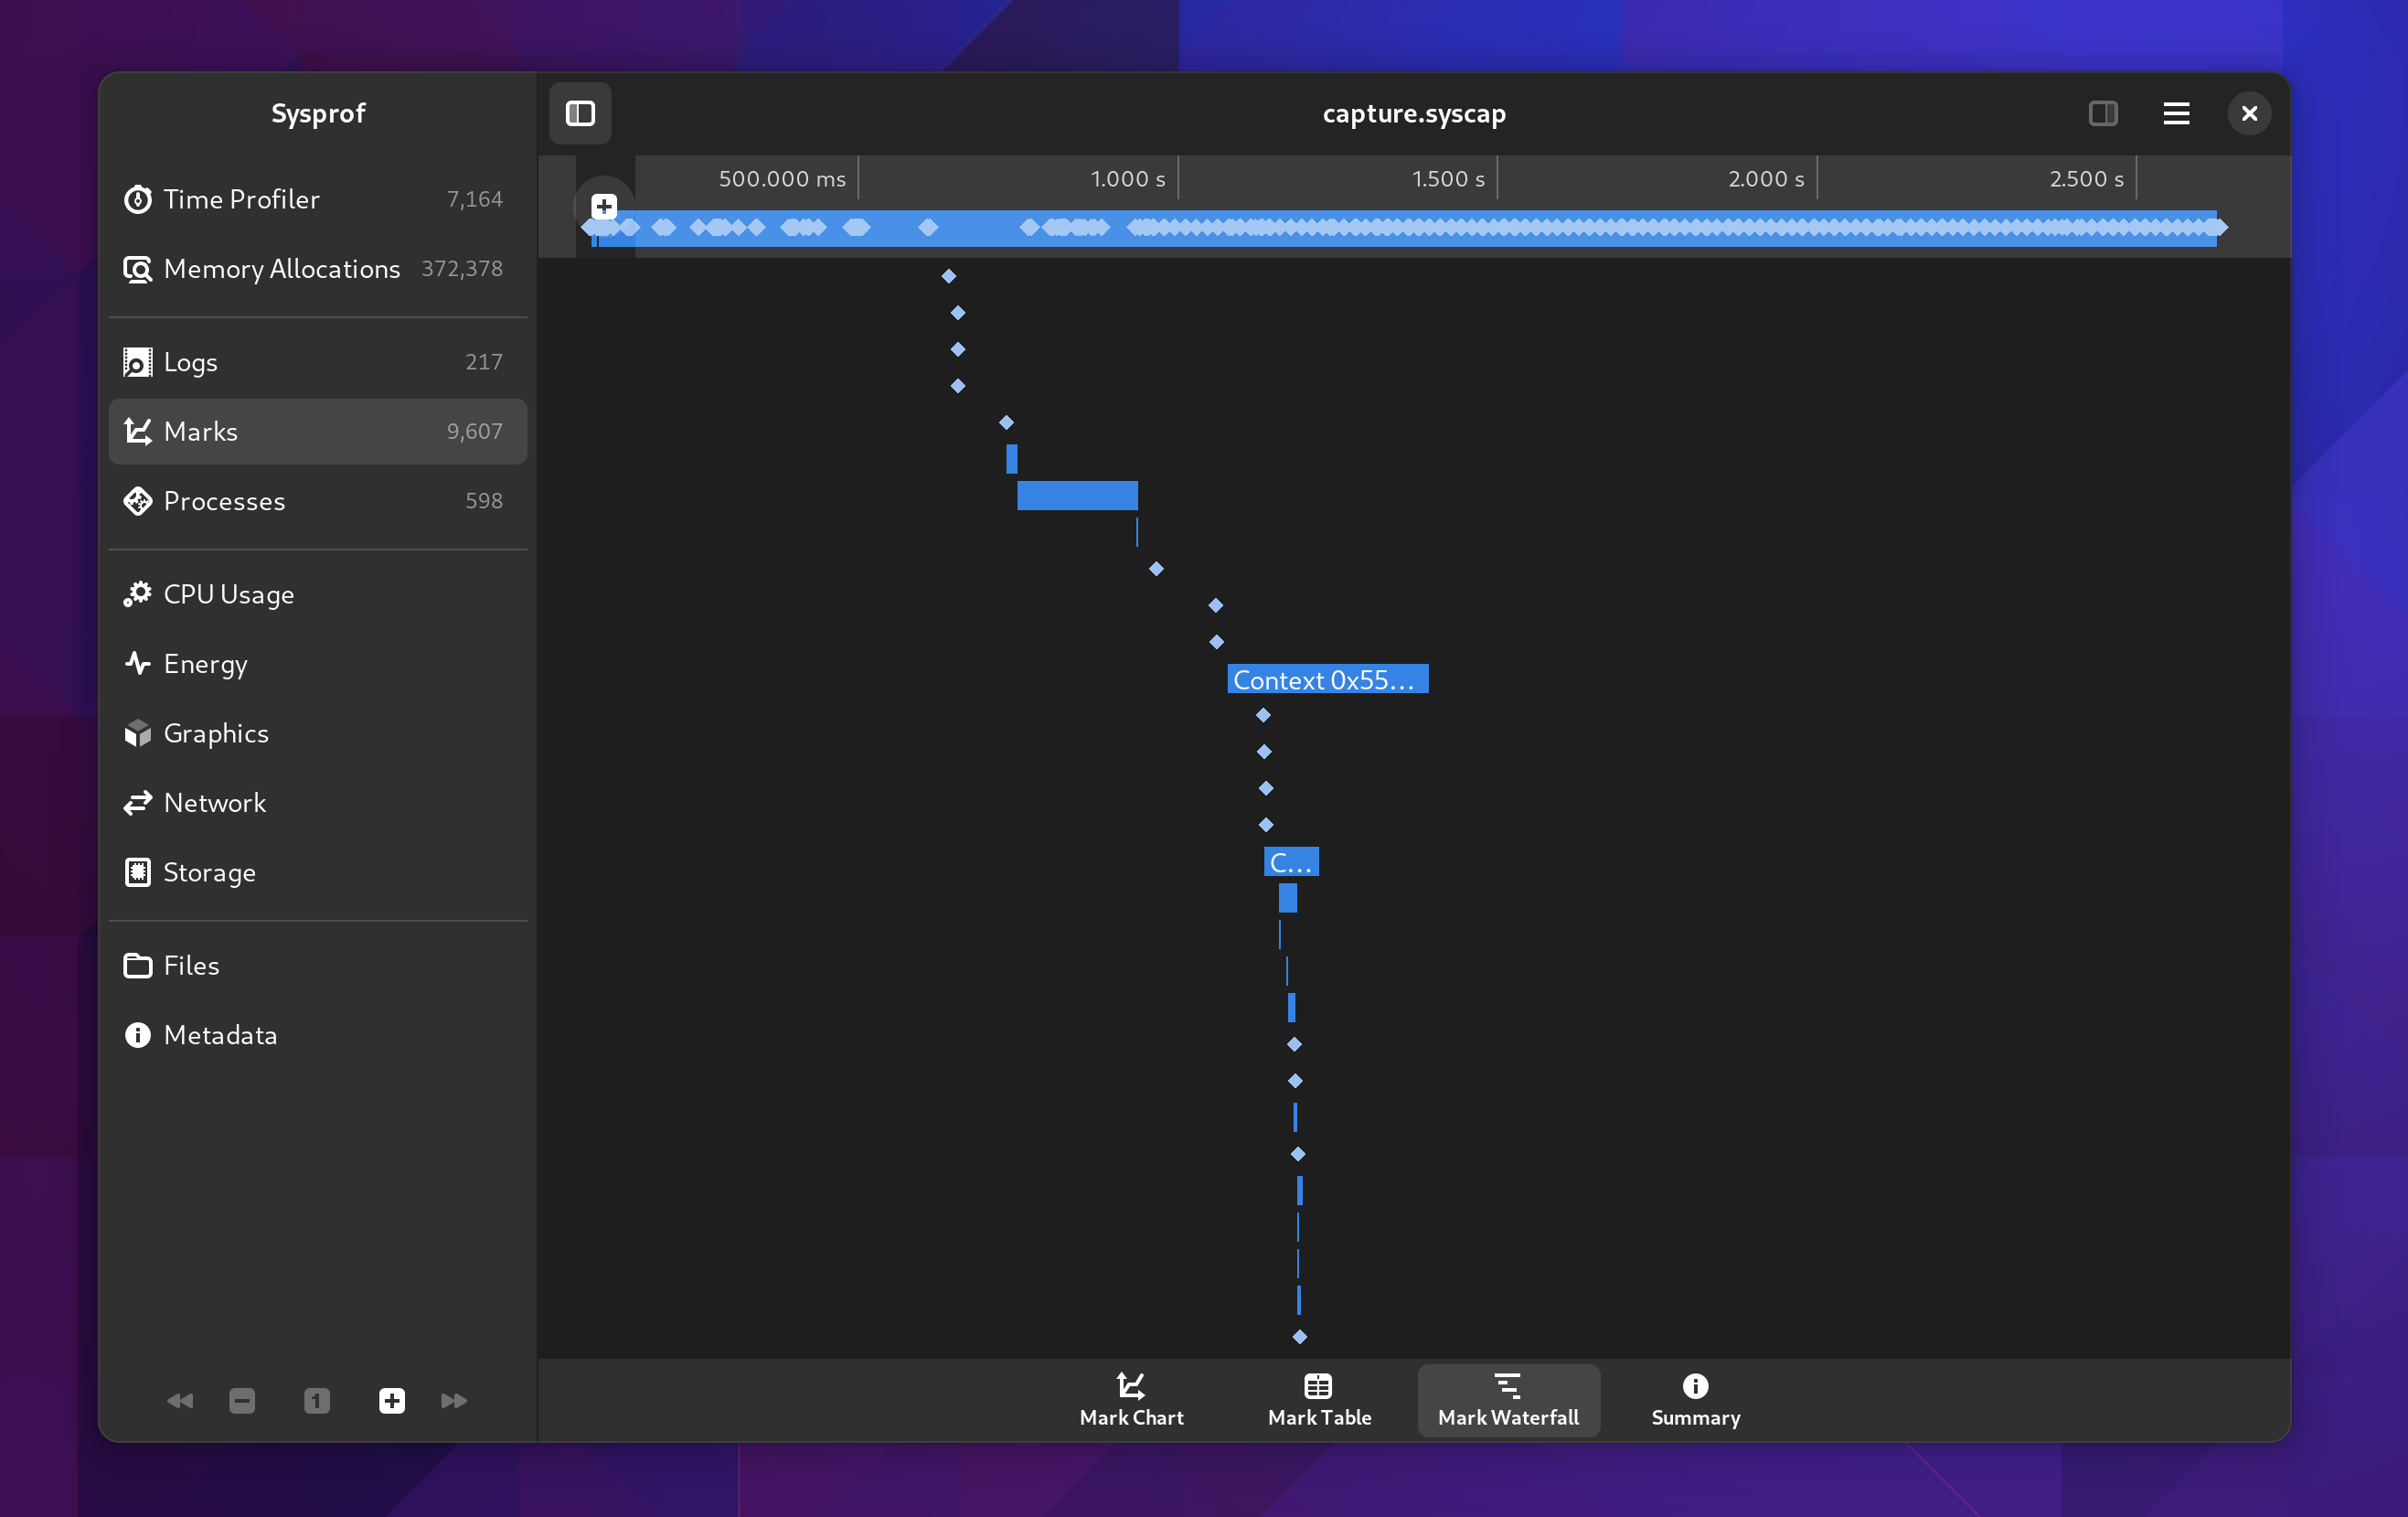
You can double click on these waterfall entries and the visible time region will update to match that item’s duration.
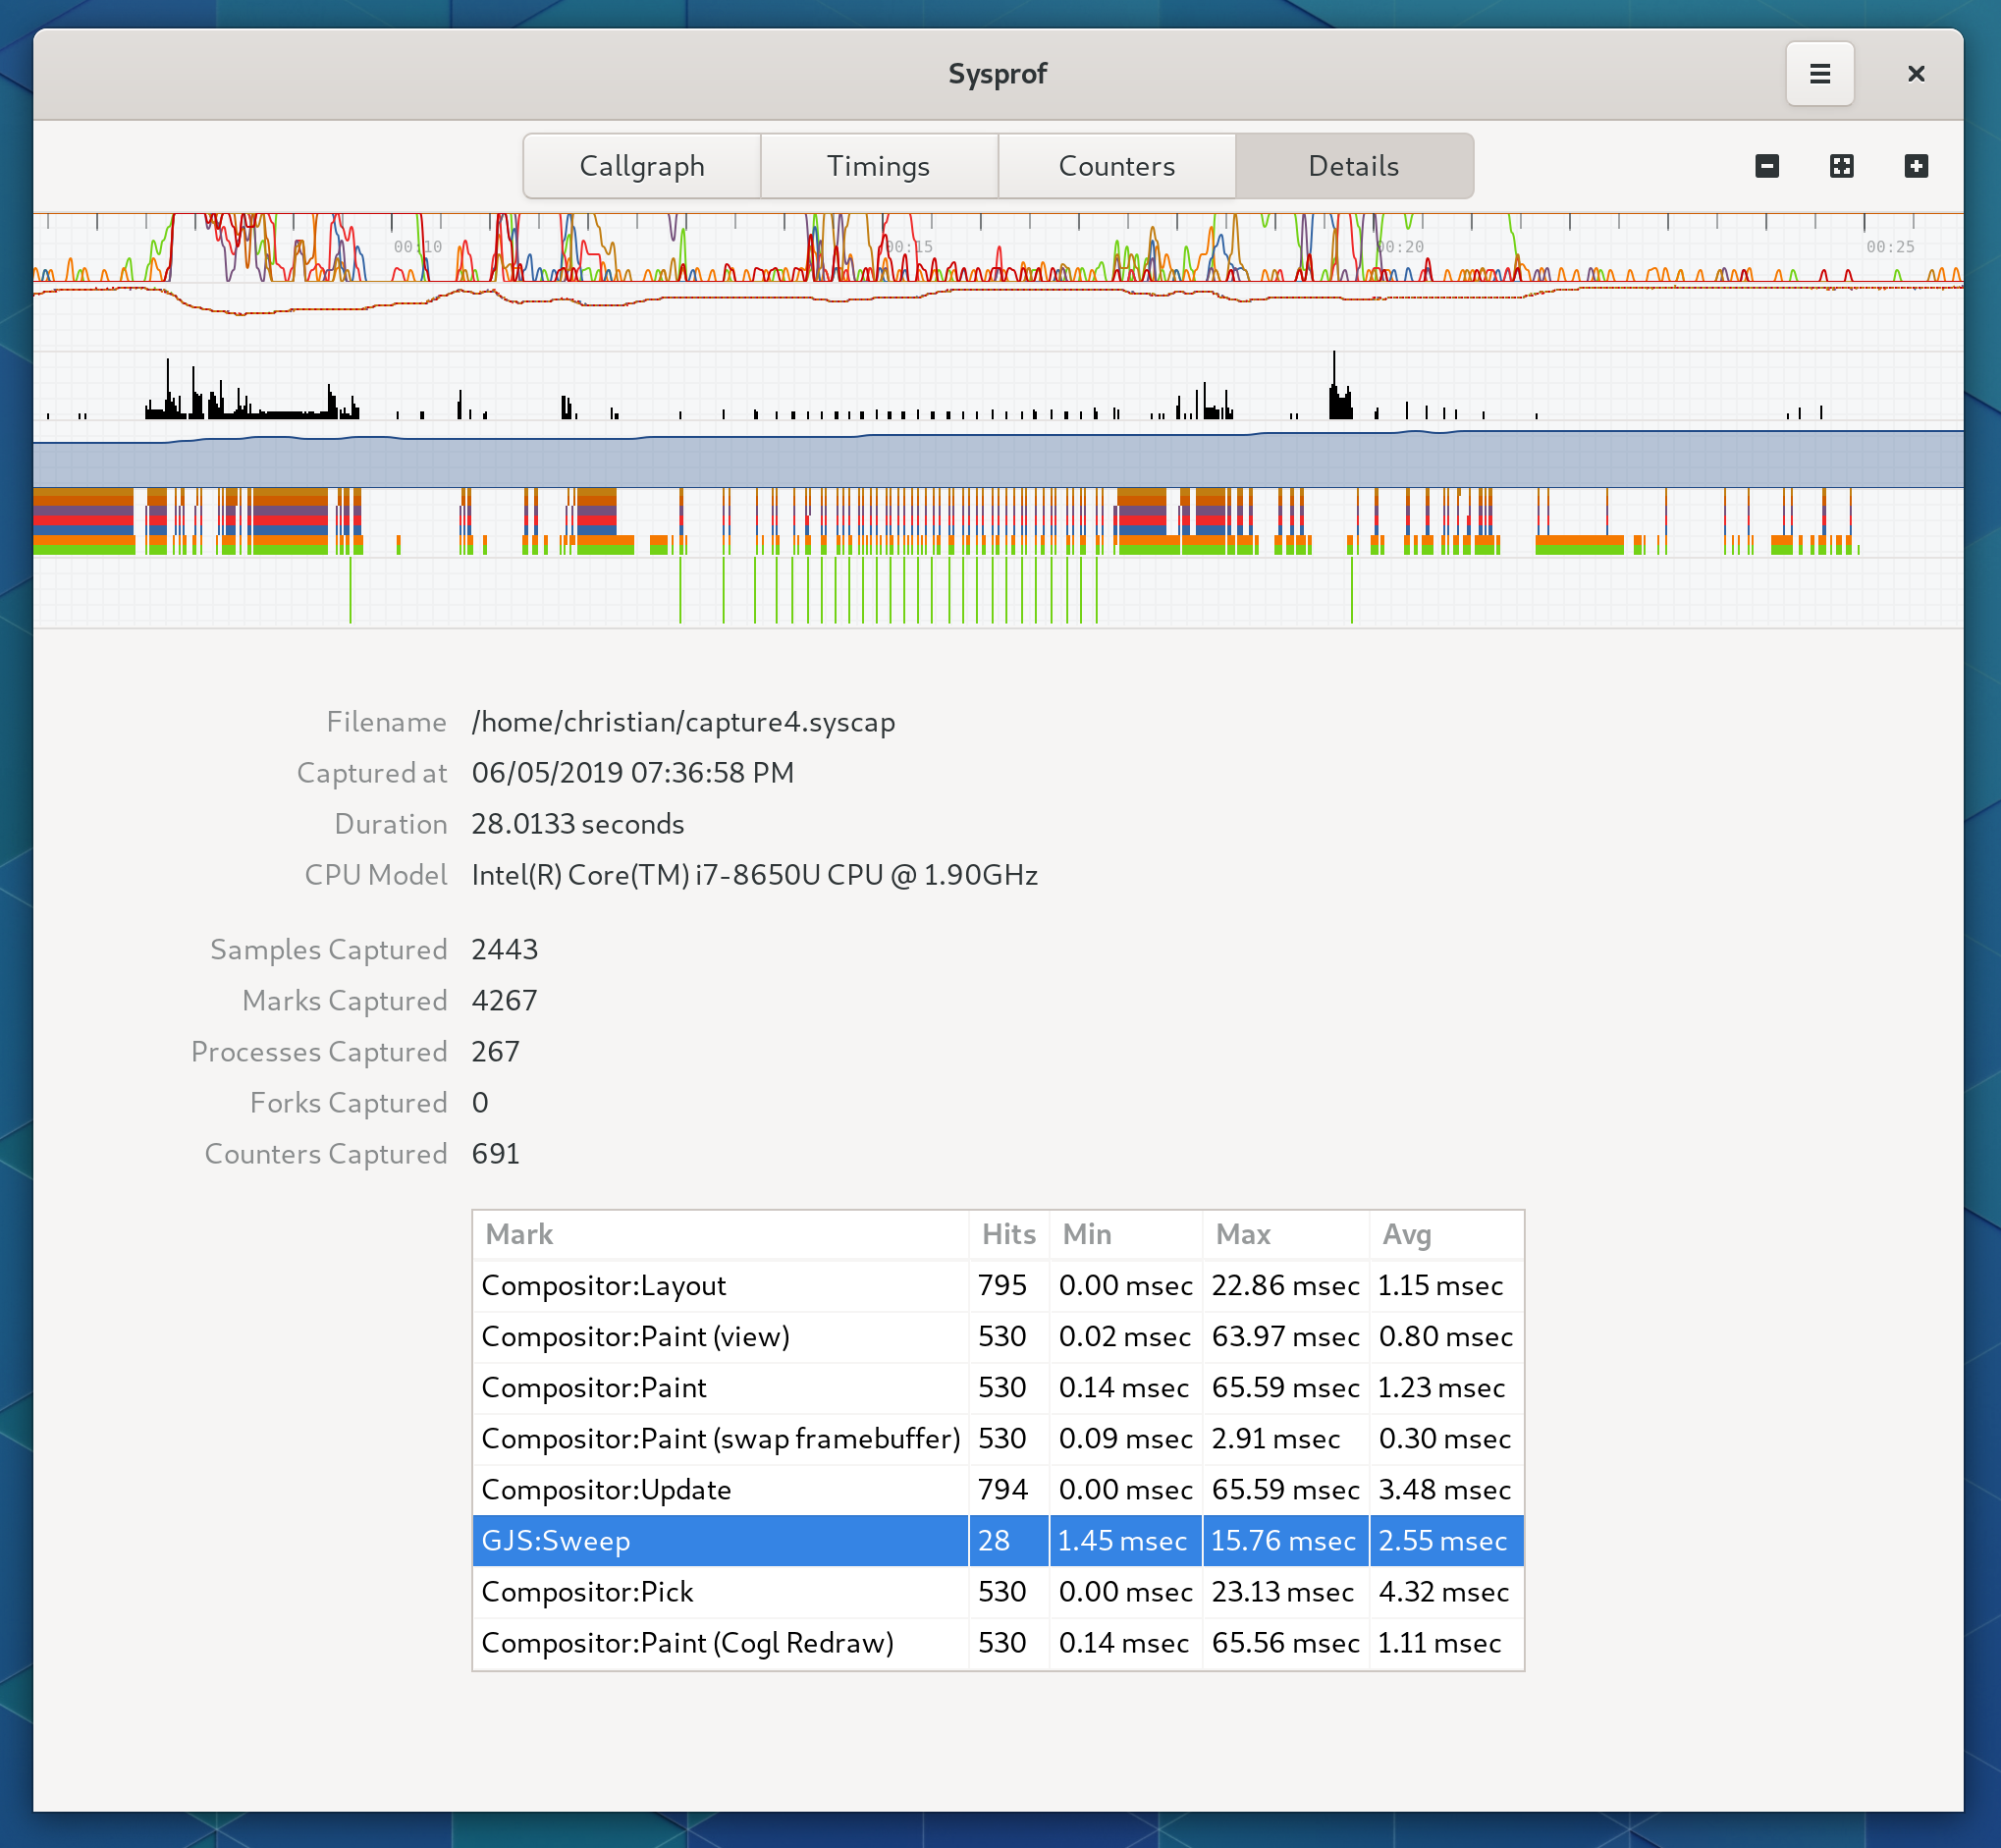
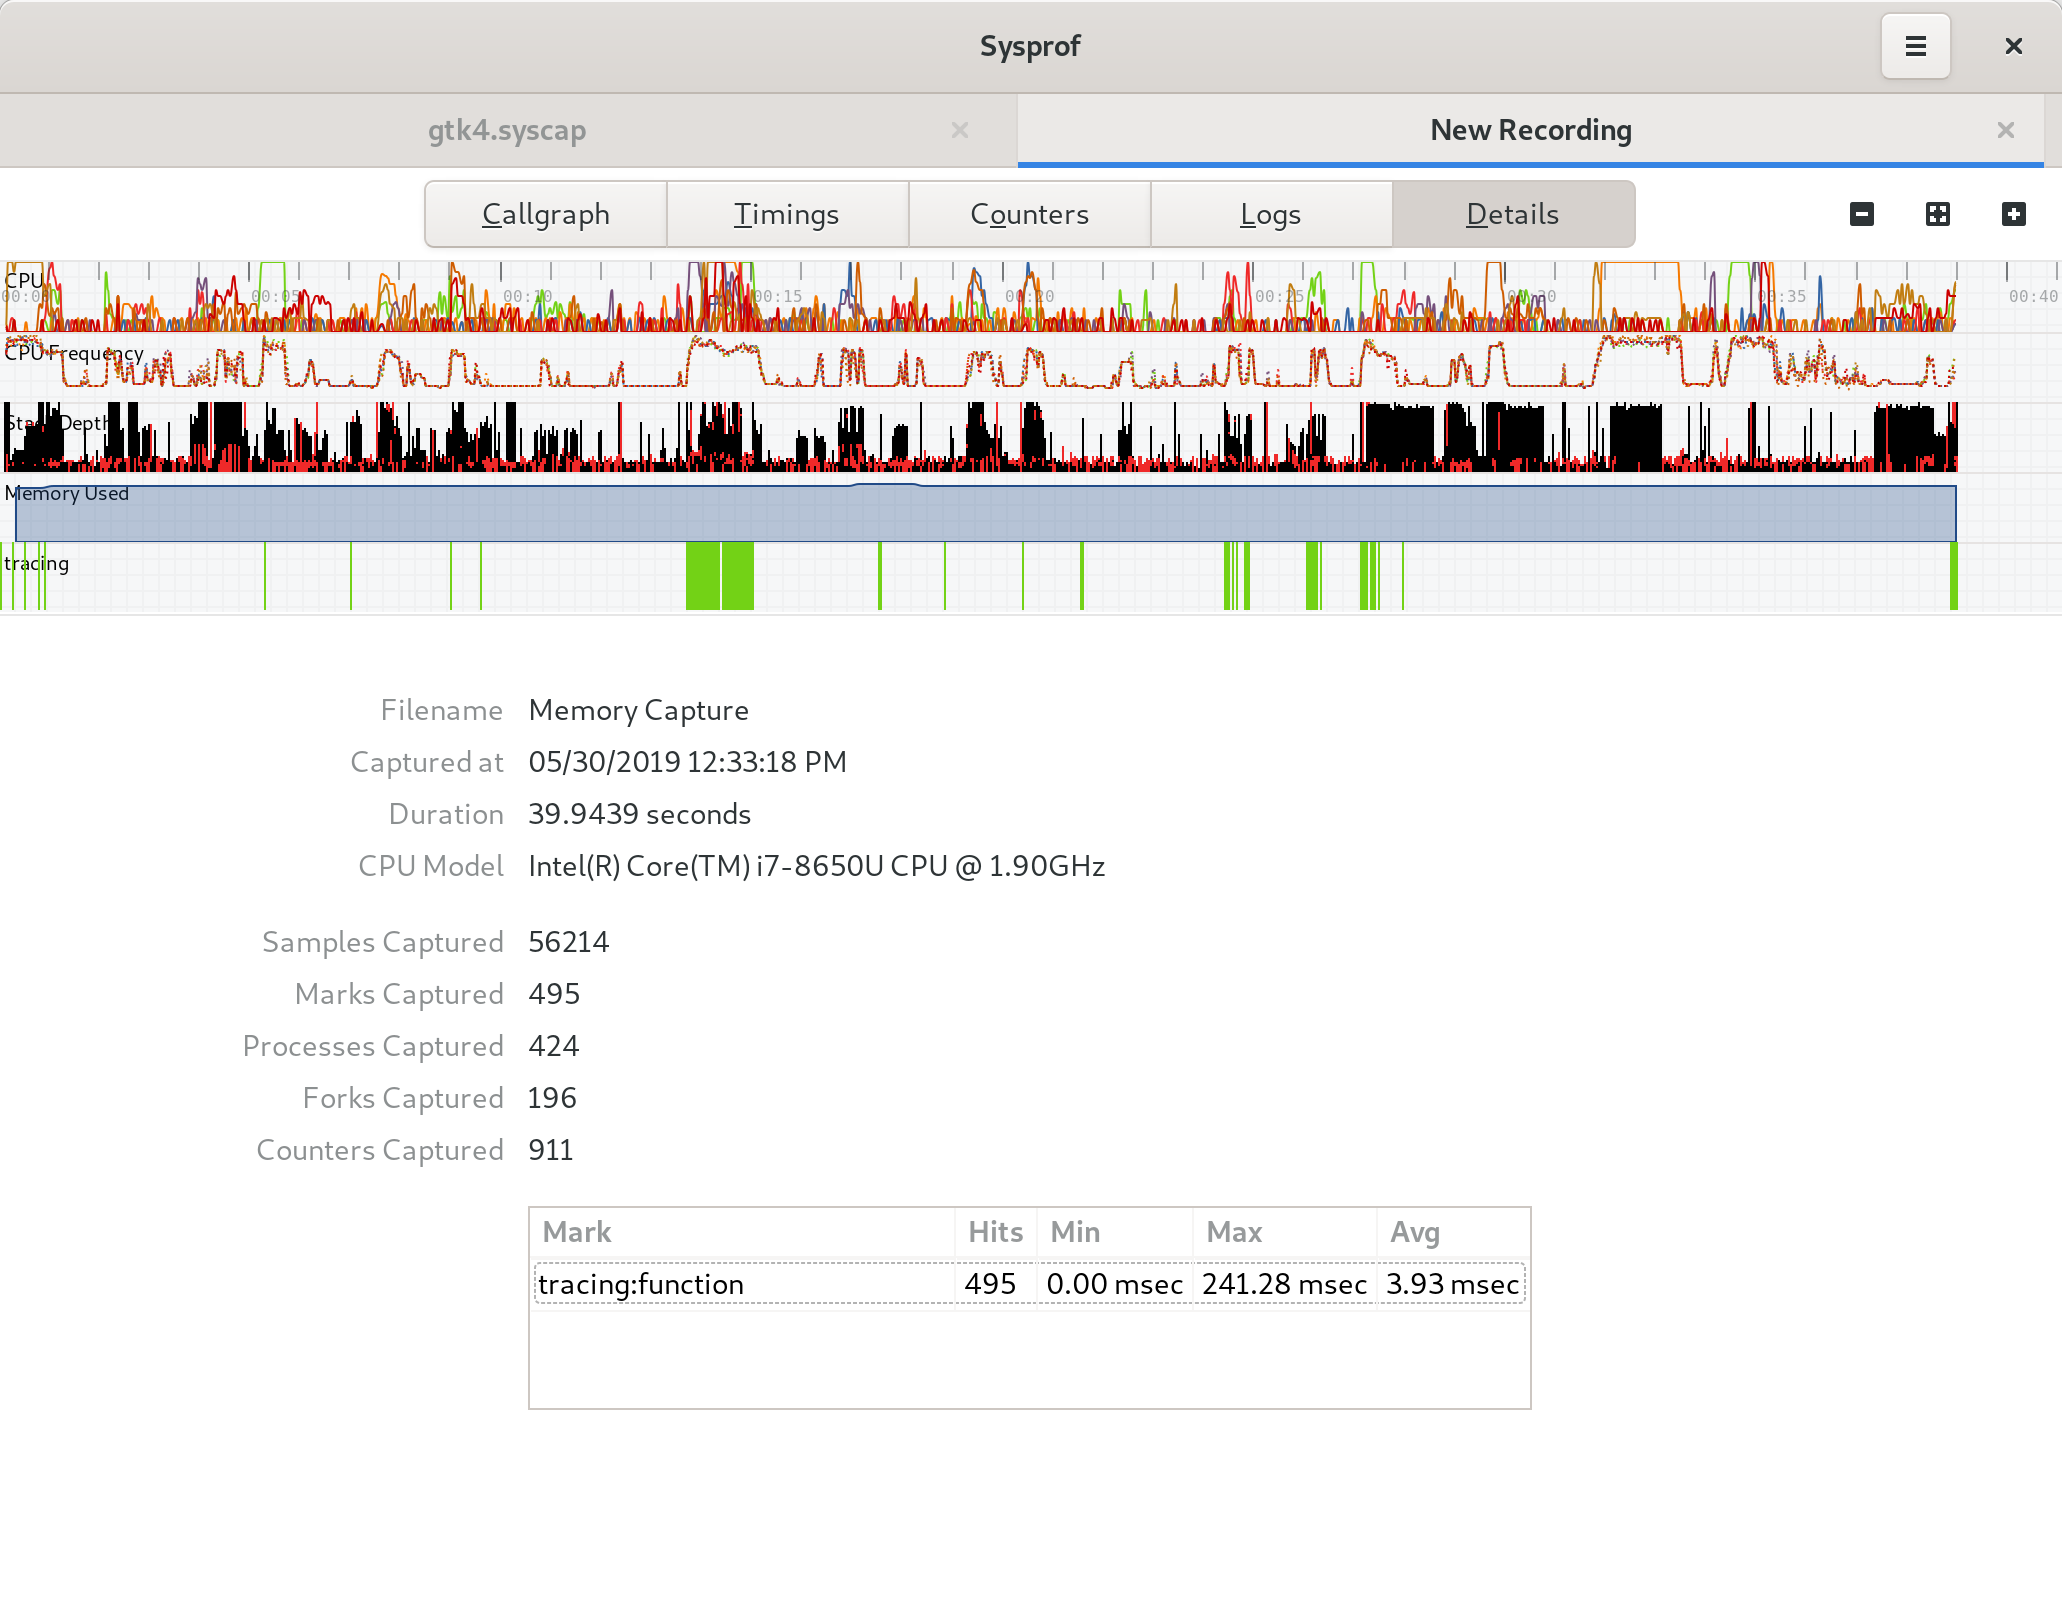
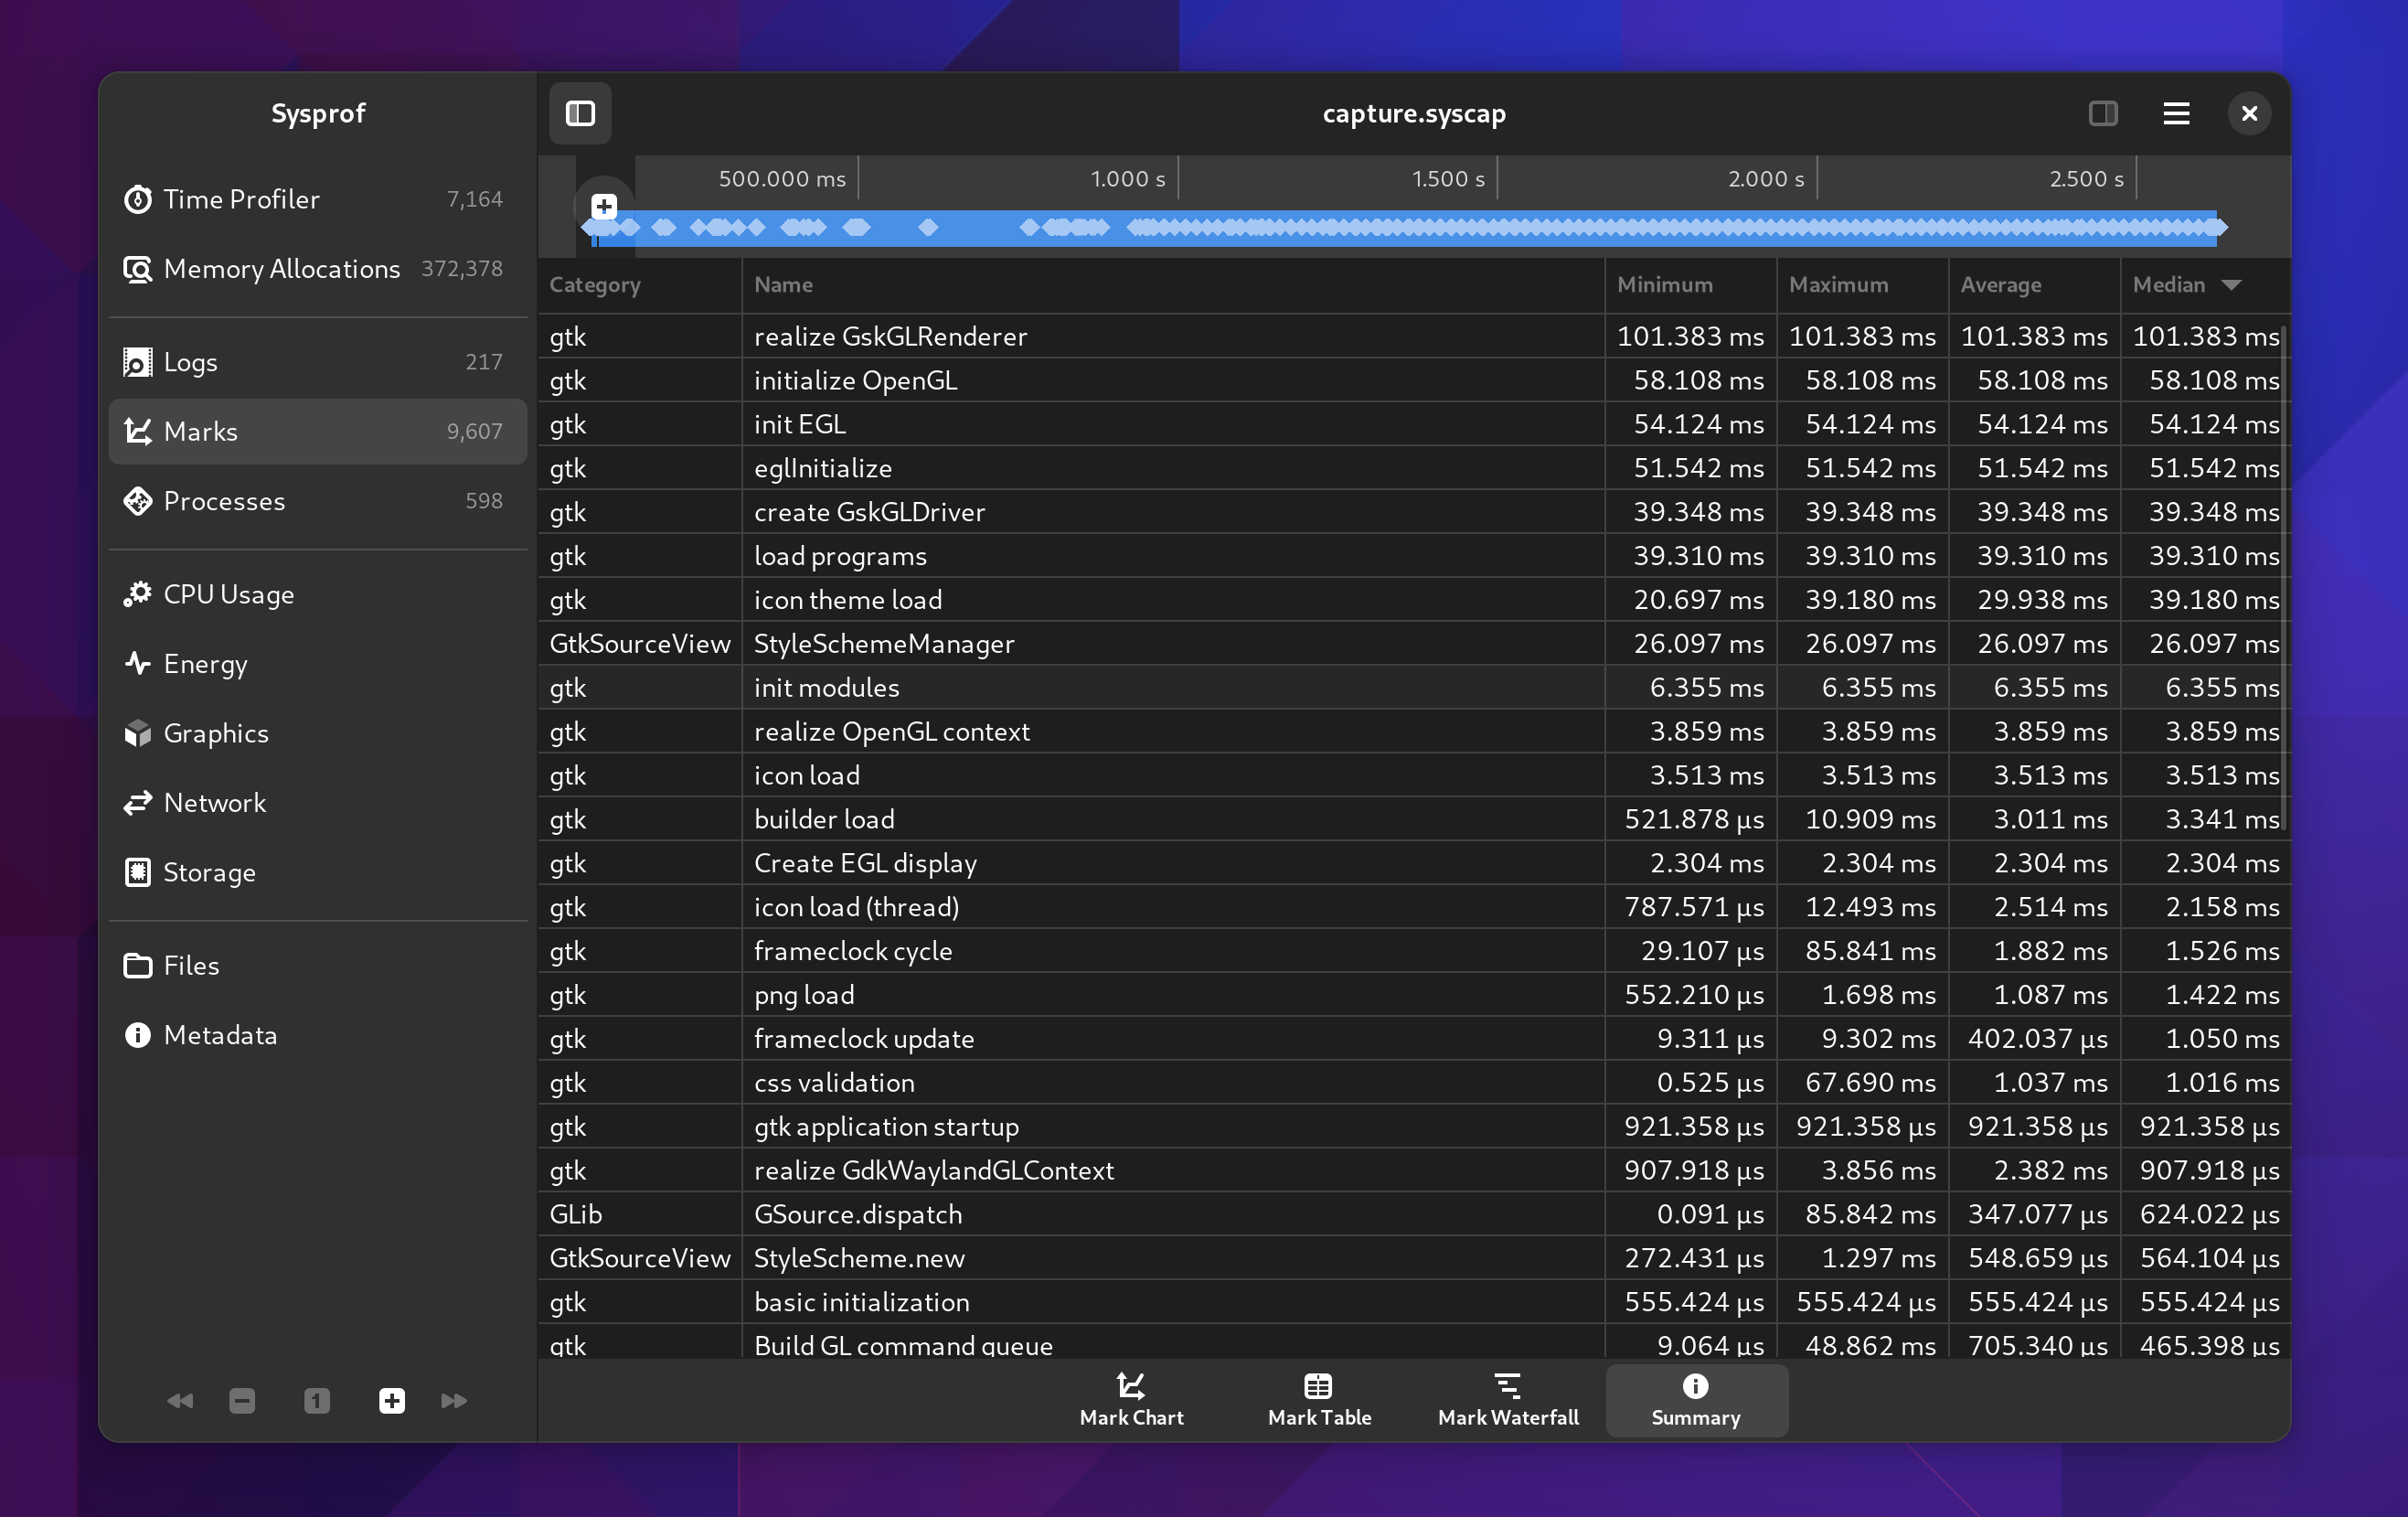
Marks Summary
It was a bit hidden before, but we still have a mark summary. Although I’ve beefed it up a bit and provide median values in addition to mean. These are also sortable like the other tables you’ll find in Sysprof.
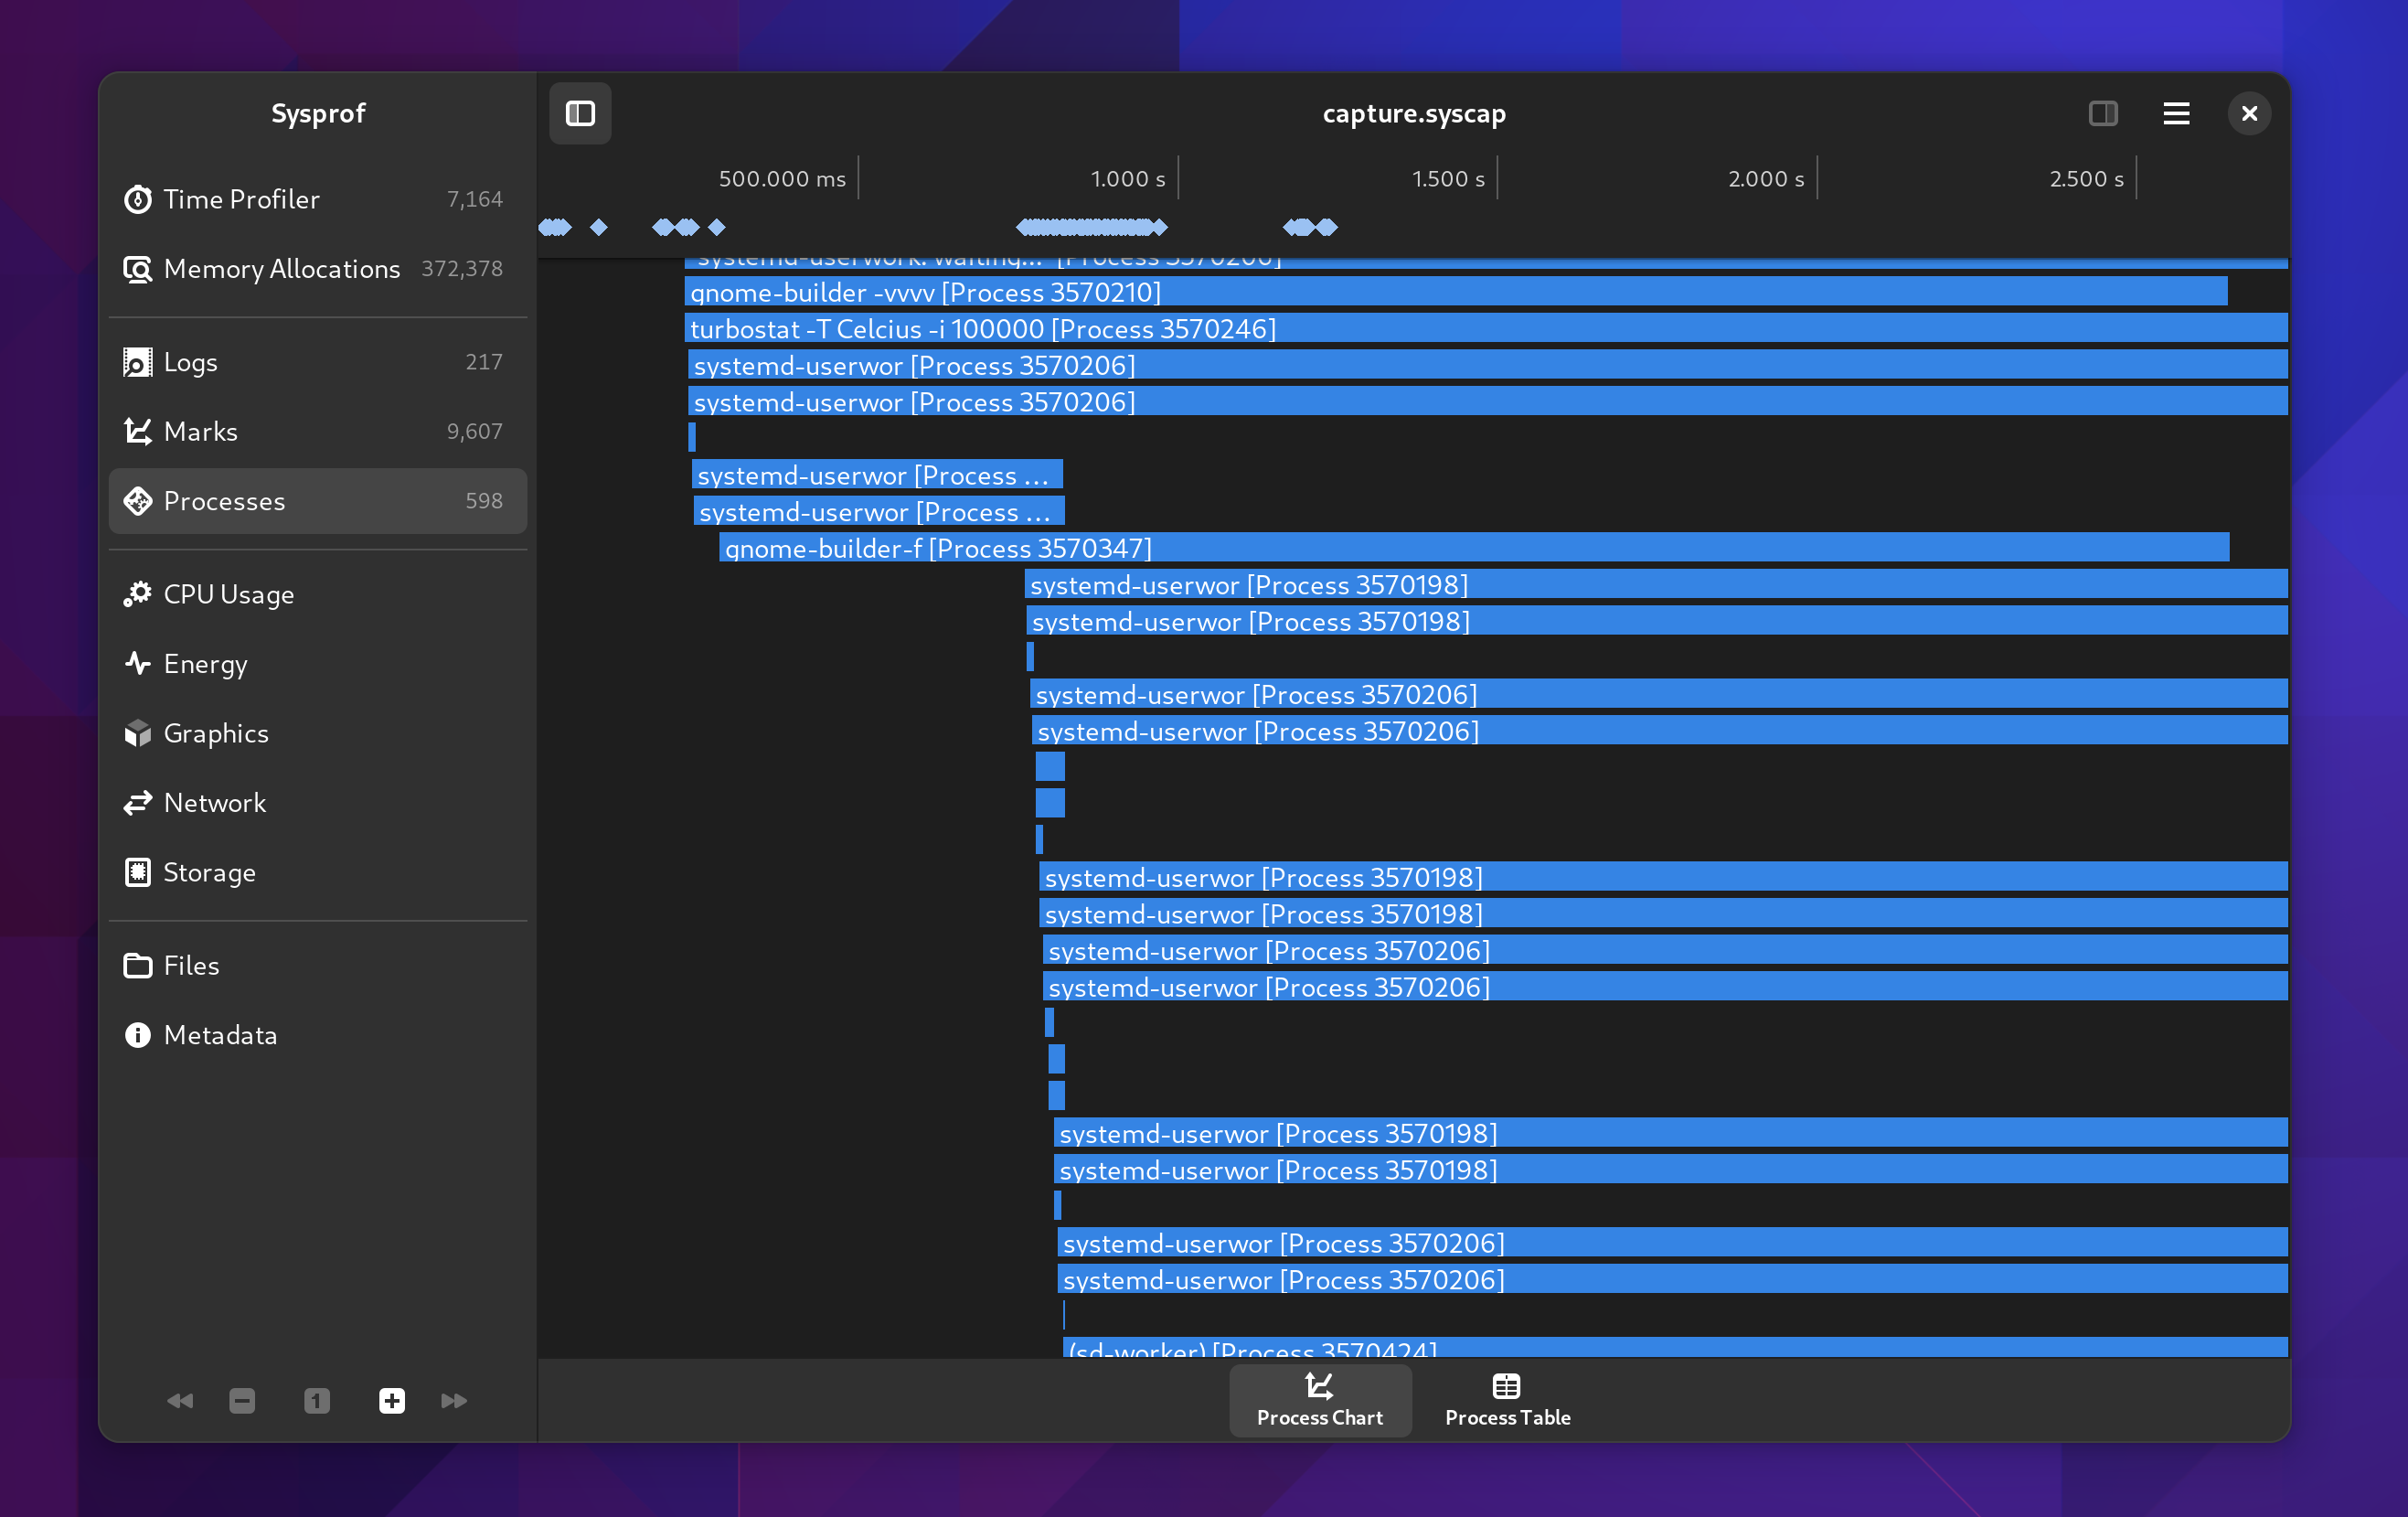
Processes
We now give you a bit more insight into the processes we discovered running during your capture. The new Processes section shows you a timeline of the processes that ran.
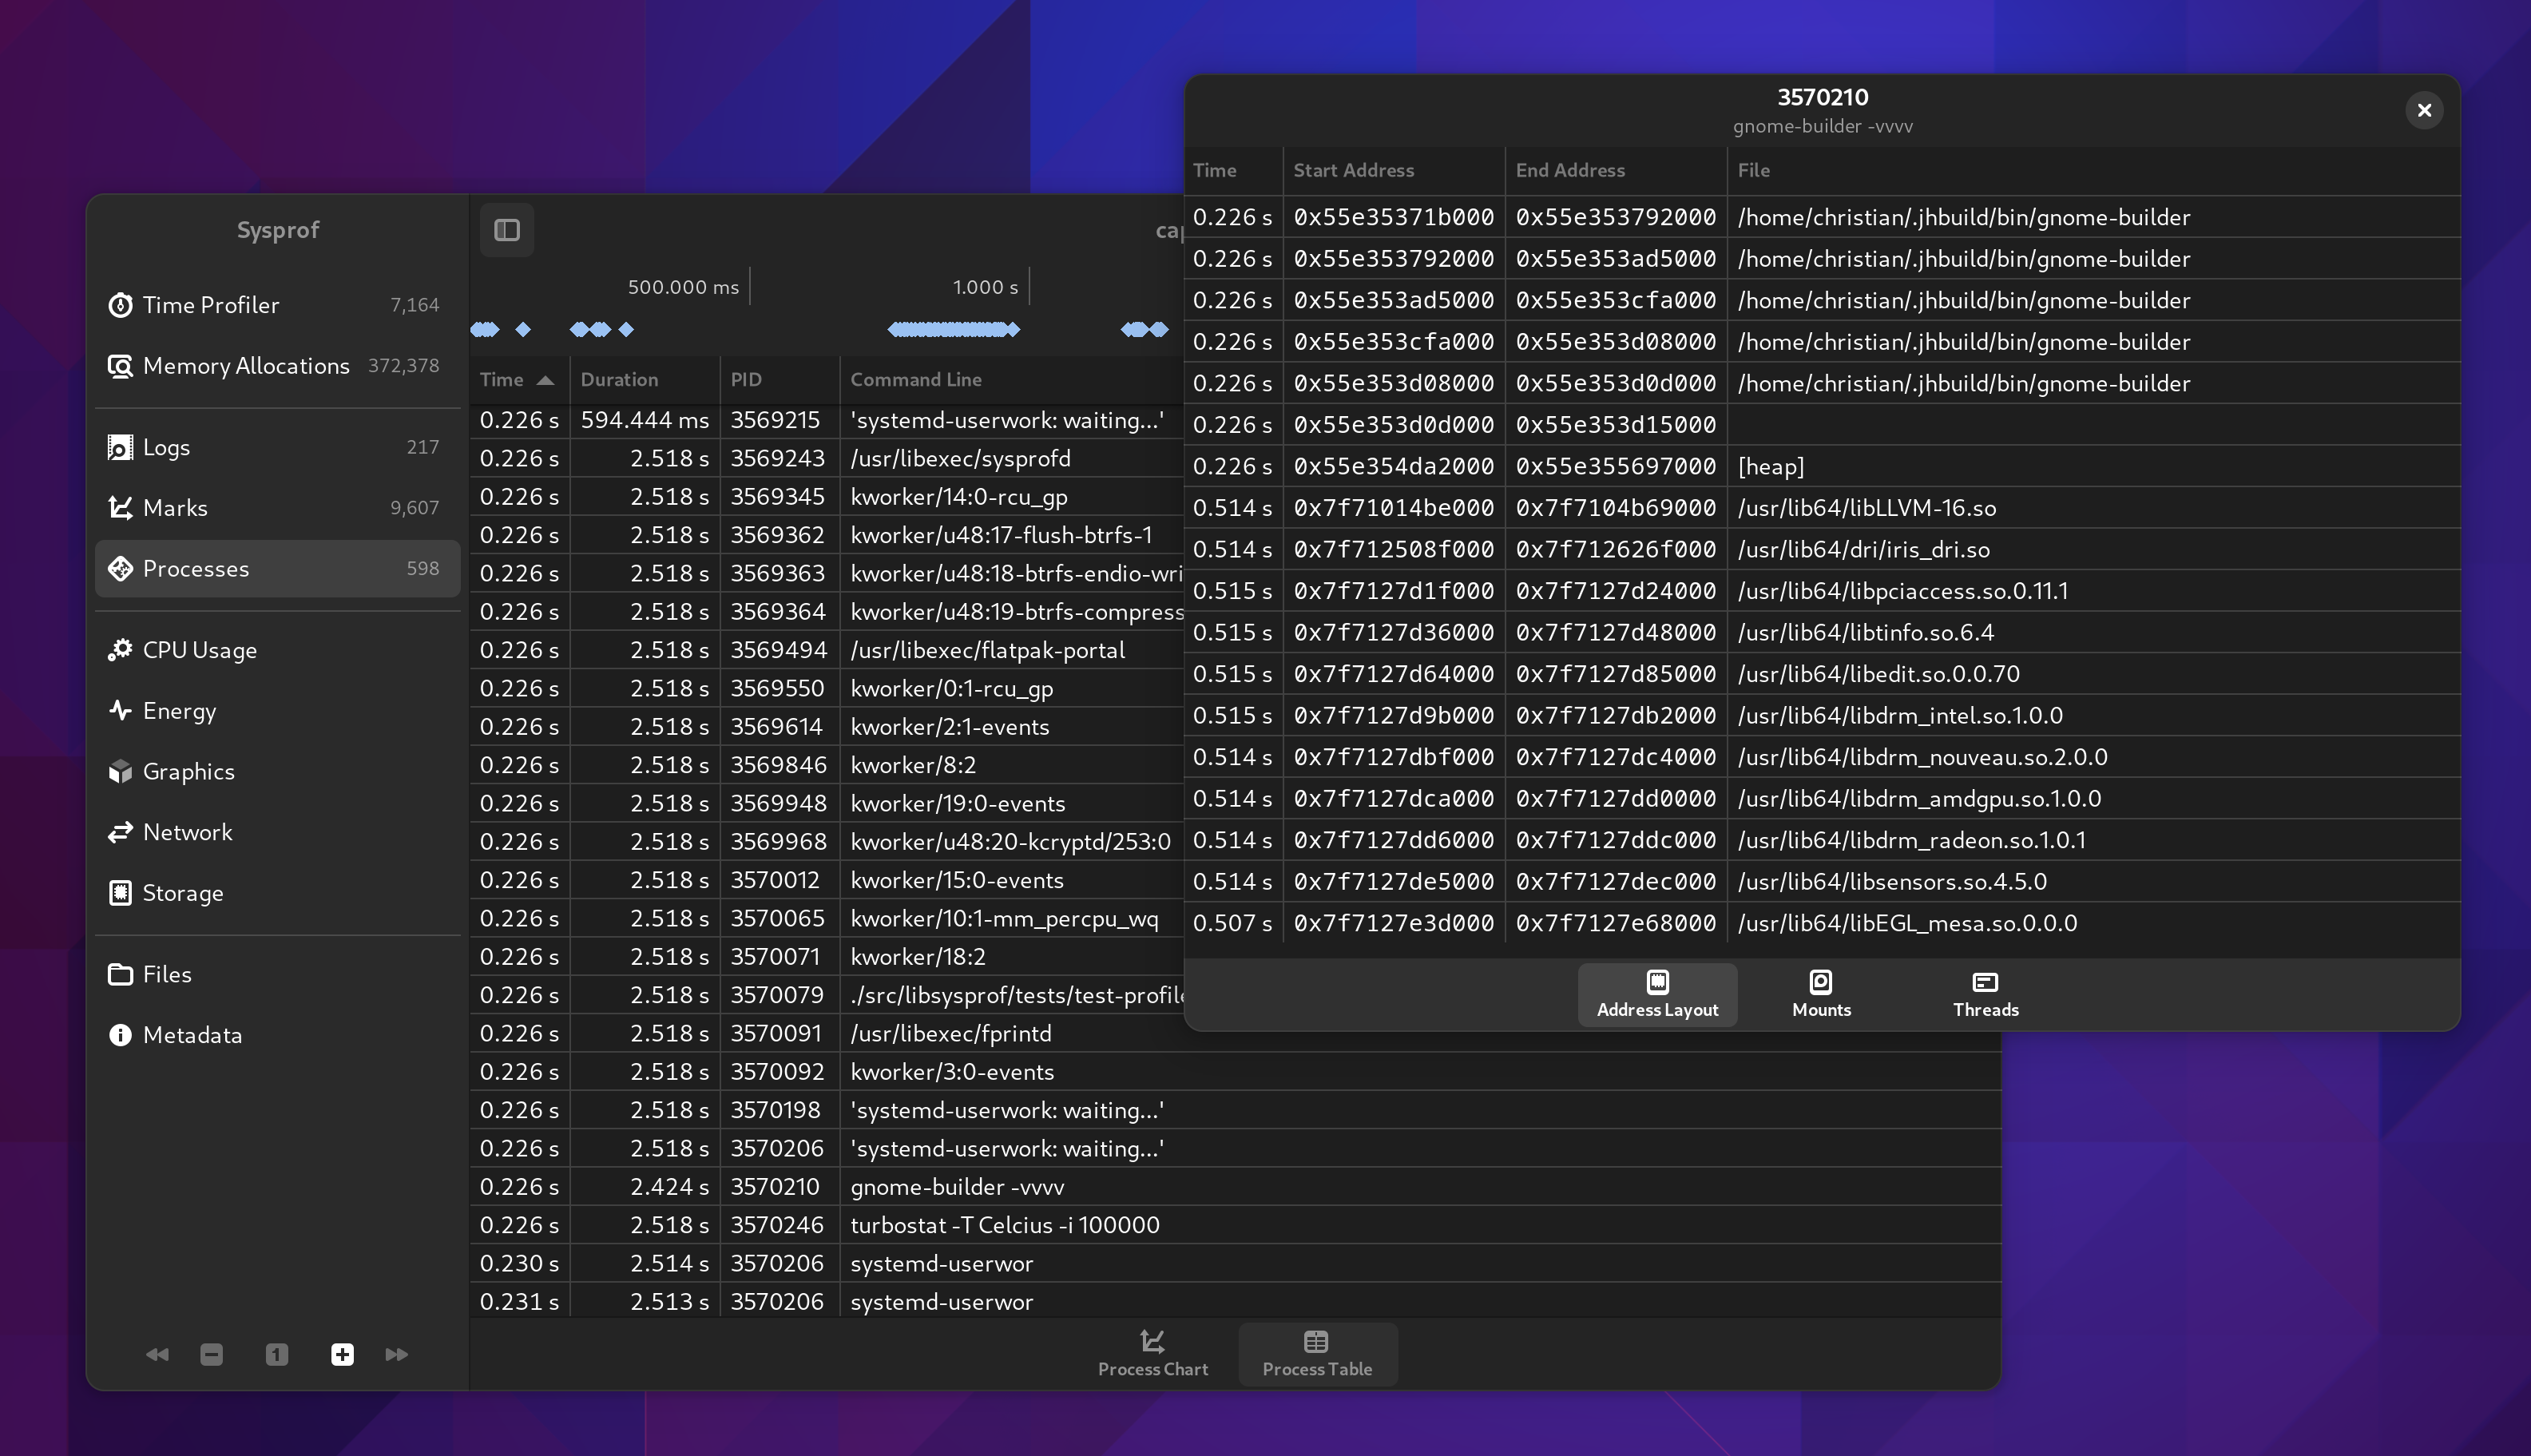
Additionally there is a table view, again more accessible and sometimes easier to read, sort, and analyze. If you double click a row you’ll get additional information on that process such as the address layout, mounts, and thread information we have.
This is all information that Sysprof collects to be able to do it’s job as a profiler and we might as well make that available to you too.
D-Bus Messages
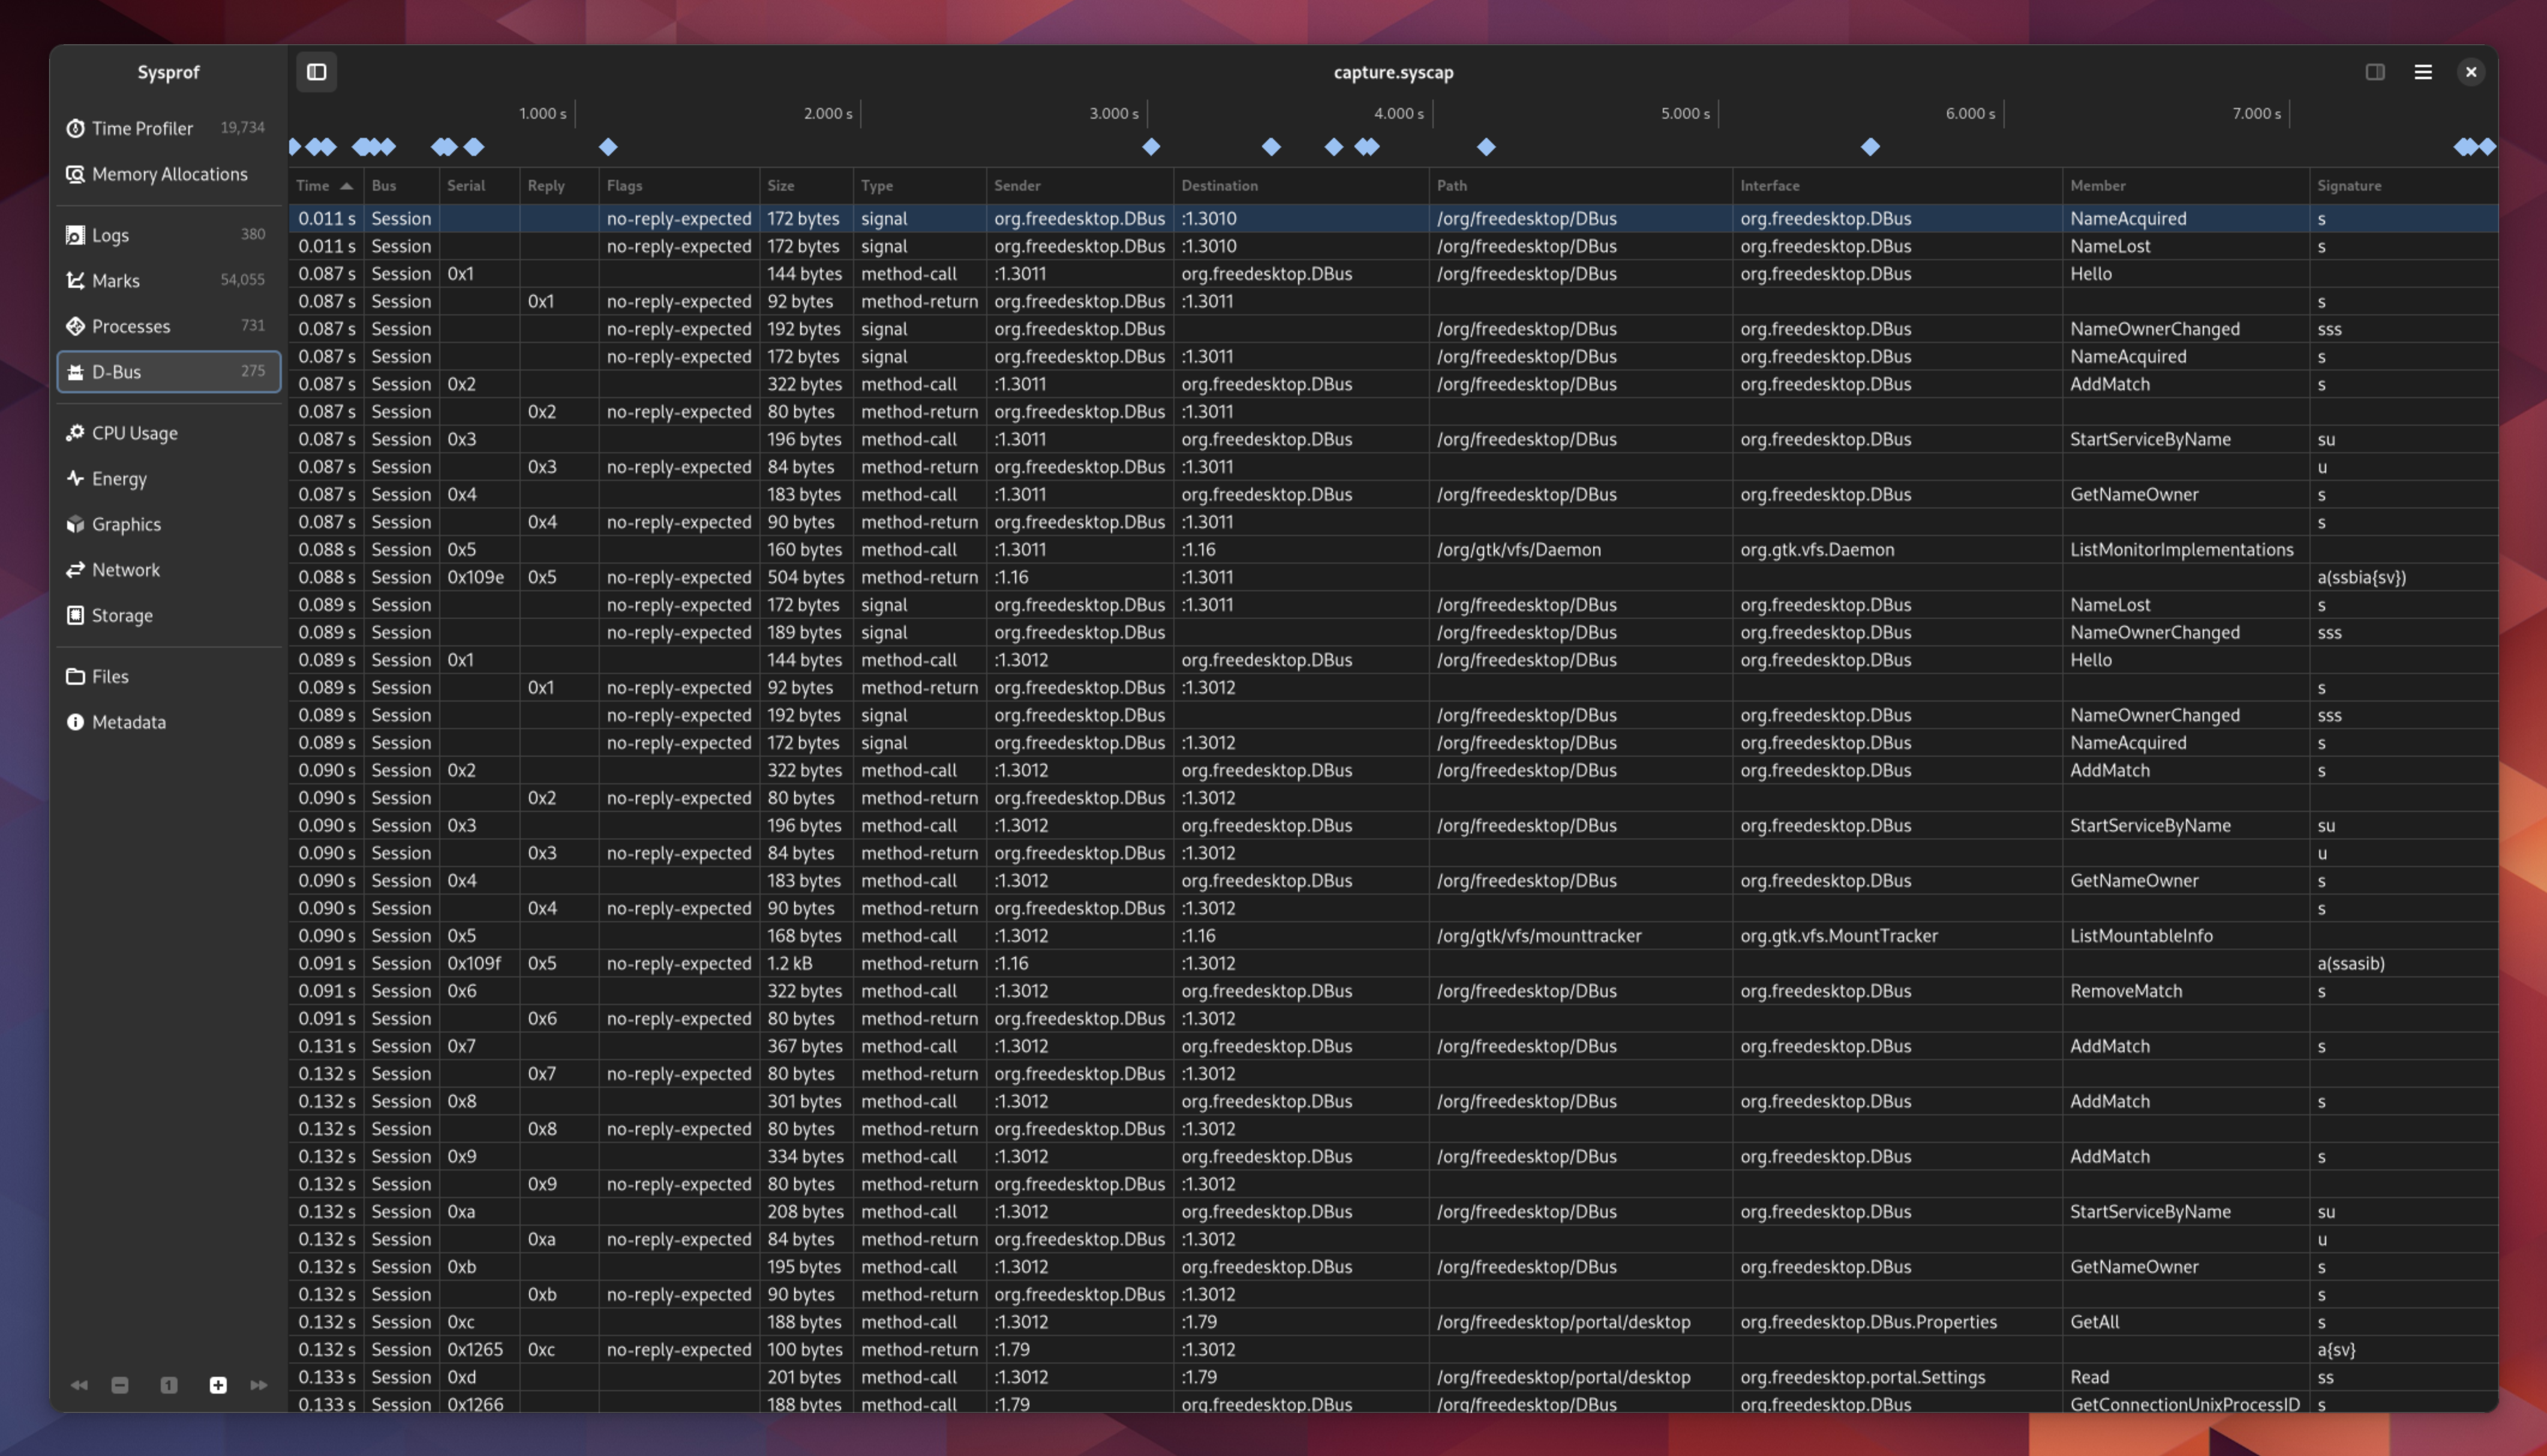
You can record D-Bus messages on your session or system bus now. We may end up needing to tweak how we get access to the system bus so that you are more certain to have privileges beyond just listening from your read socket.
There are no fancy viewers like Bustle yet, but you do have a table of messages. Someone could use this as a basis to connect the reply message with the send message so that you can draw proper message durations in a chart.
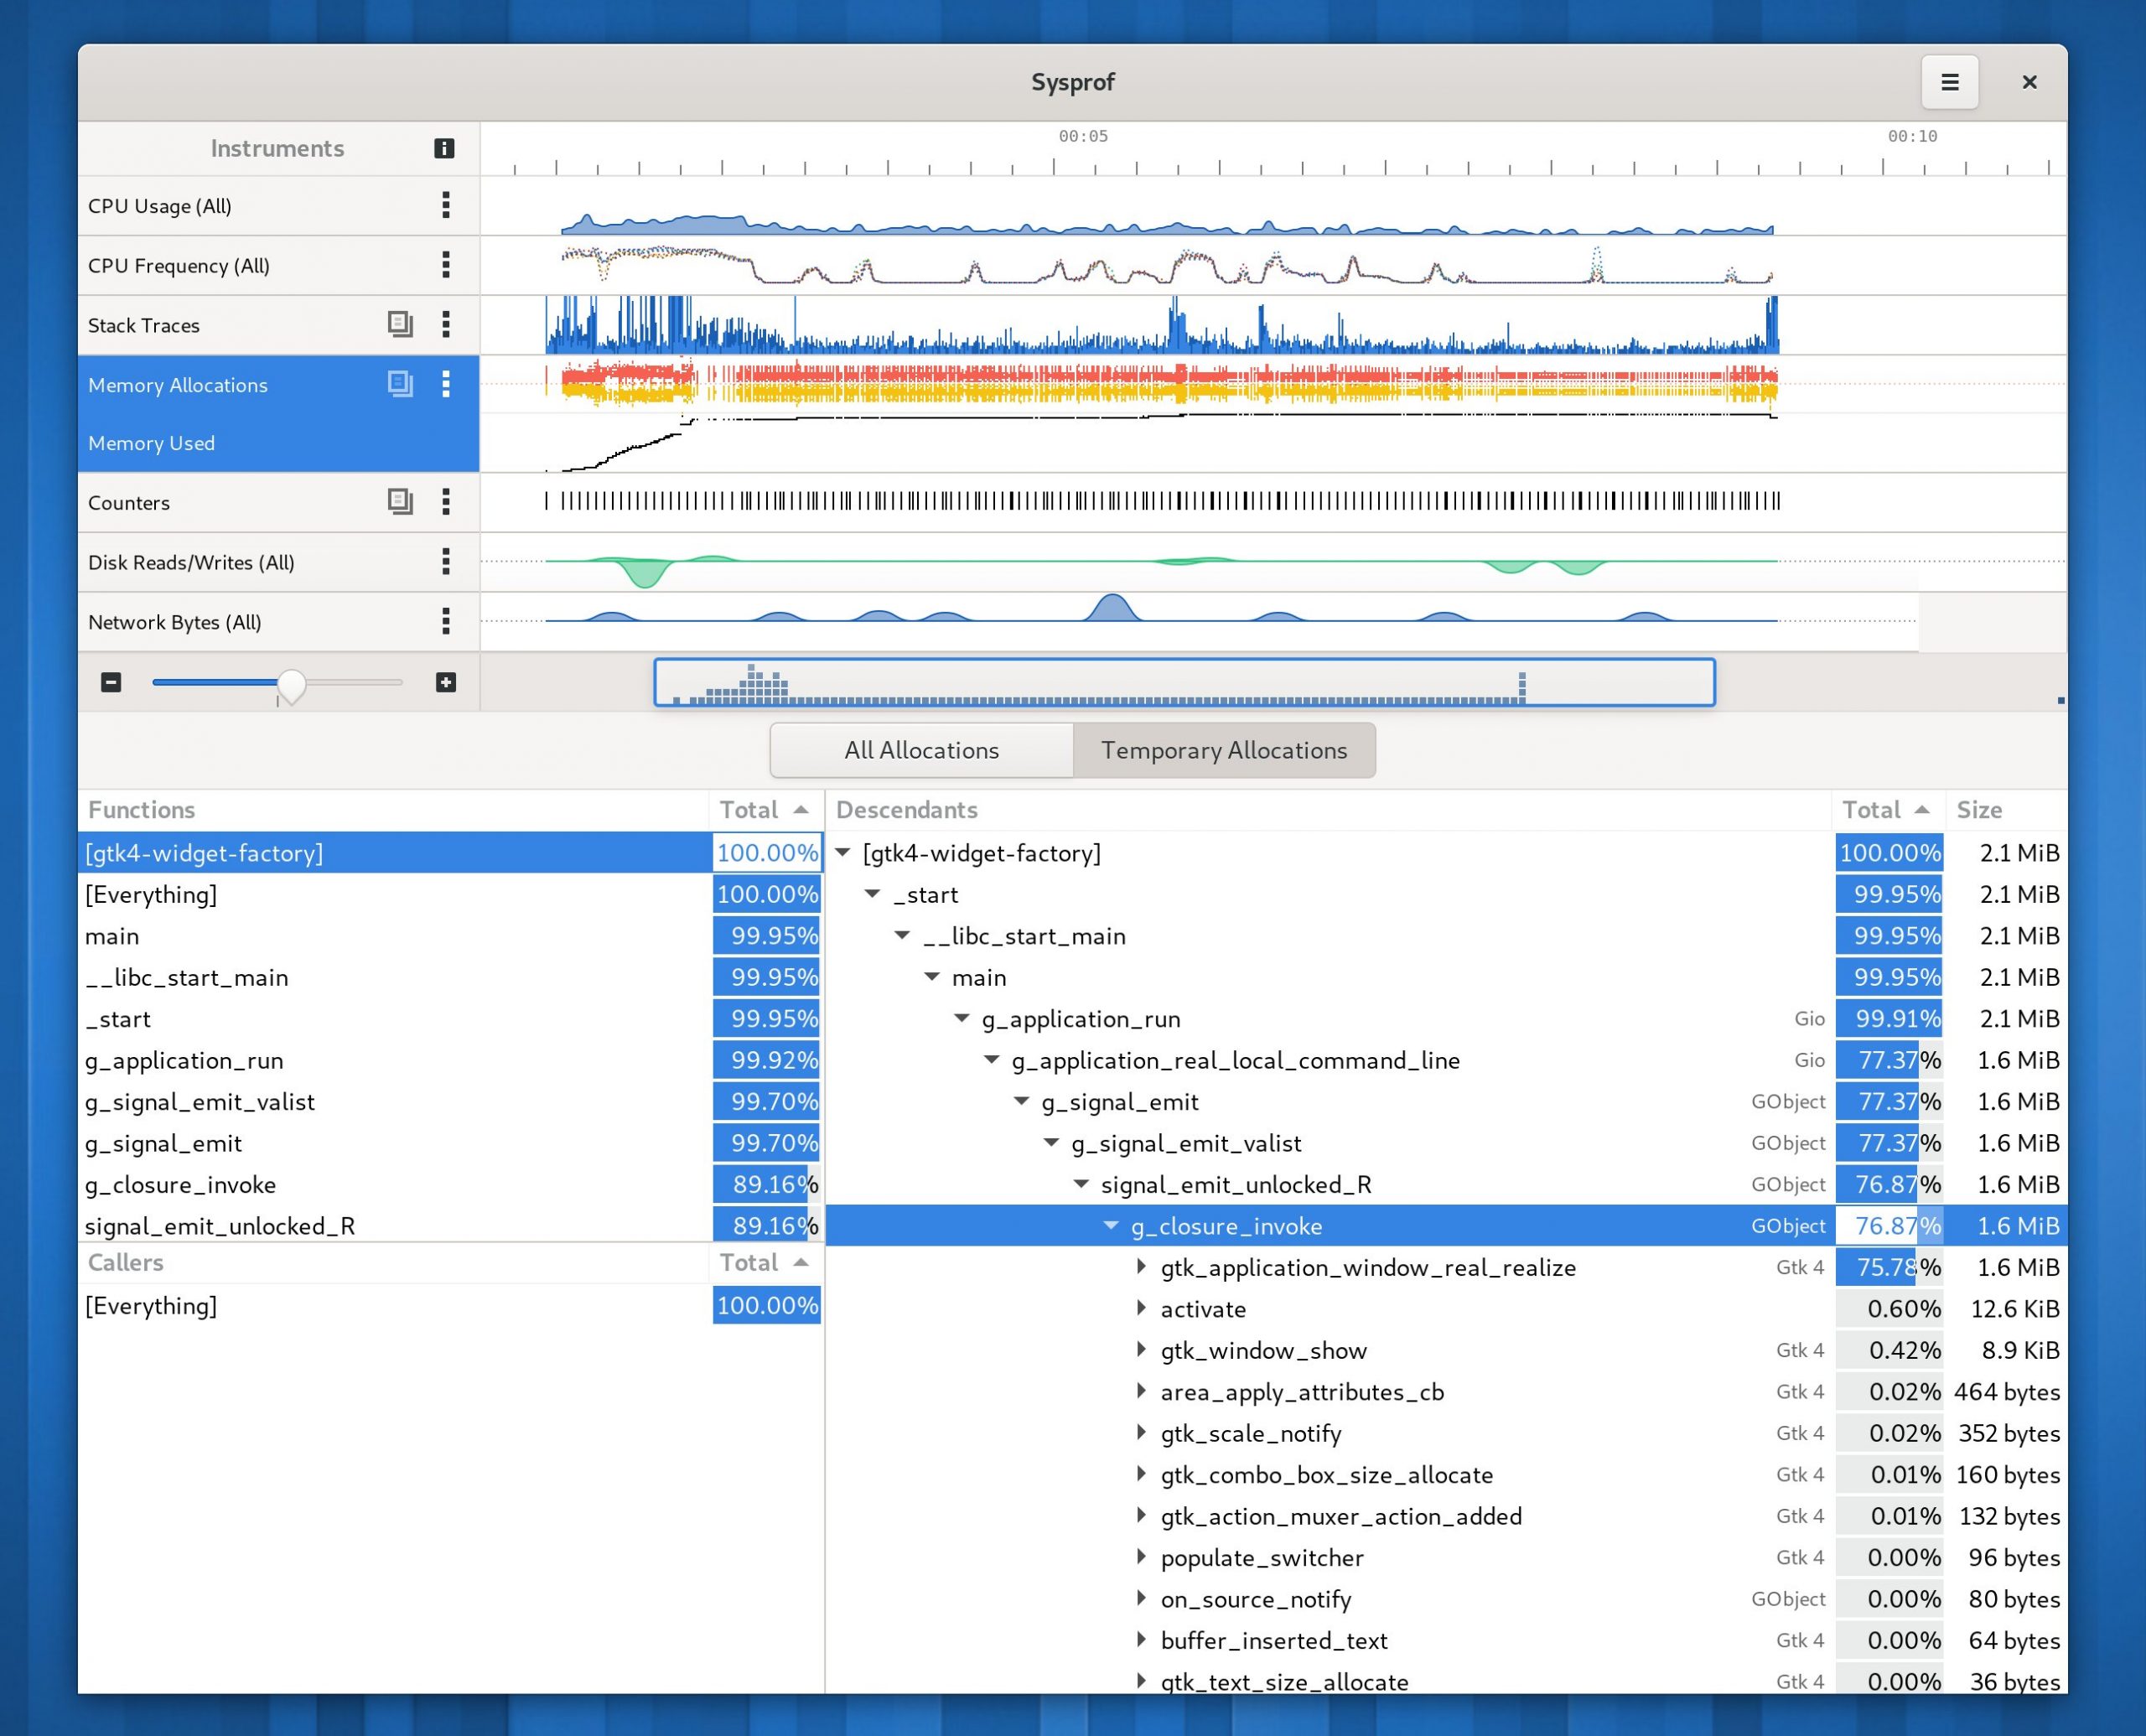
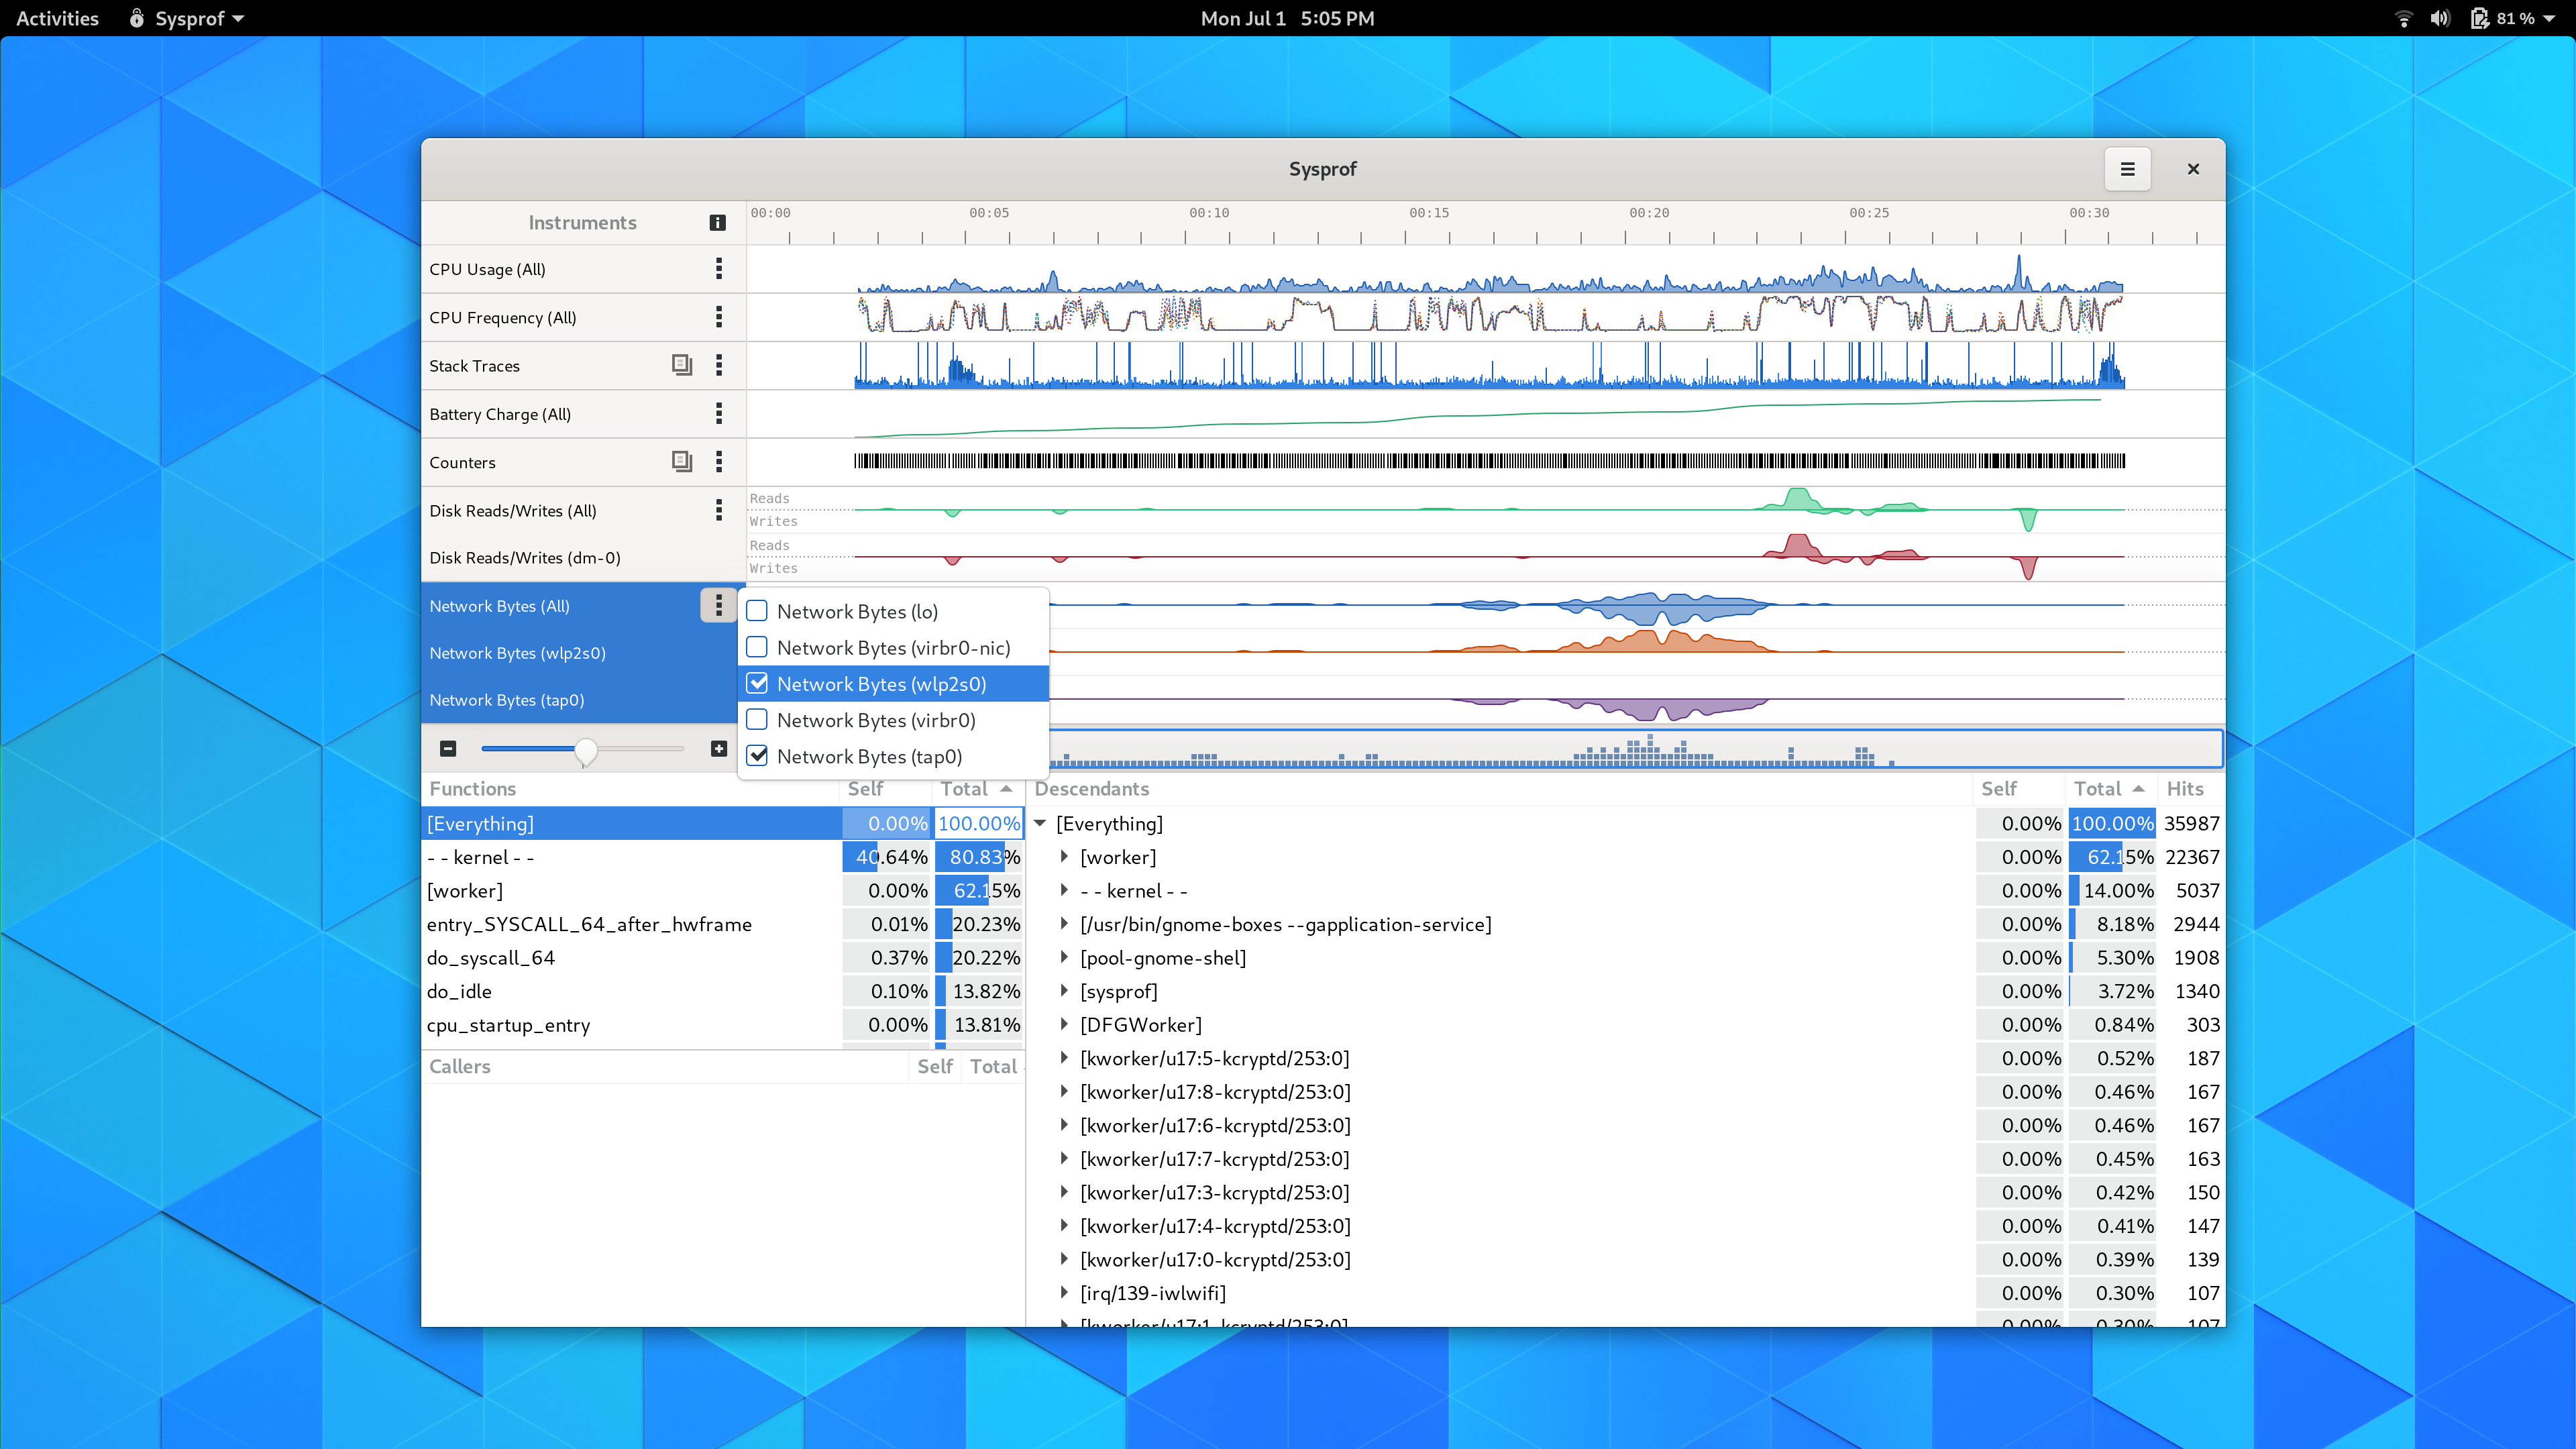
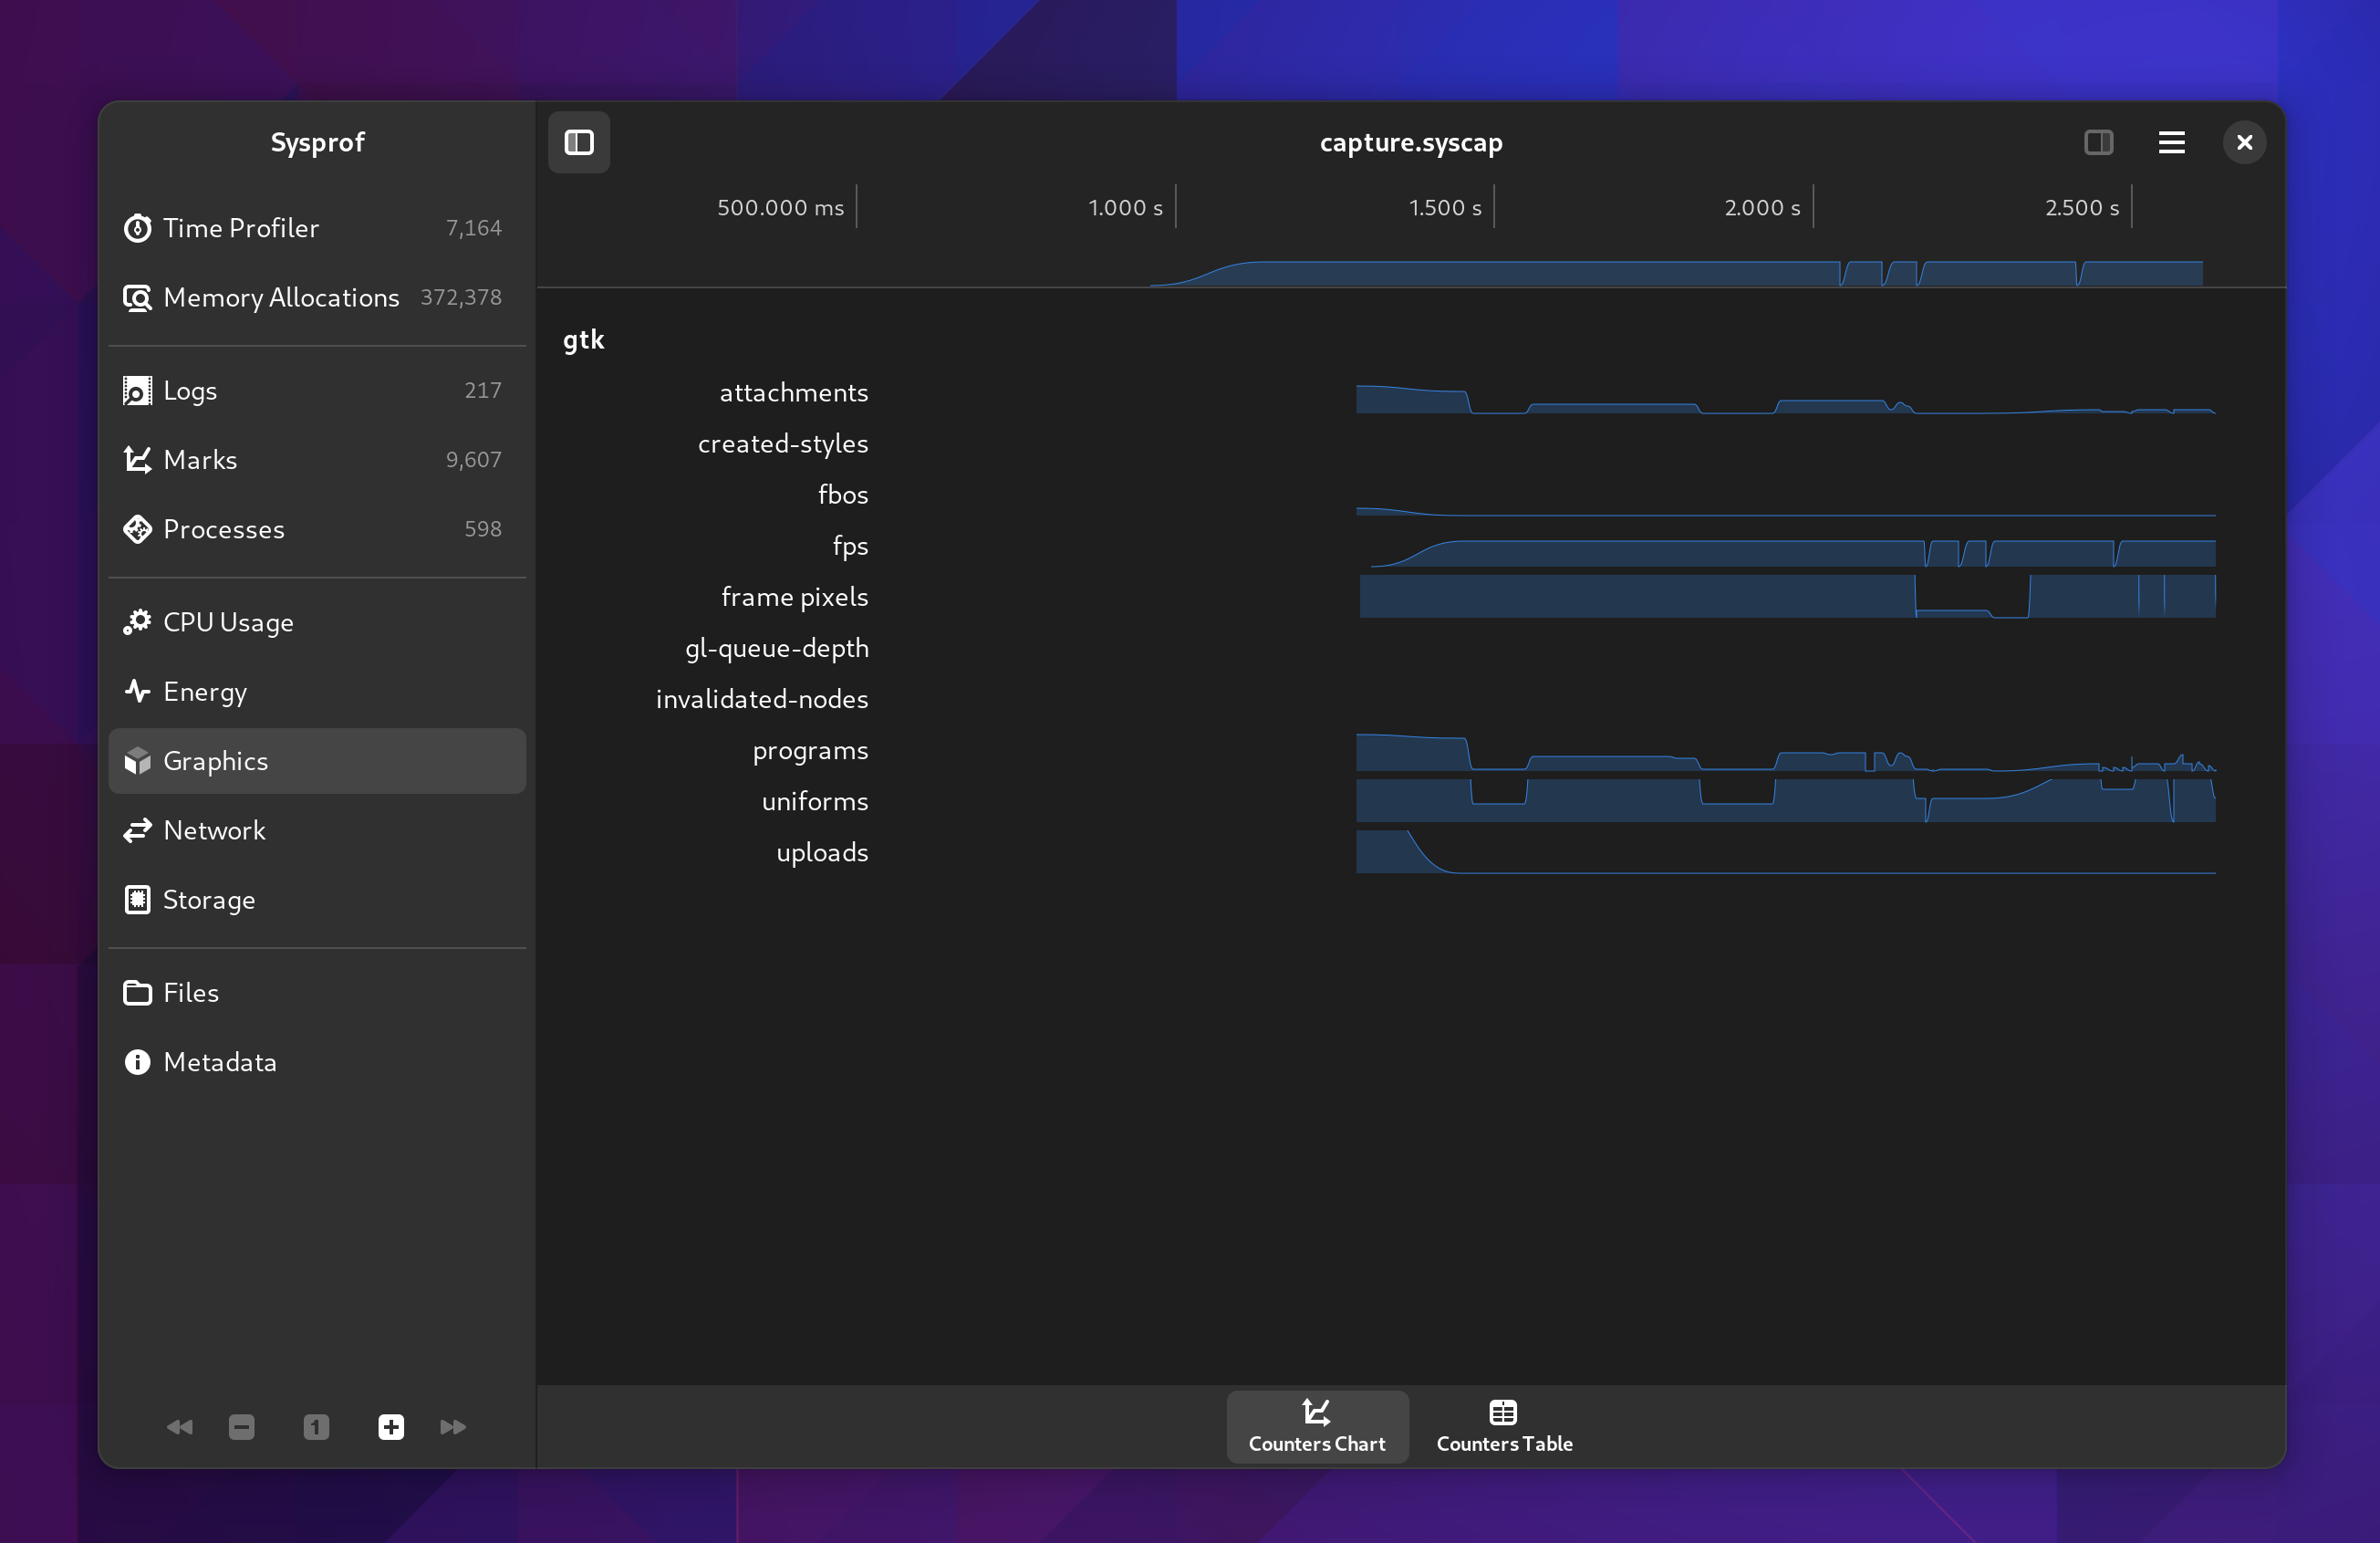
Counters
Counters have been broken up a bit more so that we can expand on them going forward. Different sections have different additional data to view. For example the CPU section will give you the CPU breakdown we recorded such as processor model and what CPU id maps to what core.
I find it strange that my Xeon skips core 6 and 7.
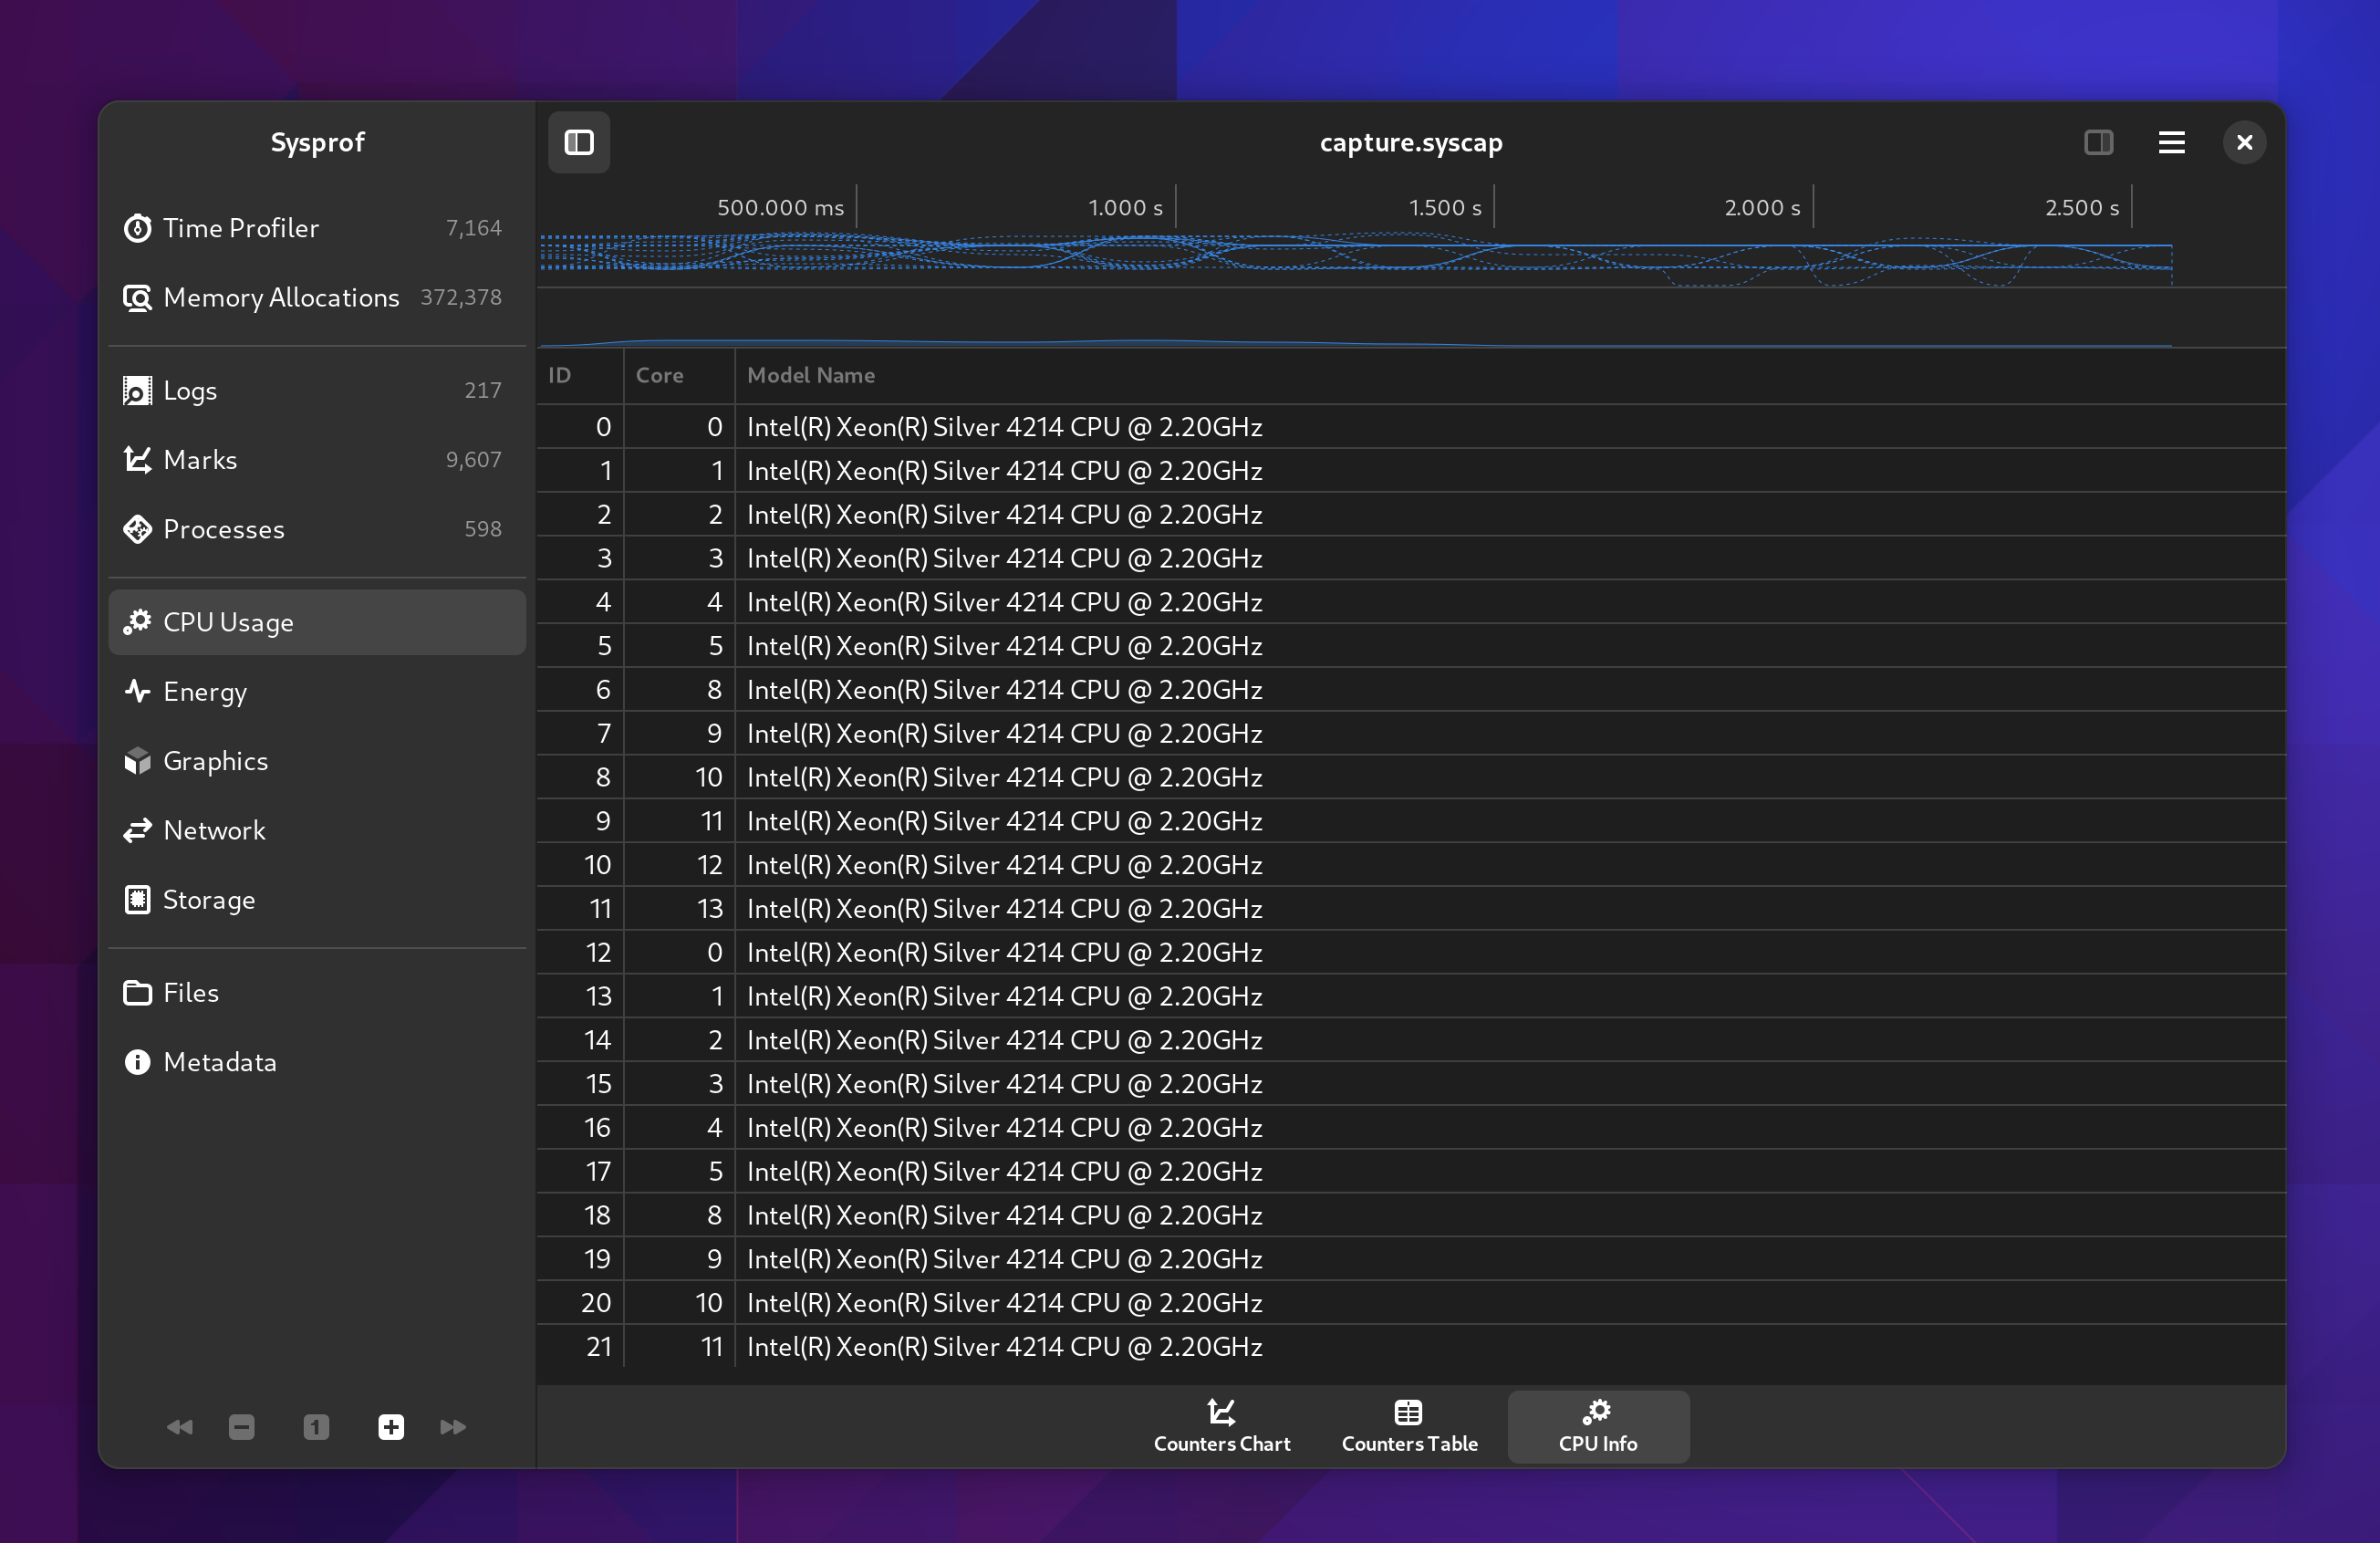
There are all the same counters we had previously for CPU, Energy (RAPL), Battery Charge, Disk I/O, Network I/O, and GTK counters such as FPS.
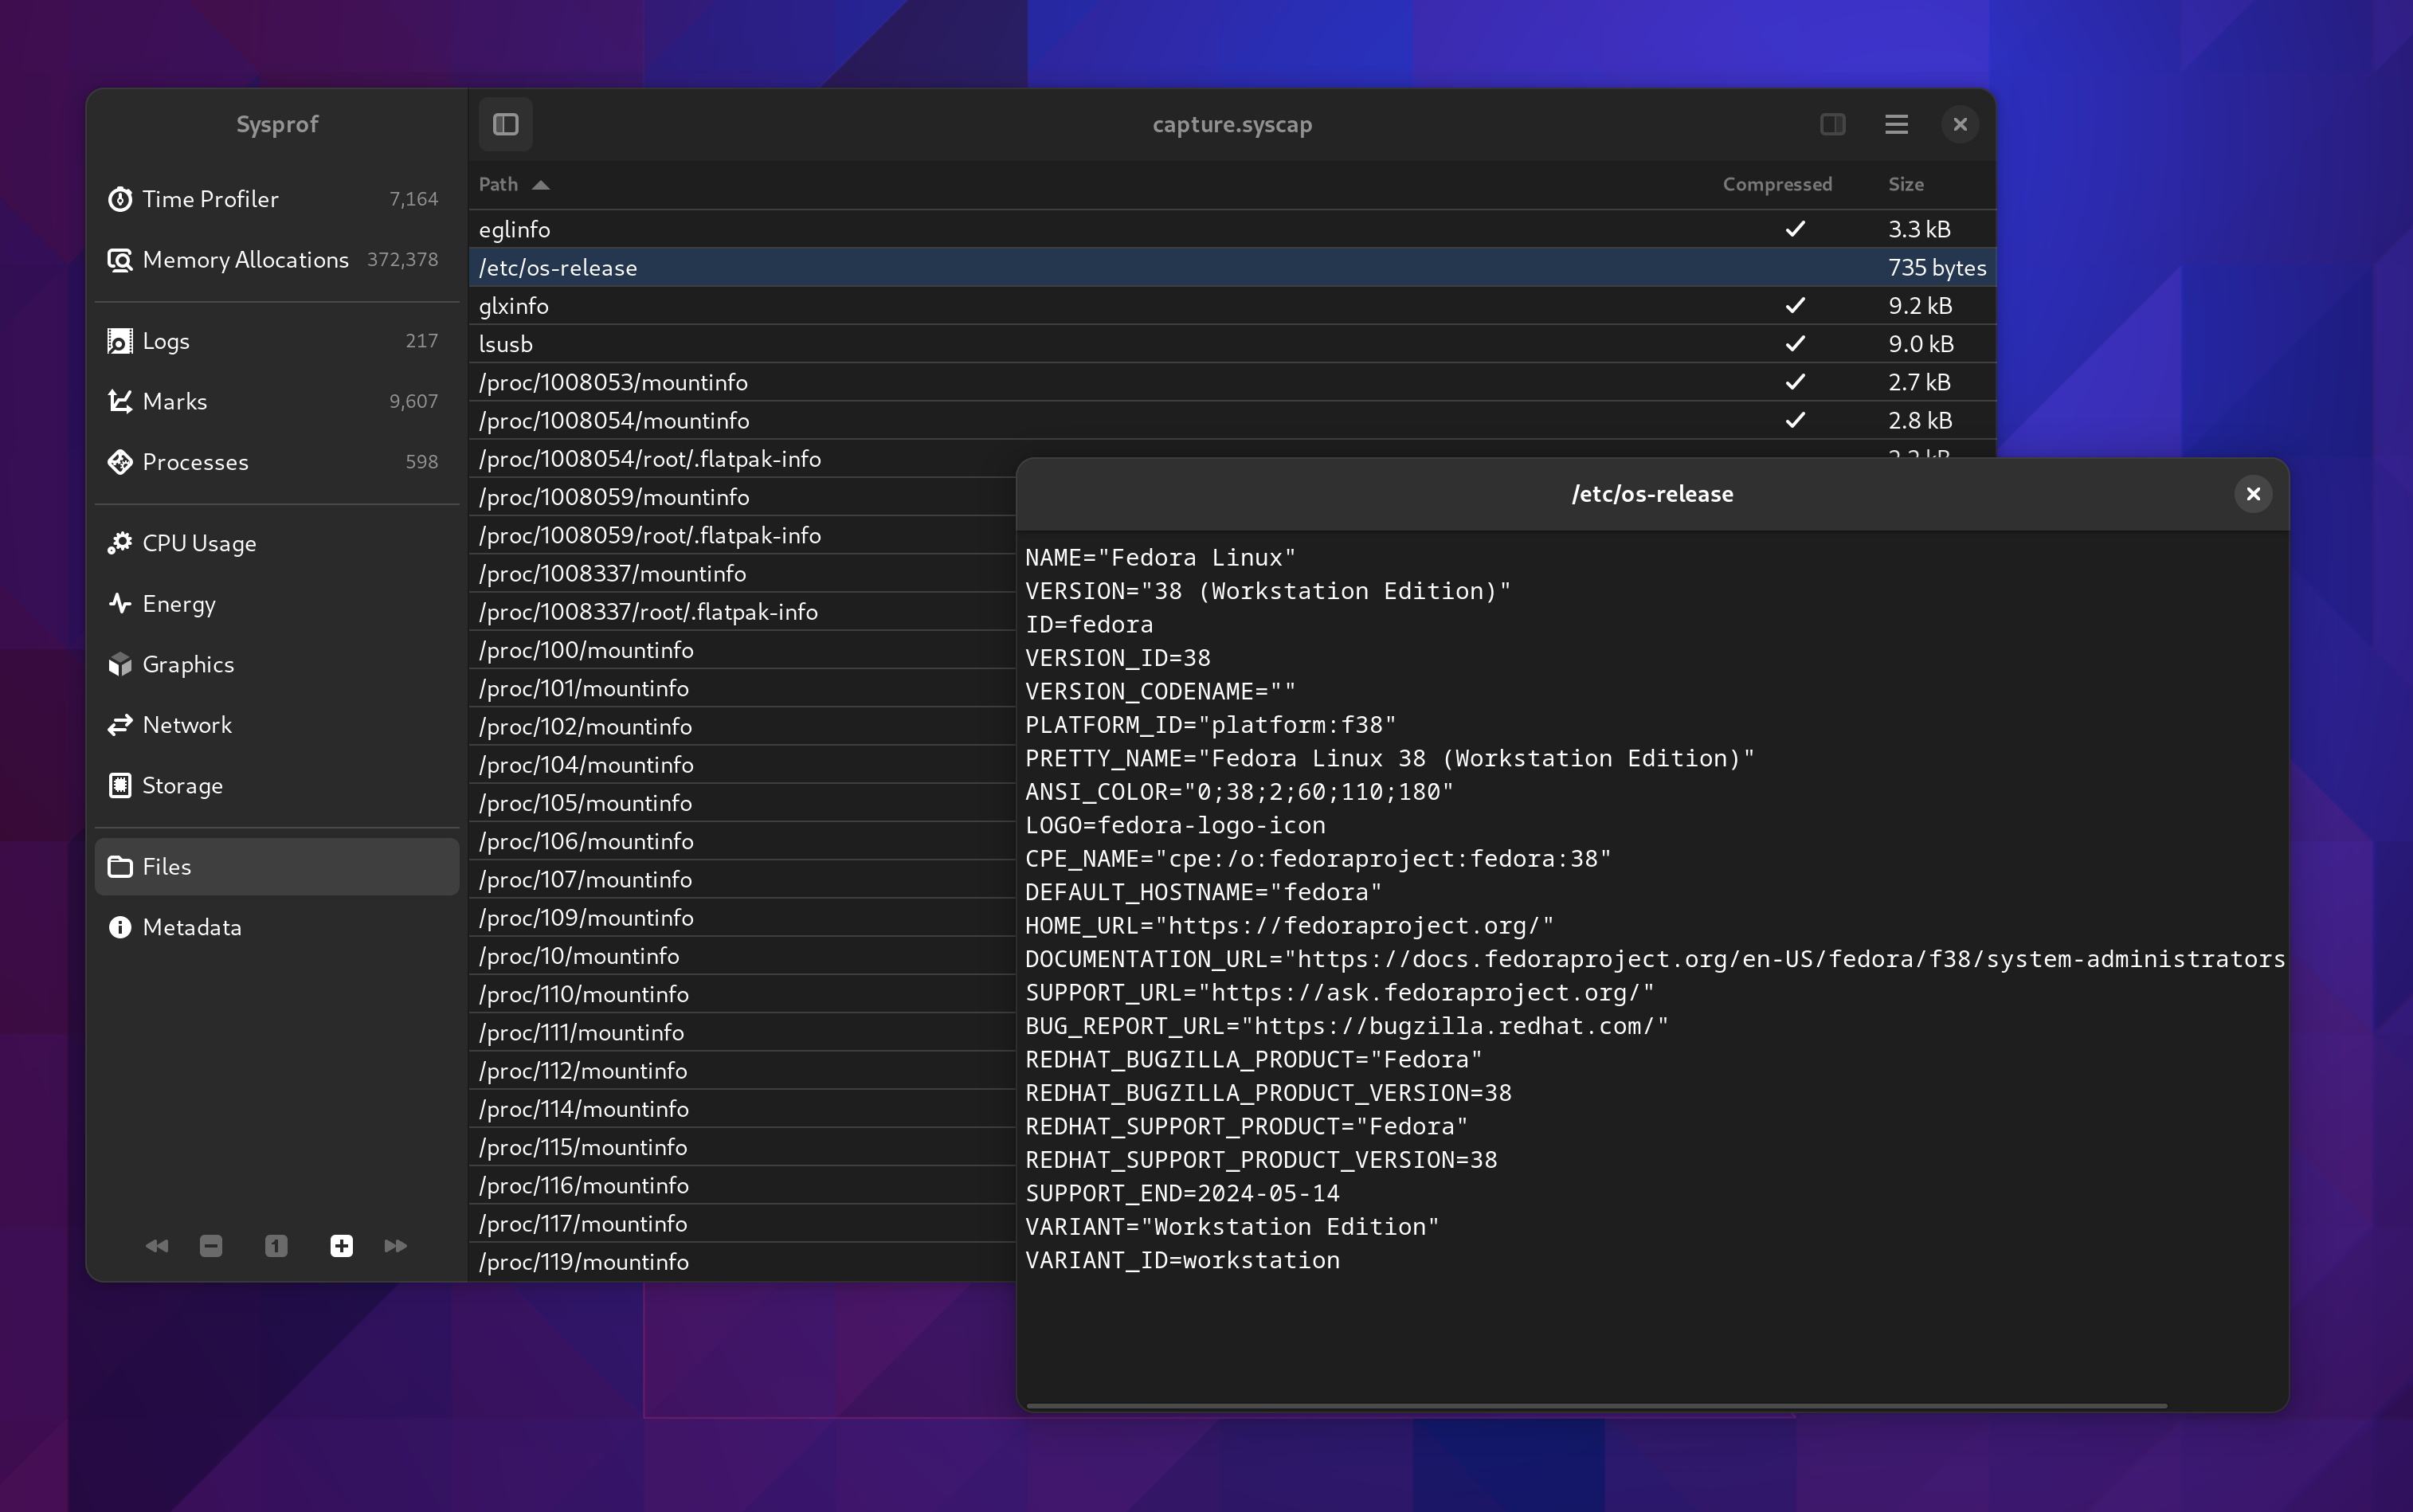
Files
Sysprof supports embedding files in chunks within the *.syscap file. The SysprofDocument exports a GListModel of those which can be reconstructed at will. Since we needed that support to be able to model process namespaces, we might as well give the user insight too. Lots of valuable information is stored here, typically compressed, although Sysprof will transparently decompress it for you.
This will hopefully speed up maintainers ability to get necessary system information without back-and-forths with someone filing an issue.
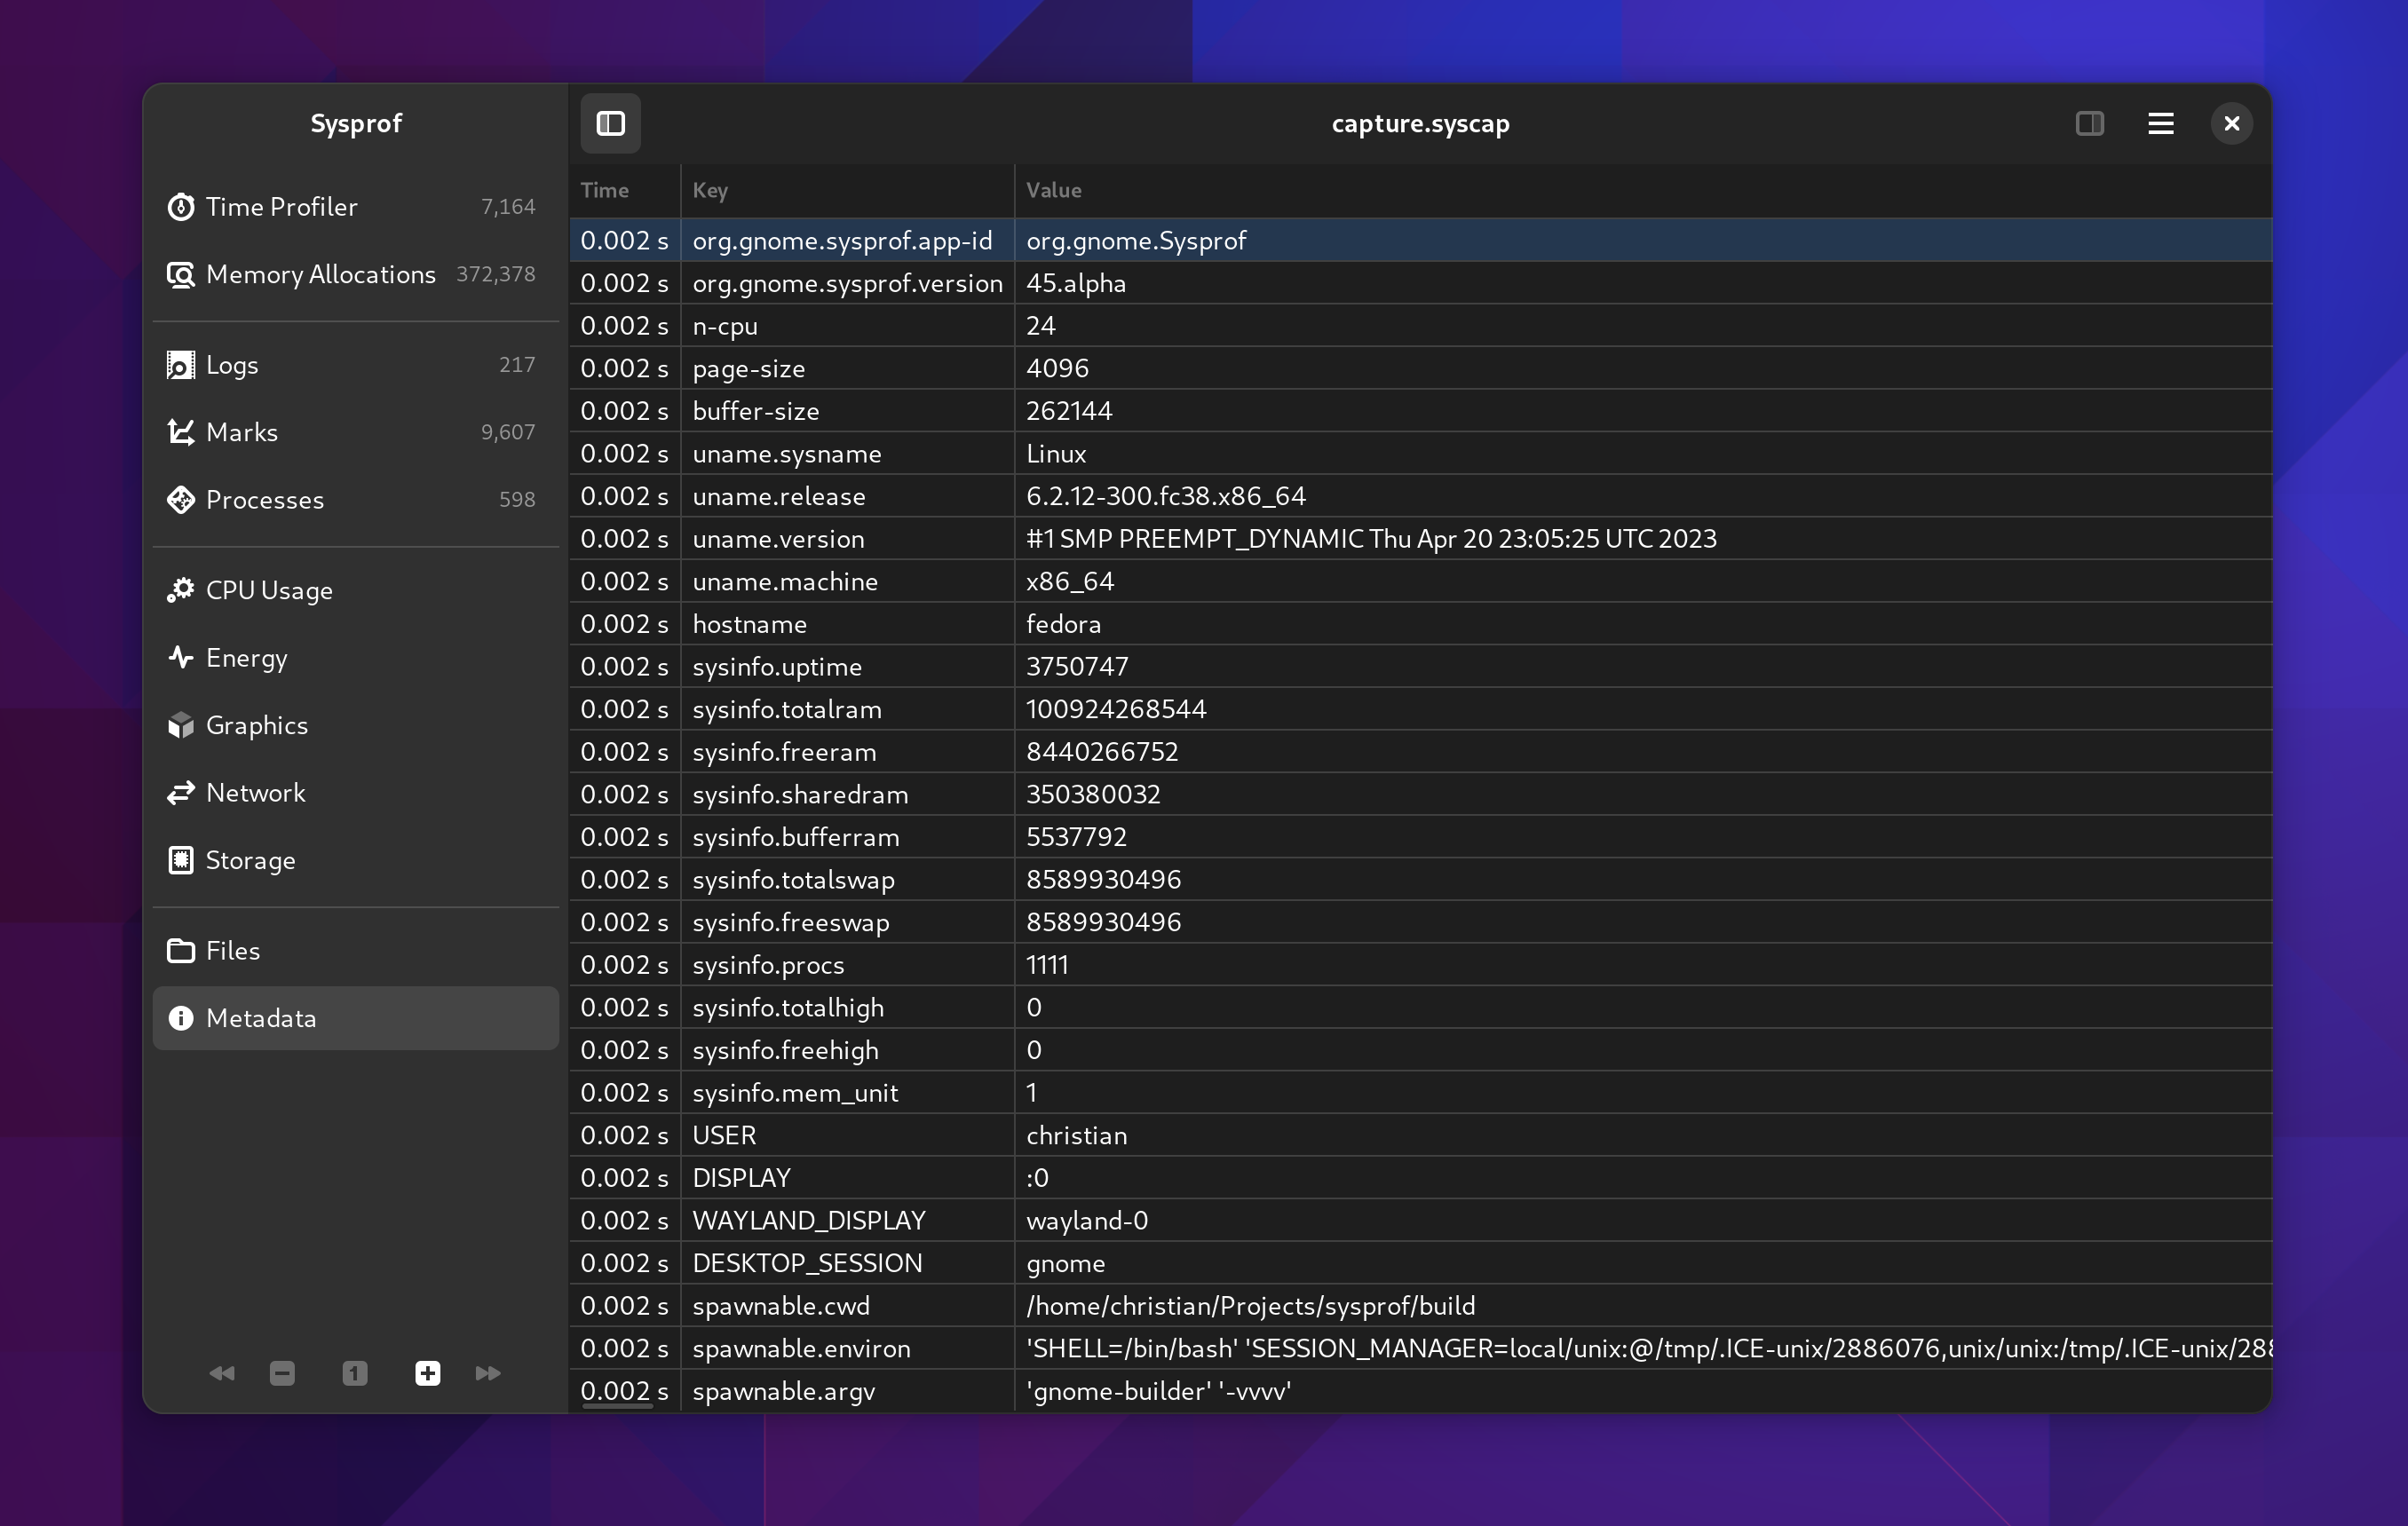
Metadata
A metadata frame is just a key/value pair that you can embed into capture files. Sysprof uses them to store various information about the capture for quick reference later. Since we’re capturing information about a user’s system, we want to put them in control of knowing what is in that capture. But again, this is generally system statistics that help us track down issues without back-and-forths.
Symbolizing
The symbolizing phase of Sysprof has also been redesigned. To effectively handle the changes in how systems are built now from when Sysprof was revamped requires quite a bit of hand-waving. We have containers with multiple and sometimes overlapping storage technologies, varying file-systems used for the operating system including those with subvolumes which might not match a processes, chroots and ostrees.
To make things mostly work across the number of systems I have at my fingertips to test with required quite a bit of iterative tweaking. The end result is that we basically try to model the mount namespace of the target process and the mount namespace of the host and cross-correlate to get a best guess at where to resolve the library path. At that point, we can try to resolve additional paths so that looking at .gnu_debuglink still results in something close to correct.
We also give you more data in the callgraph now so if you do get an inode mismatch or otherwise unresolveable symbol you at least get an offset within the .text section of the ELF you can manually disassemble in your debugger. Few people will likely do this, but I’ve had to a number of times.
To make that stuff fast, Sysprof has a new symbol cache. It is the combination of an augmented Red-Black tree with address ranges (so an interval tree). It’s maintained per-process and can significantly reduce decoding overhead.
PERF_EVENT_MMAP2 and build_id
Sysprof now records mmap2 records from Perf while also requesting build_id for executable pages. The goal here is that we would be able to use the build_id to resolve symbols rather than all the process mount namespace and .gnu_debuglink madness. In practice, I haven’t had too much success getting these values but in time I assume that would allow for symbolizing with tools such as debuginfod.
Writing your own Profiler
You can always write your own profiler using libsysprof and get exactly what you want. The API is significantly reduced and cleaned up for GNOME 45.
[code lang=”c”]
SysprofProfiler *profiler = sysprof_profiler_new ();
SysprofCaptureWriter *writer = sysprof_capture_writer_new ("capture.syscap", 0);
sysprof_profiler_add_instrument (profiler, sysprof_sampler_new ());
sysprof_profiler_add_instrument (profiler, sysprof_network_usage_new ());
sysprof_profiler_add_instrument (profiler, sysprof_disk_usage_new ());
sysprof_profiler_add_instrument (profiler, sysprof_energy_usage_new ());
sysprof_profiler_add_instrument (profiler, sysprof_power_profile_new ("performance"));
/* If you want to symbolize at end of capture and attach to the capture,
* use this. It makes your capture more portable for sharing.
*/
sysprof_profiler_add_instrument (profiler, sysprof_symbols_bundle_new ());
sysprof_profiler_record_async (profiler, writer, record_cb, NULL, NULL);
[/code]
You get the idea.
Writing your own Analyzer
You can also use libsysprof to analyze an existing capture.
[code lang=”c”]
SysprofDocumentLoader *loader = sysprof_document_loader_new ("capture.syscap");
/* there is a sensible default symbolizer, but you can even disable it if you
* know you just want to look at marks/counters/etc.
*/
sysprof_document_loader_set_symbolizer (loader, sysprof_no_symbolizer_get ());
SysprofDocument *document = sysprof_document_loader_load (loader, NULL, &error);
GListModel *counters = sysprof_document_list_counters (document);
GListModel *samples = sysprof_document_list_samples (document);
GListModel *marks = sysprof_document_list_marks (document);
[/code]
This stuff is all generally fast because at load time we’ve indexed the whole thing into low-cardinality indexes that can be intersected. The SysprofDocument itself is also a GListModel of every data frame in the capture which makes for fun data-binding opportunities.
Thanks for reading and happy performance hacking!