In the previous article of this series we covered Sysprof basics to help you use the tooling. Now I want to take a moment to show you how to use the command line tooling to profile systems like GNOME Shell.
Record an existing session
The easiest way to get started is to record your existing GNOME Shell session. With sysprof-cli, you can use the --gnome-shell option and it will attempt to connect to your active GNOME Shell instance over D-Bus to stream COGL pipeline information over a private file-descriptor.
This information can be combined with callgraphs to see what is happening during the duration of a COGL mark.
The details page can also provide some quick overview information about the marks and their duration. You will find this helpful when comparing patches to see if they really improved things over time.

Basic Shell Recording
Running something like a desktop session is complex. You have a D-Bus daemon, a compositor, series of background daemons, settings infrastructure, and programs saving to your home directory. For this reason you cannot really run two of them for the same user at the same time, or even nested.
Because of this, it is handy to log out of your desktop session and switch to a VT to profile GNOME Shell. Sysprof provides a sysprof-cli binary you can use to profile in complicated setups like this.
Start by switching to another VT like Control+Shift+3. I recommend stopping the current display server just so that it doesn’t get in the way of profiling, but usually it’s okay to not. Then we can enter our JHBuild environment with a new D-Bus session before we start Sysprof and GNOME Shell.
Fedora 32 (Workstation Edition)
Kernel 5.6.0-0.rc4.git0.1.fc32.x86_64 (tty3)

startdust login: christian
Password:
$ sudo service gdm stop
$ dbus-run-session jhbuild shell
$
At this point, we can spawn GNOME Shell with Sysprof to start recording.
You can use -- to specify the command you want sysprof-cli to execute while it records. When that application exits, sysprof-cli will extract all the known symbols and finish it’s recording.
I want to mention briefly that the --gnome-shell option only works with an existing GNOME session. I hope to fix that in the near future though.
$ sysprof-cli -- gnome-shell --wayland --display-server
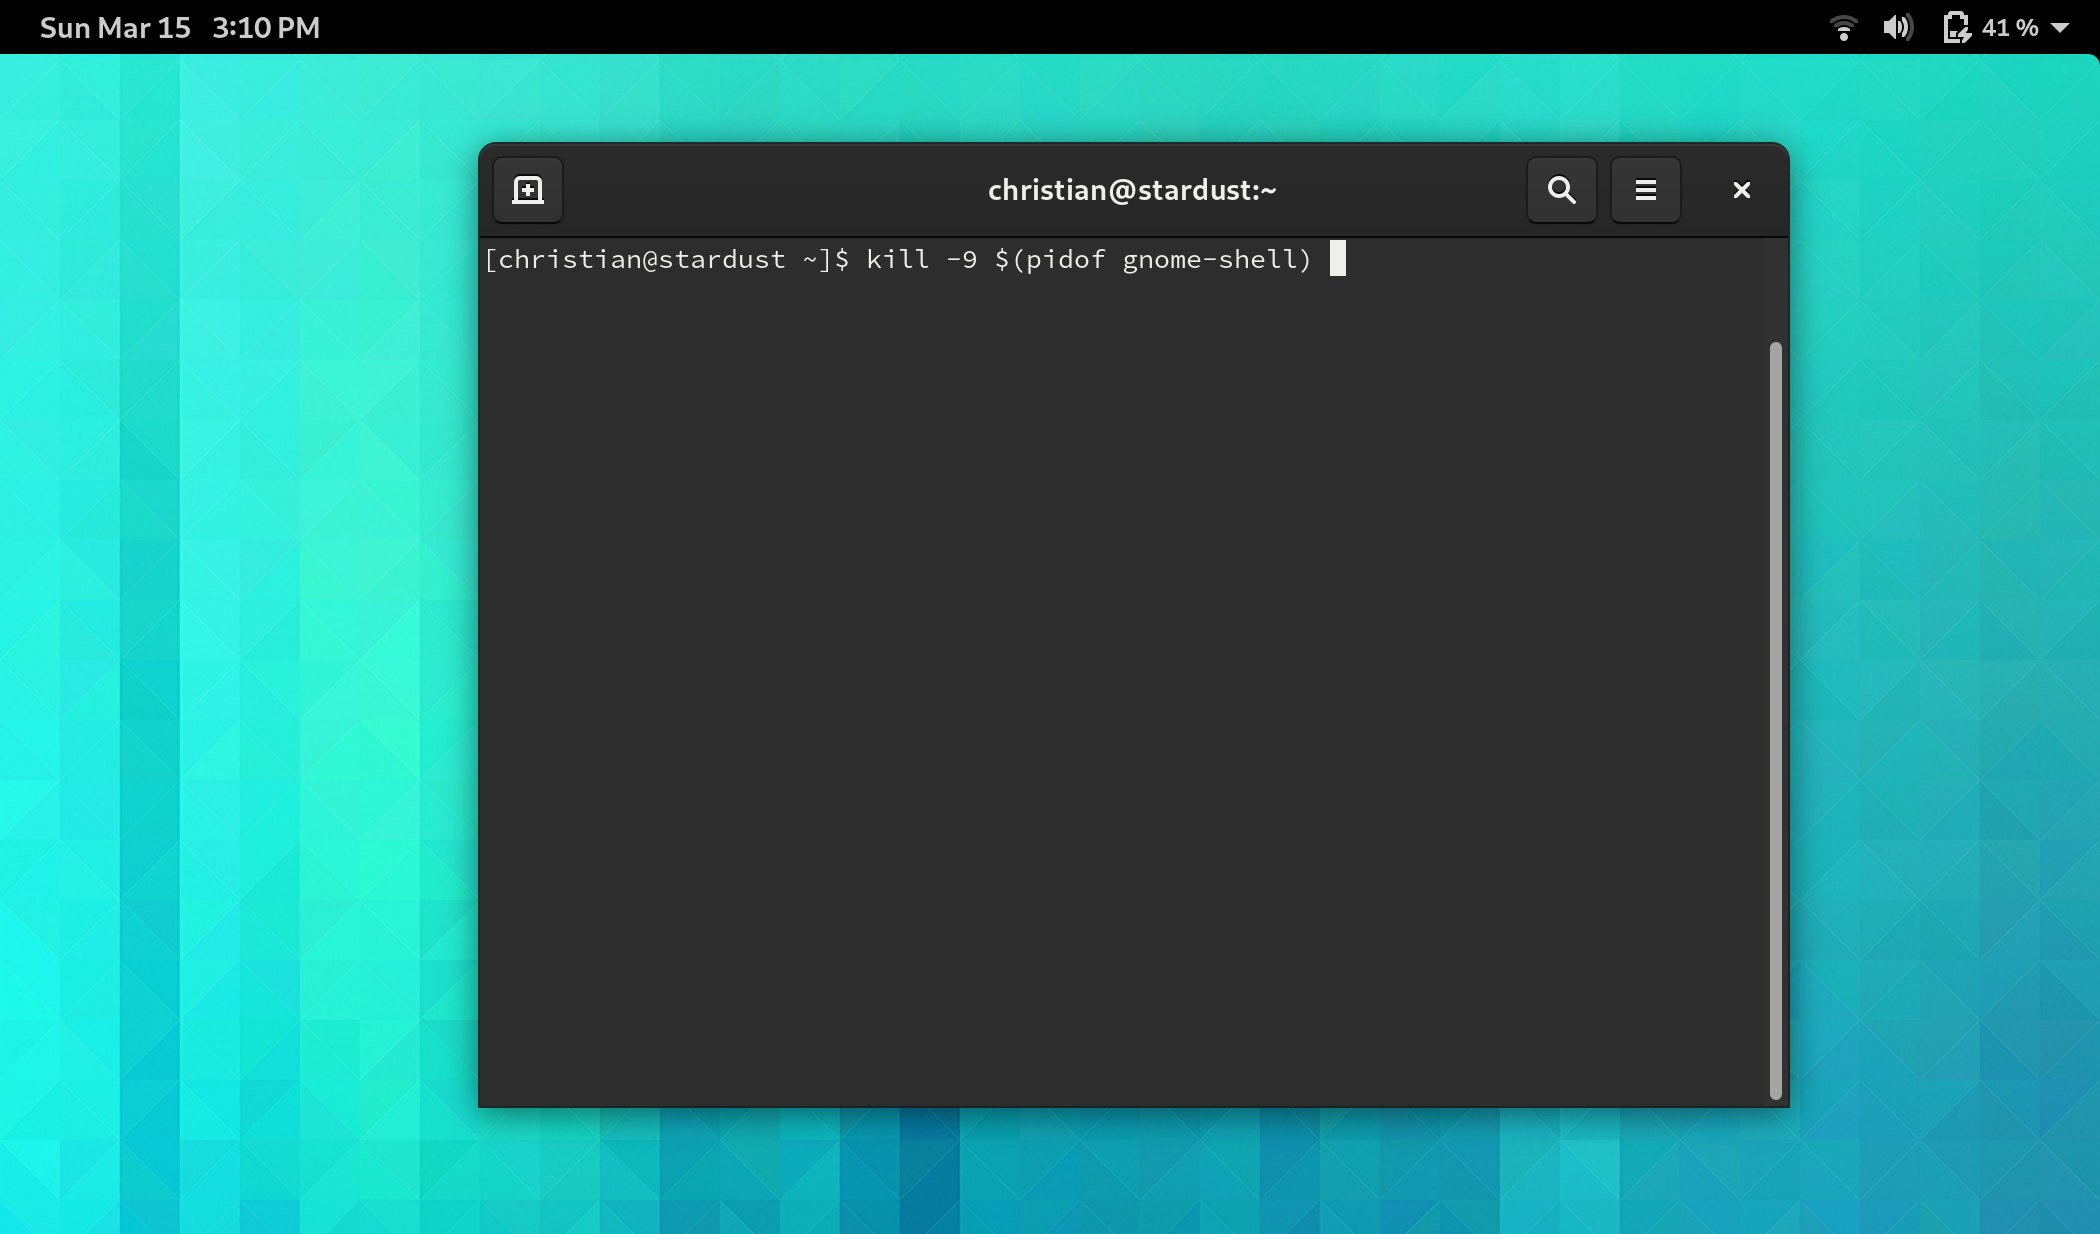
At this point, GNOME Shell will have spawned and you can exercise it to exhibit the behavior you’d like to improve. When done, open a terminal window to kill GNOME shell so that the profiler can clean up.
Now you’ll have a capture.syscap file in your current directory. Open that up with Sysprof to view the contents of your profiling session. Often I just spawn gnome-shell directly to open the syscap file and explore.
Recording JavaScript stacks
Sometimes you want to profile JavaScript instead of the C code from Shell, Mutter, and friends. To do this, use the --gjs command line option. Currently, this can give mixed results if you also sample callstacks with the Linux perf support, as the timings are not guaranteed to be equivalent. My recommendation is to disable perf when sampling JavaScript using the --no-perf option.
$ sysprof-cli --gjs --no-perf -- gnome-shell --wayland --display-server
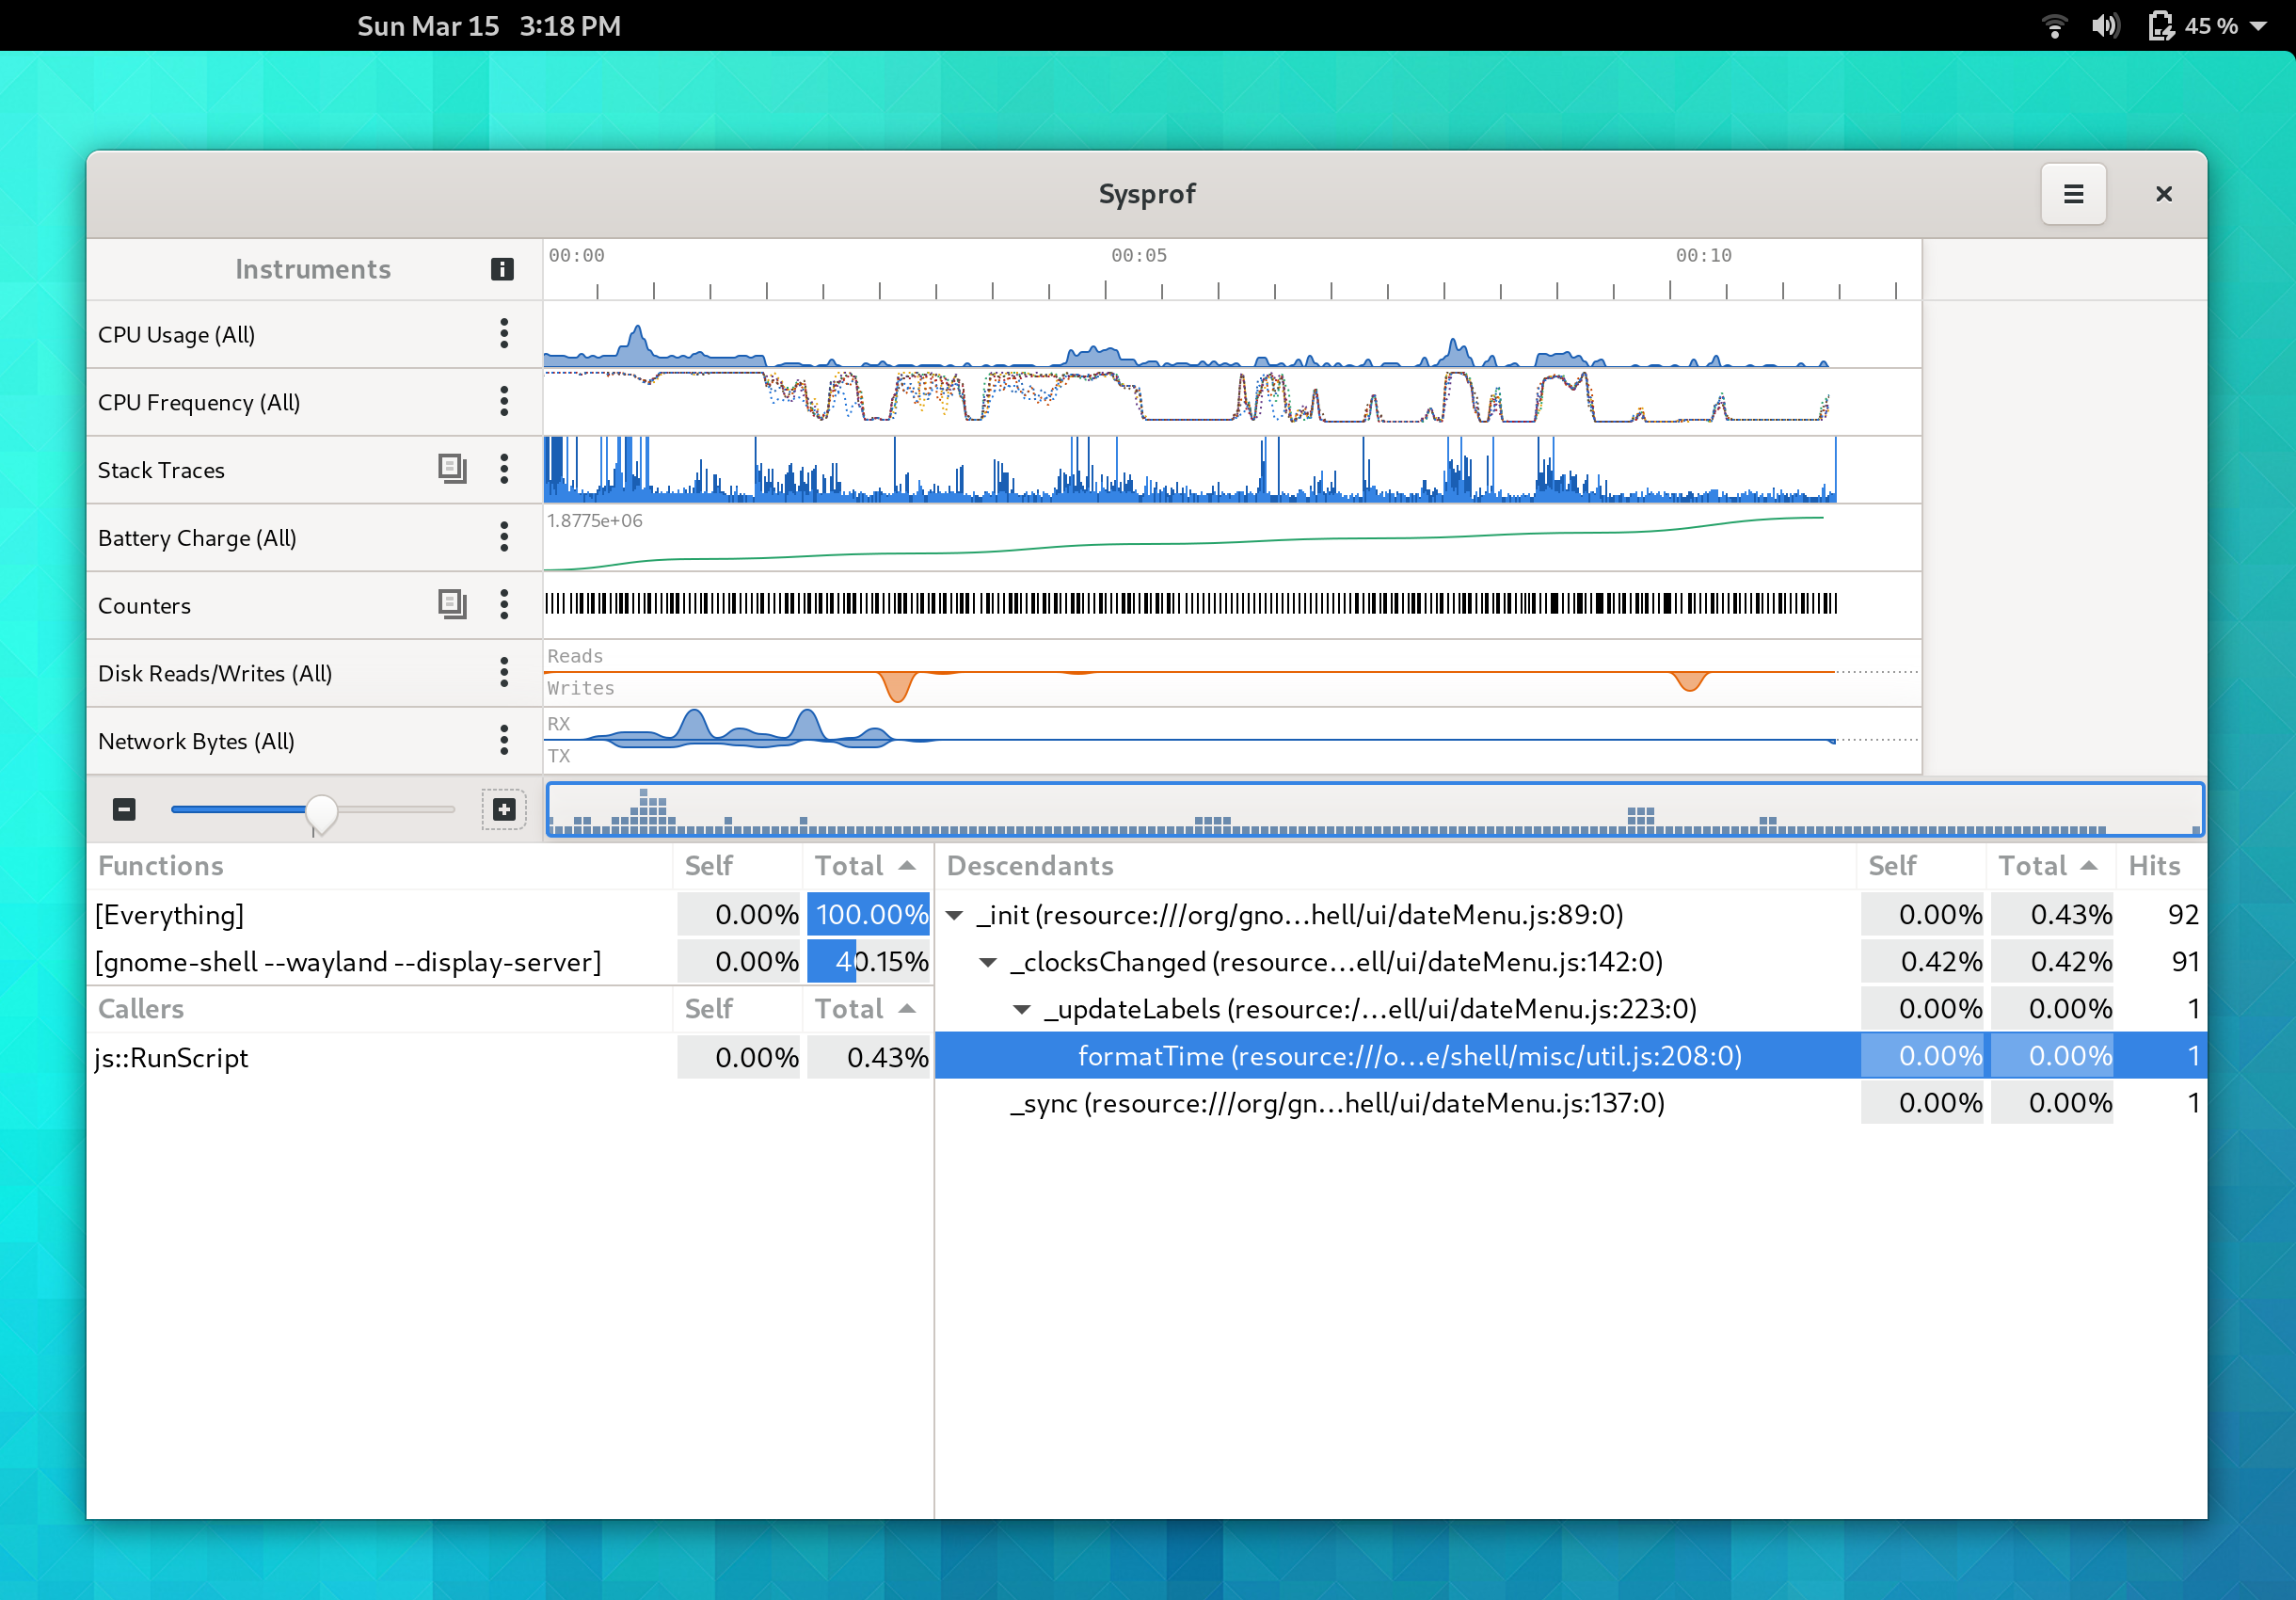
Now when you open the callgraph in Sysprof, you’ll see JavaScript samples.
Recording Energy Consumption
On Linux, we have support for tracking energy usage as “Rolling Average Power Limit” or RAPL for short. Sysprof can include this information for you in your capture if you have the turbostat utility available. It provides power information per “package” such as the GPU and CPU.
Keeping power consumption low is an important part of a modern desktop that aims to be useful on laptops and smaller form factors. It’s useful to check in now and again to ensure that we’re keeping things tip top.
$ sysprof-cli --rapl --no-perf -- gnome-shell --wayland --display-server
You might want to disable sampling while testing power consumption because that could have a larger effect in terms of wattage than the thing you’re profiling.

Reducing Memory Allocations
Plugging memory leaks is a great thing to do. But sometimes it’s better to never allocate things to begin with. The --memprof option can help you find extraneous allocations in your program. For example, I tested the --memprof option on GNOME Shell when writing it and immediately found a way to reduce temporary allocations by hundreds of MiB per minute of use.
$ sysprof-cli --memprof -- gnome-shell --wayland --display-server
Avoiding Main Loop Stalls
This one requires you to build Sysprof until our next release, but you can use the --speedtrack option to find things running on your main loop that may not be a good idea. It will also insert marks for how long the main loop iterations run to find periods of time that you aren’t staying interactive.
$ sysprof-cli --speedtrack -- gnome-shell --wayland --display-server
Anyway, that does it for now! Hope you found this brain dump insightful enough to help us all push forward on the performance curve.