Recently I was looking at a VTE performance issue so I added a bunch of Sysprof timing marks to be picked up by the profiler. I combined that with GTK frame timing information and GNOME Shell timing information because Sysprof will just do that for you. I noticed a curious thing in that almost every ClutterFrameClock.dispatch() callback was rougly 1 millisecond late.
A quick look at the source code shows that ClutterFrameClock uses g_source_set_ready_time() to specify it’s next deadline to awaken. That is in µsec using the synchronized monotonic clock (CLOCK_MONOTONIC).
Except, for various reasons, GLib still uses poll() internally which only provides 1 millisecond timeout resolution. So whatever µsec deadline was requested by the ClutterFrameClock doesn’t really matter if nothing else wakes up around the same time. And since the GLib GSource code will always round up (to avoid spinning the CPU) that means a decent amount late.
With the use of ppoll() out of question, the next thing to use on Linux would be a timerfd(2).
Here is a patch to make GLib do that. I don’t know if that is something we should have there as it will create an extra timerfd for every GMainContext you have, but it doesn’t seem insane to do it there either.
If that isn’t to be, then here is a patch to ClutterFrameClock which does the same thing there.
And finally, here is a graph of how the jitter looks when not using timerfd and when using timerfd.
In the previous article of this series we covered Sysprof basics to help you use the tooling. Now I want to take a moment to show you how to use the command line tooling to profile systems like GNOME Shell.
Record an existing session
The easiest way to get started is to record your existing GNOME Shell session. With sysprof-cli, you can use the --gnome-shell option and it will attempt to connect to your active GNOME Shell instance over D-Bus to stream COGL pipeline information over a private file-descriptor.
This information can be combined with callgraphs to see what is happening during the duration of a COGL mark.
The details page can also provide some quick overview information about the marks and their duration. You will find this helpful when comparing patches to see if they really improved things over time.
The details button in the top right will show you information about marks and their min/max/avg duration.
Basic Shell Recording
Running something like a desktop session is complex. You have a D-Bus daemon, a compositor, series of background daemons, settings infrastructure, and programs saving to your home directory. For this reason you cannot really run two of them for the same user at the same time, or even nested.
Because of this, it is handy to log out of your desktop session and switch to a VT to profile GNOME Shell. Sysprof provides a sysprof-cli binary you can use to profile in complicated setups like this.
Start by switching to another VT like Control+Shift+3. I recommend stopping the current display server just so that it doesn’t get in the way of profiling, but usually it’s okay to not. Then we can enter our JHBuild environment with a new D-Bus session before we start Sysprof and GNOME Shell.
At this point, we can spawn GNOME Shell with Sysprof to start recording.
You can use -- to specify the command you want sysprof-cli to execute while it records. When that application exits, sysprof-cli will extract all the known symbols and finish it’s recording.
I want to mention briefly that the --gnome-shell option only works with an existing GNOME session. I hope to fix that in the near future though.
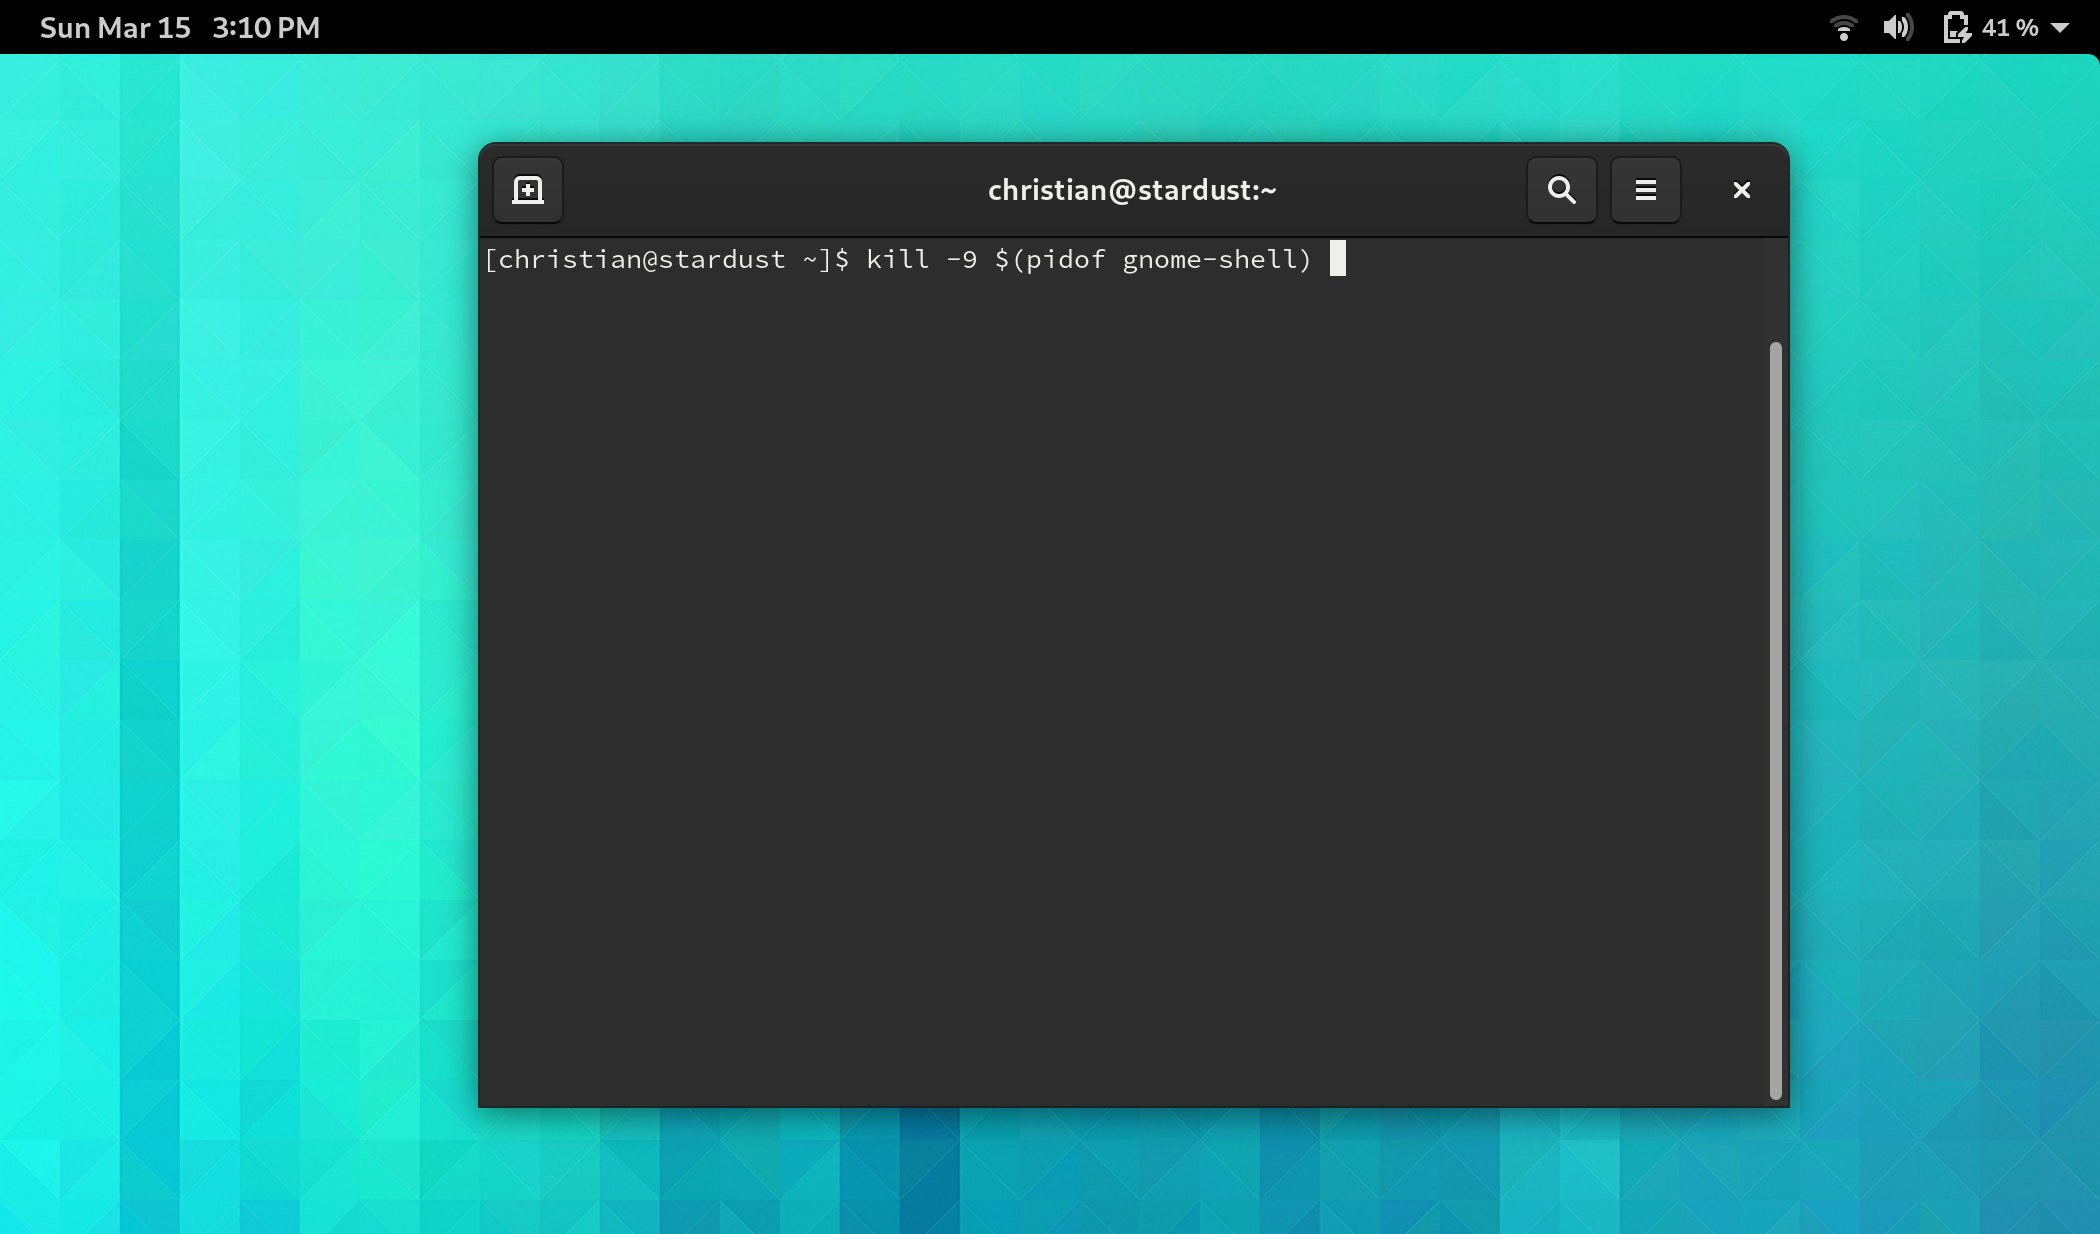
At this point, GNOME Shell will have spawned and you can exercise it to exhibit the behavior you’d like to improve. When done, open a terminal window to kill GNOME shell so that the profiler can clean up.
kill -9 $(pidof gnome-shell) seems to work well for me
Now you’ll have a capture.syscap file in your current directory. Open that up with Sysprof to view the contents of your profiling session. Often I just spawn gnome-shell directly to open the syscap file and explore.
Recording JavaScript stacks
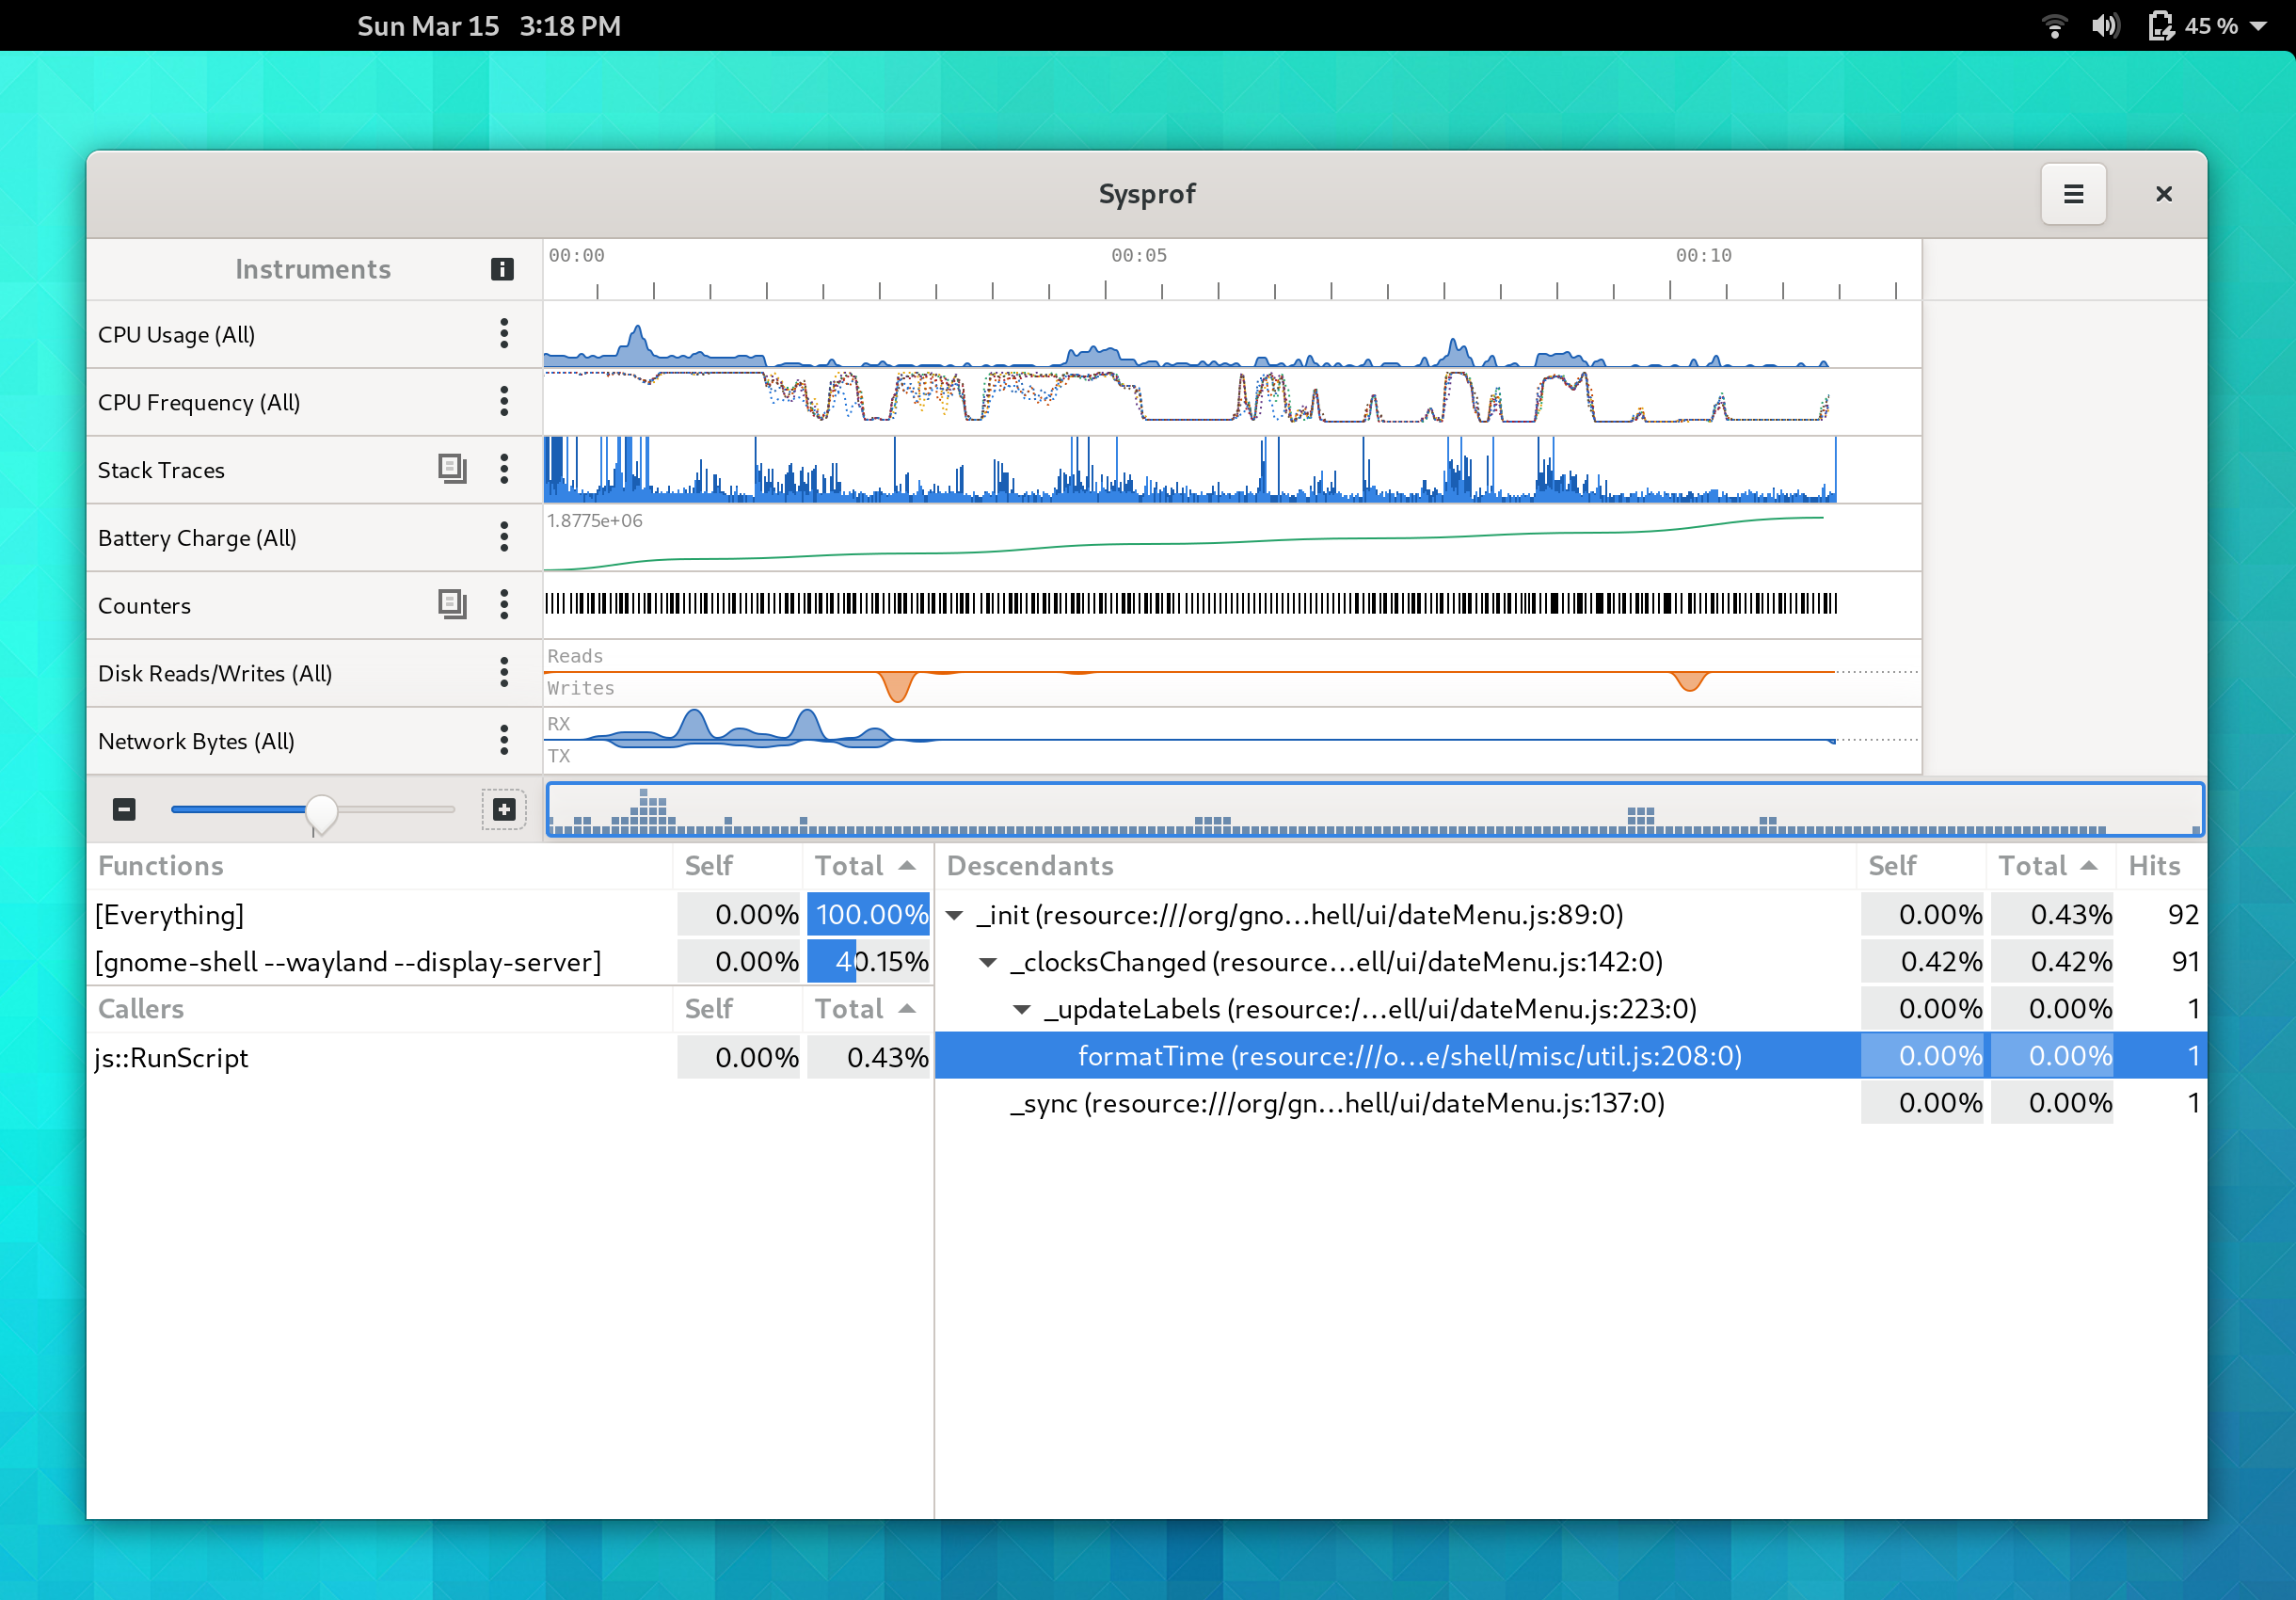
Sometimes you want to profile JavaScript instead of the C code from Shell, Mutter, and friends. To do this, use the --gjs command line option. Currently, this can give mixed results if you also sample callstacks with the Linux perf support, as the timings are not guaranteed to be equivalent. My recommendation is to disable perf when sampling JavaScript using the --no-perf option.
Now when you open the callgraph in Sysprof, you’ll see JavaScript samples.
JavaScrpt callgraph example
Recording Energy Consumption
On Linux, we have support for tracking energy usage as “Rolling Average Power Limit” or RAPL for short. Sysprof can include this information for you in your capture if you have the turbostat utility available. It provides power information per “package” such as the GPU and CPU.
Keeping power consumption low is an important part of a modern desktop that aims to be useful on laptops and smaller form factors. It’s useful to check in now and again to ensure that we’re keeping things tip top.
You might want to disable sampling while testing power consumption because that could have a larger effect in terms of wattage than the thing you’re profiling.
Don’t forget to check the counter and energy menus for additional graphs.
Reducing Memory Allocations
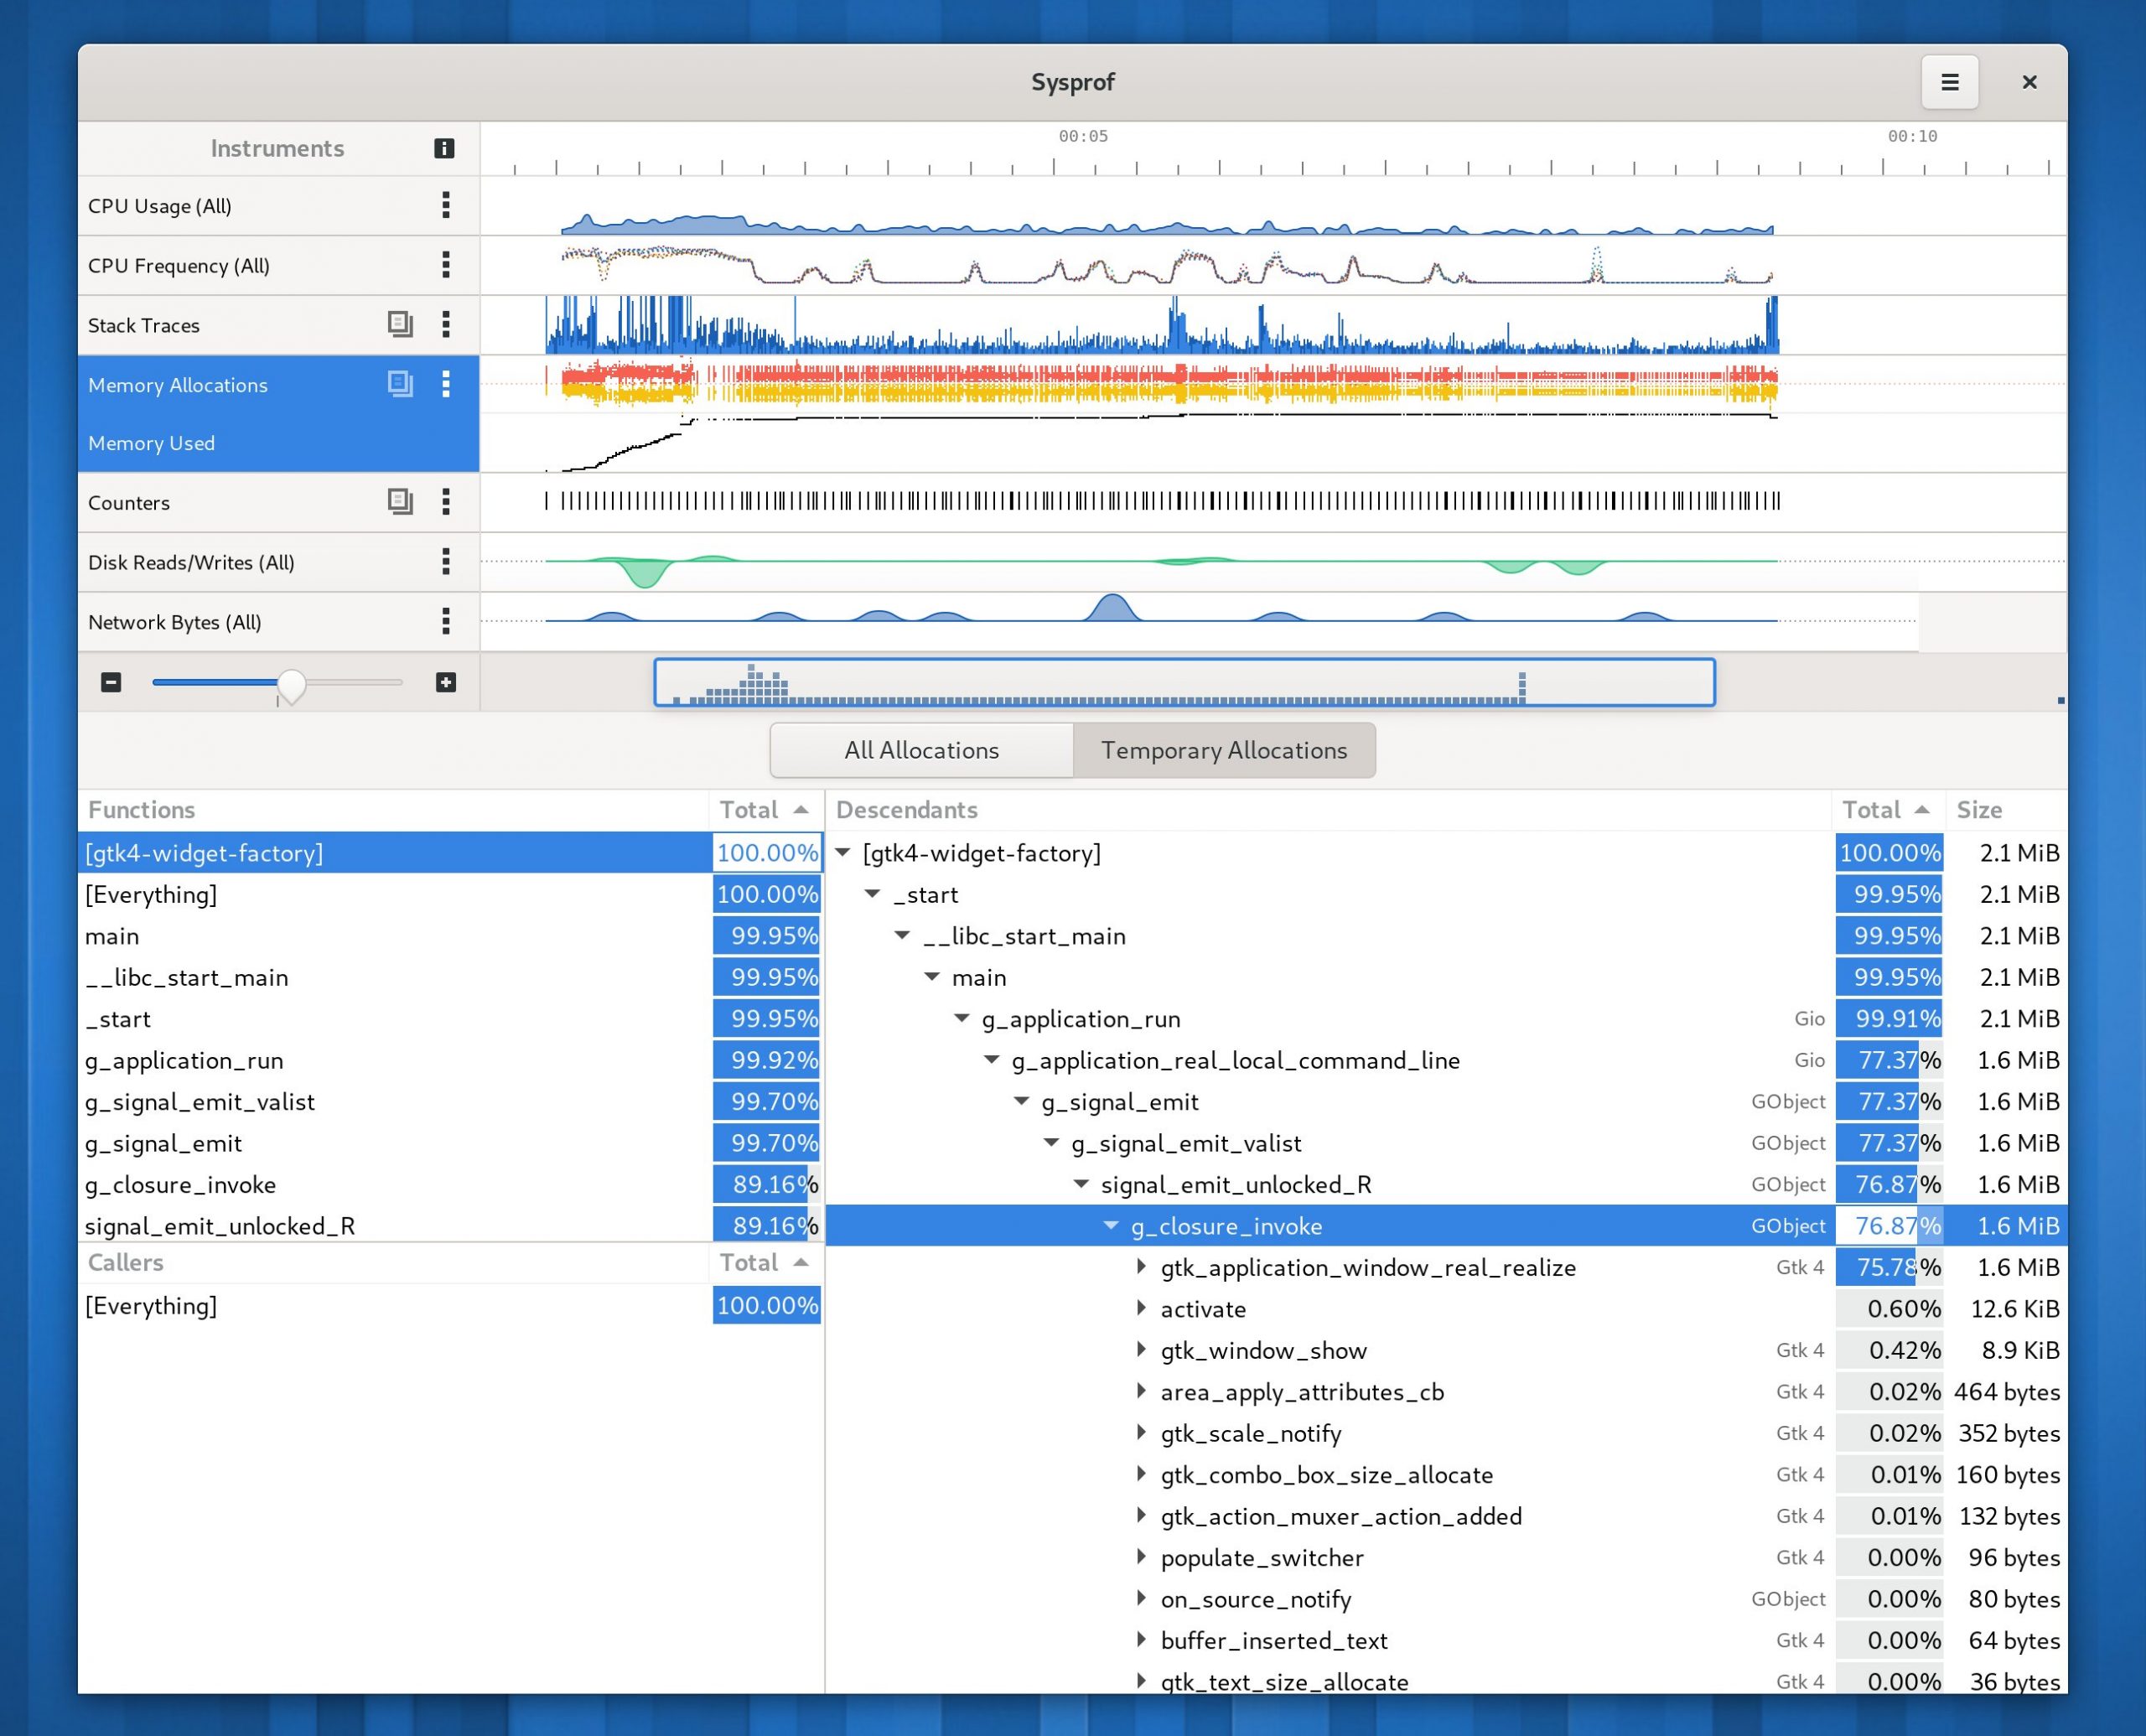
Plugging memory leaks is a great thing to do. But sometimes it’s better to never allocate things to begin with. The --memprof option can help you find extraneous allocations in your program. For example, I tested the --memprof option on GNOME Shell when writing it and immediately found a way to reduce temporary allocations by hundreds of MiB per minute of use.
This one requires you to build Sysprof until our next release, but you can use the --speedtrack option to find things running on your main loop that may not be a good idea. It will also insert marks for how long the main loop iterations run to find periods of time that you aren’t staying interactive.
Over the past few weeks I’ve been finishing up various projects for 3.36. None of this is surprising for those that follow me on twitter, but sadly I find it hard to blog as often as I should.
One of the projects I completed before the end of the cycle is a memory allocation tracker for Sysprof. It’s basically a modern port of the Memprof code from 20 years ago, but tied into Sysprof and using fancier techniques to move data quickly between processes. It uses an LD_PRELOAD to override many of the weak memory symbols in glibc such as malloc() and free(). When those functions are reached, a stack trace is captured directly into a mmap()‘d ring buffer shared by Sysprof. We create a new one of these per-thread so that no locking is necessary between threads. Sysprof will mux all the data together for us.
Below is a quick example running gtk4-widget-factory. We show similar callgraphs as we do when doing CPU profiling, but ordered by the amount of memory allocated. This simple tool and less than 20 minutes of effort found many allocations we could completely avoid across both GTK and Clutter.
I just want to mention how refreshing it is to have memory allocation tracking while still starting the application in what feels like instantly. It was quite a bit of tweaking to get that level of performance and I’m thrilled with the result.
Additionally, I spent some time looking at what sort of things cause temporary lockups in GNOME Shell during active use. With a fio script in hand, I had the necessary things to cause the buffer cache to be exhausted and force many applications working set out of memory. That usually does the trick to cause short lockups.
But what is going on when things stall? Does the GPU driver get bogged down? Does the Shell get blocked on GC? Is there some sort of blocking API involved?
To answer this I put together a scrappy little LD_PRELOAD tool called “iobt” which will write out a Sysprof capture file when some blocking operations are called. This found a very peculiar bug where GNOME Shell could end up blocking on the compositor thread when it thought it was doing all async I/O operations.
Furthermore, I found a number of other I/O operations happening on the main thread which will easily lock things up under heavy writeback scenarios. Patches for all of these are upstream, half of them are merged at this point, and some even backported to 3.28 for various distros.
There are still some things to do going forward, like use cgroupsv2 to help enforce CPU and Memory availability and other priorities. I’m also looking for pointers from GPU people on how to debug what is going on during long blocking eglSwapBuffers() calls as I’ve seen under memory pressure.
I’m always inspired by what the Shell developers build and I’m honored to get to help polish it even more.
Over the past couple of weeks I’ve been heads down working on a new tool along with Patrick Griffis. The purpose of this tool is to make it easier to integrate IDEs and other tooling with GNU-based gadgets like phones, tablets, infotainment, and IoT devices.
Years ago I was working on a GNOME-integrated home router with davidz which sadly we never finished. One thing that was obvious to me in that moment of time was that I will not do another large scale project until I have better tooling. That was Builder’s genesis and device integration is what will make it truly useful to myself and others who love playing with GNU-friendly gadgets.
Now, building an IDE is a long process. There is a ton of code to write, trade-offs to work through, and persistence beyond what any reasonable programmer would voluntarily sign up for. But the ends justify the slog.
So what we’ve created is uninterestingly called “deviced”. It currently has three components. A deviced daemon lives on the target device that we’re interested in writing software for. A GObject-based libdeviced library provides access to discover and connect to devices and do interesting things on them. Lastly, devicectl is a readline-based command line tool that allows you to interact with these devices without having to write a program using libdeviced.
The APIs in libdeviced are appropriately abstracted so that we can provide different transports in the future. Currently, we only have network-based communication but we will implement a USB transport in the not-too-distant future. Other protocols such as SSH or custom micro-controllers can be added. Although something like SSH is more complex because it’d be the combination of both a protocol and how to run commands to get the intended effect, which is non-portable. It will be possible to support devices that do not run deviced, but that is currently out of scope.
To allow devices to be discover-able, deviced will broadcast it’s presence using mDNS on networks it is configured to listen (based on network-manager connection UUID). Long term my goal is that you can configure deviced access in Control Center, similar to “Sharing and Privacy”. The network protocol is rather simple as it’s just JSON-RPC over TLS with self-signed certificates. When a client connects to the daemon, a gnome-shell notification is presented allowing you to accept the connection. At that point, the client certificate is saved for future validation.
Our libdeviced library is GObject introspectable and should therefore work with a number of languages.
Right now, only Flatpak applications are supported, but we have abstractions to allow for contributions to support additional application layers like docker or plain old .desktop files. Currently you can push flatpak applications and runtimes to the device and install them and run them. If you have a new enough Flatpak, you can do delta updates.
It can even bridge multiple PTY devices for a shell, which isn’t really meant to be an SSH replacement, but more of a single abstraction we can use to be able to control a debugger and inferior from the IDE tooling.
There are still lots of little bugs to shake out and more bits to implement, but this is a pretty sweet 2-week proof of concept.
Here is a 20 second demo running on a single machine. It’s the same when using multiple machines except you get the notification on the programmable device rather than on your workstation. Obviously for IoT devices we’d need to create some sort of freedesktop notification bridge or alternate notification mechanism.
Anytime you work on a new project people will inevitably ask “why not just use XYZ”. In this case, I would expect both SSH and ADB to fall into that category. Most importantly, libdeviced is going to be about providing a single “remote device” abstraction for us in Builder. So it’s reasonable that we could abstract both of those systems from libdeviced. But neither of those provide the work-flow I envision for out-of-box experience, hence the deviced daemon. In the ADB case, it will be very difficult to get code upstream and released to distributions as it is increasingly unlikely our use-case is interesting to upstream. There were experimental patches to ADB a couple years ago to support flatpak so we didn’t take on this effort without considering our options. Ultimately, this prototype was to see the feasibility of making something that solves our problems while not locking us out of supporting other systems in the future.
Today I wrote a couple line patch to GNOME Shell to toggle on and off the profiler using SIGUSR2. So if you build Gjs and gnome-shell with the appropriatepatches, you can do something like:
[code lang=”shell”]
gnome-shell –wayland
# .. inside shell
kill -SIGUSR2 <pid>
# .. exercise shell a bit
kill -SIGUSR2 <pid>
# .. now look at /tmp/gjs-profile-$pid
[/code]
If you open that file up with my Sysprof improvements, you can browse around the profile information containing JavaScript stacks.