So now that a new Sysprof release is shipped, lets pick on an unsuspecting library to see what it is like to improve performance in a real-world scenario. Today we’ll pick on GtkSourceView. They shouldn’t feel bad though, GtkSourceView is an absolutely wonderful library and like any piece of software, it can be improved.
GtkSourceView has a lovely helper program to test things out in the tests/ directory. If you are an app or library developer, please do this! It makes things much easier.
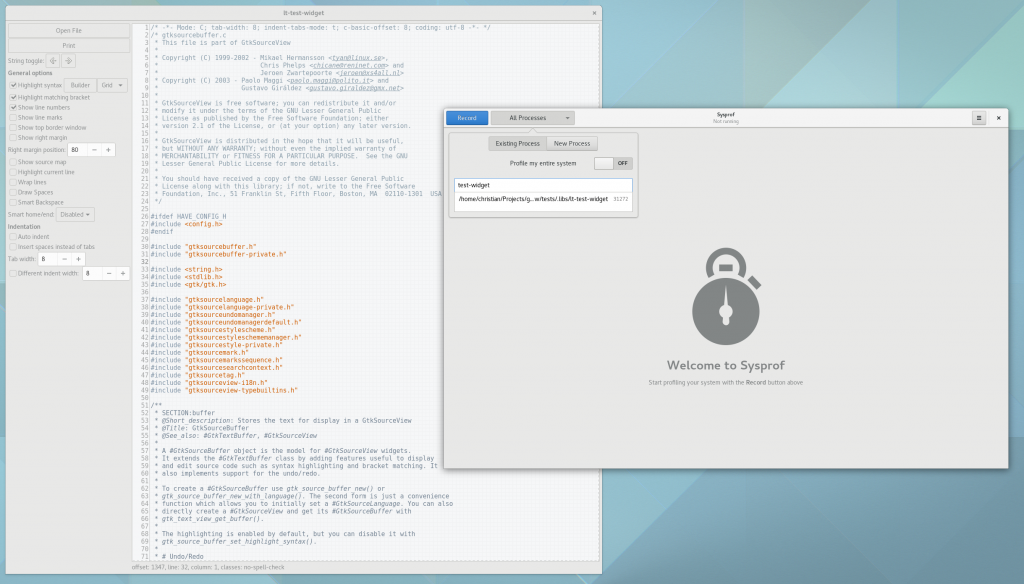
So lets run ./test-widget in our jhbuild environment, and start-up Sysprof. Often times, you’ll want to see how your program affects the whole system. But for this test, I want to focus on test-widget, so we will limit our capture to samples in that process. Do this by turning off the Profile my entire system switch and then selecting your target process from the list.
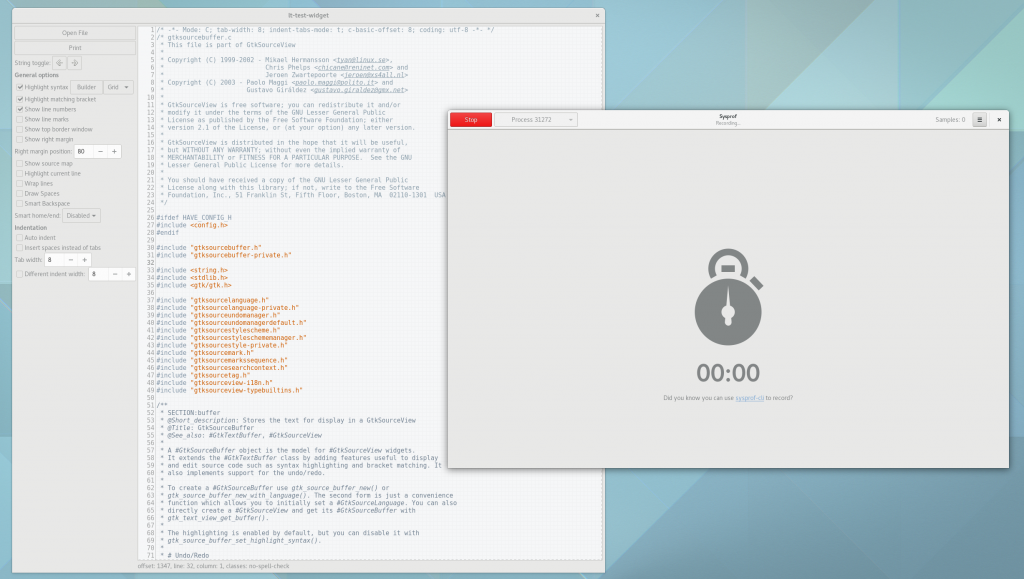
Next, click record. You might be prompted to authorize your user to access performance counters based on your system configuration and user permissions.
After your profiling session has started, switch back to the test application and exercise the crap out of it. In this case, I turned on some features in the test widget like line numbers (something I always have enabled in Gedit and Builder) and started scrolling like crazy. I did this until I had about 30,000 samples recorded. Sysprof will tell you how many callchains have been recorded in the upper right corner of the window.
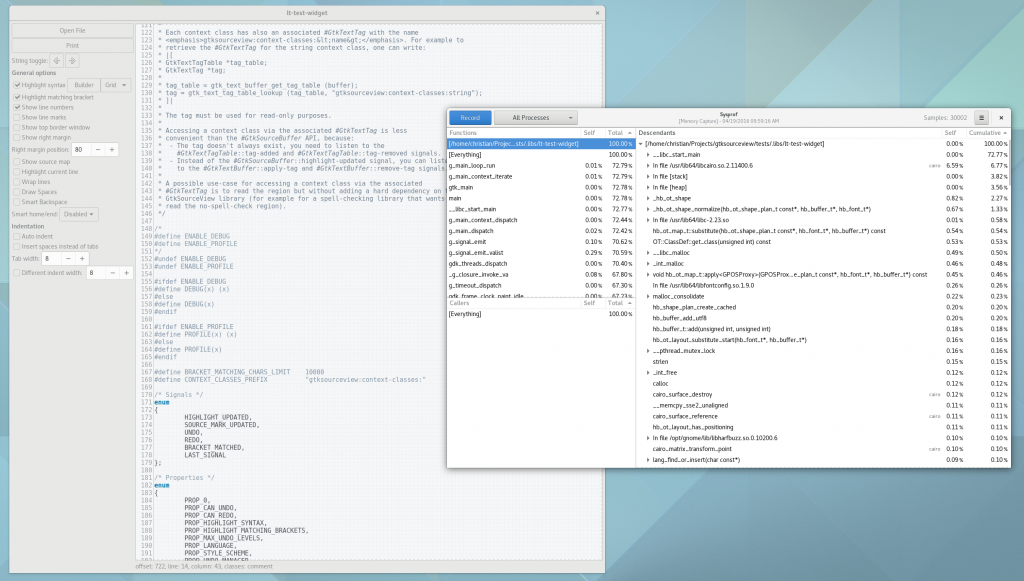
Then press the Stop button. Depending on the size of your capture, it might take a couple seconds, but the callgraph will then be generated. It has to crack open all of the linked libraries and extract symbol information from them, so it can take a second or two.
Now the mysterious part. Start diving into the descendants tree following the most expensive cumulative times. We want to find something that looks “out of place”. Getting good at that takes practice. If your callchain gets too deep, just hit enter on the row and it will focus in on that item.
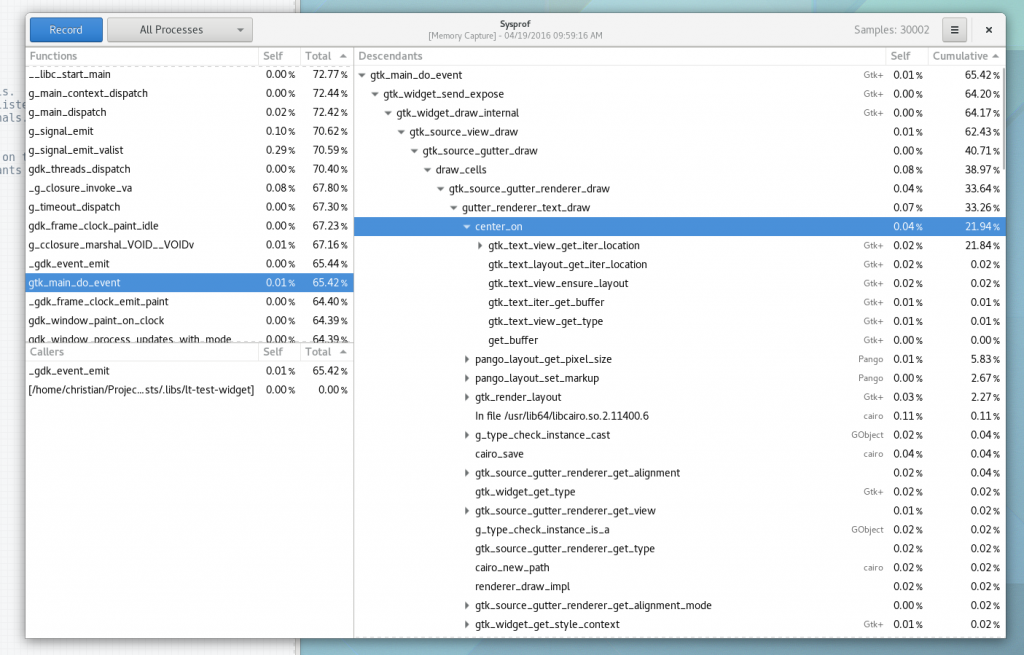
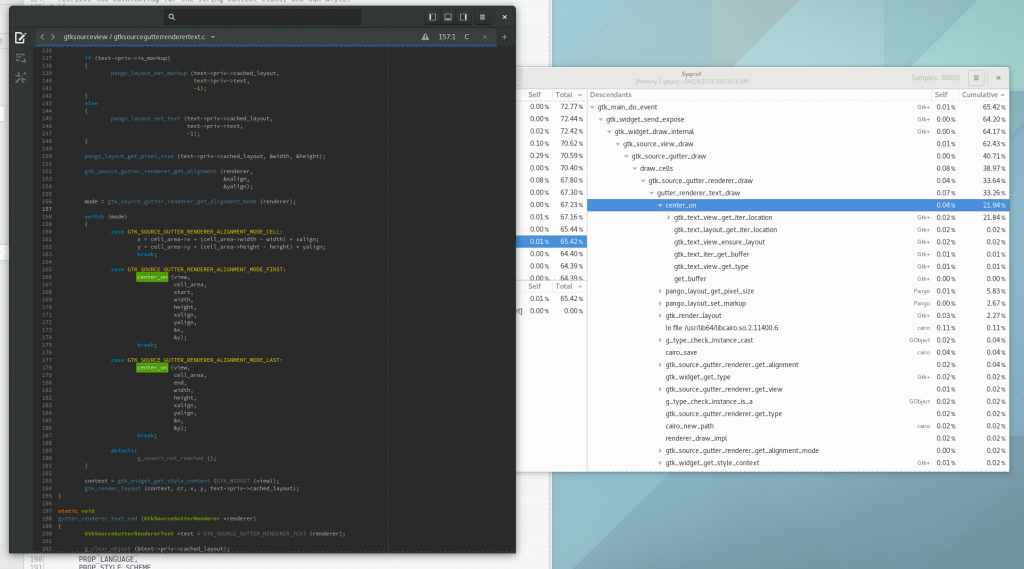
In the image below, you’ll see I jumped past main, various main loop junk until i got to gtk_main_do_event(). This is the crux of event dispatch in GTK+. If we keep diving down by the most expensive callchain, we get to a peculiar function, center_on(). It seems to be calling into gtk_text_view_get_iter_location() a bunch, I wonder why.
So lets go find the code. It is clearly called by GtkSourceGutterRendererText, so that is where we will start.
In the code below, it looks like the text gutter renderer (what draws line numbers next to your code) needs to either place the text in the middle of the row, the top of the row (in the case of line wrapping), or the bottom of the row (also in case of line wrapping).
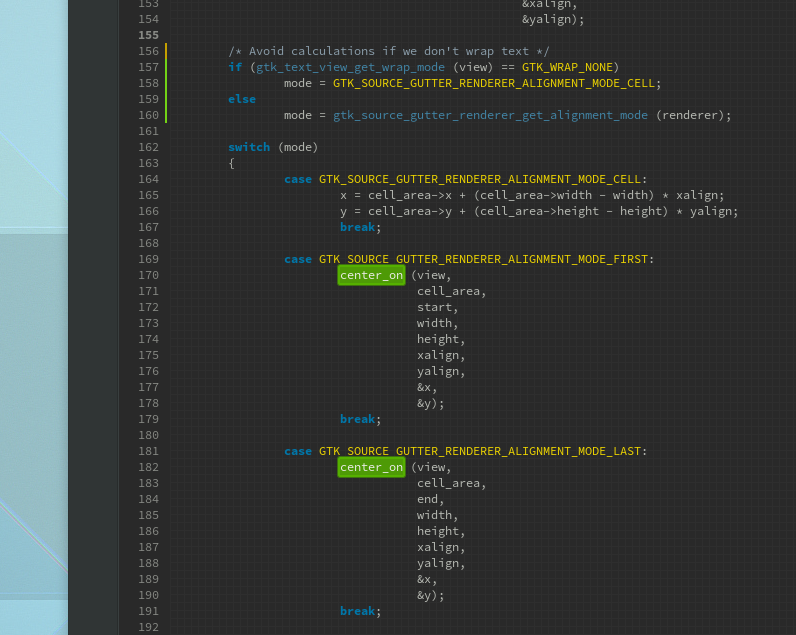
In Builder, shamefully, we don’t even allow line wrapping today. So clearly a shortcut can be taken. If wrapping is disabled, we know that we will always be centering our text to the entire height of the cell. So lets cook up a quick patch to avoid the center_on() calls altogether.
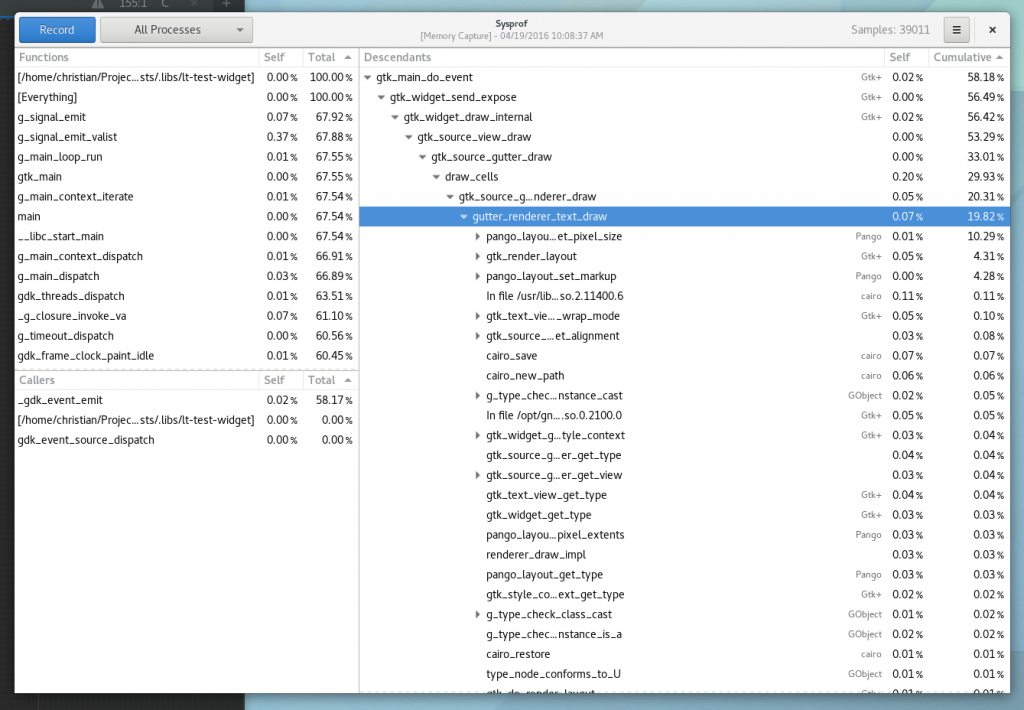
Now we build, and repeat our profiling session to compare the results. Originally the gutter_renderer_text_draw() was in about 33% of our collected callchains. Now, if you look below we are down to less than 20% of our collected callchains, and center_on() is nowhere to be seen!
So the moral of the story is that in about half an hour, you can profile, learn something about a code-base, and make measurable improvements. So go ye forth and make the F in Free Software stand for Fast.
