I spend a lot of time making flashy widgets for Gtk. Mostly because I find it entertaining. You can now benefit from the culmination of many years of my trial and error in a new library I’ve created, libdazzle. The code is currently on github but I suspect I’ll move it to git.gnome.org relatively soon.
Why another library? Because I wanted to. But also, because managing all of this custom widgetry in Builder is starting to get out of hand and I’d really like others to be able to use the code too. Every time I go work on another hobby project I get annoyed that I have to copy and paste a bunch of code over.
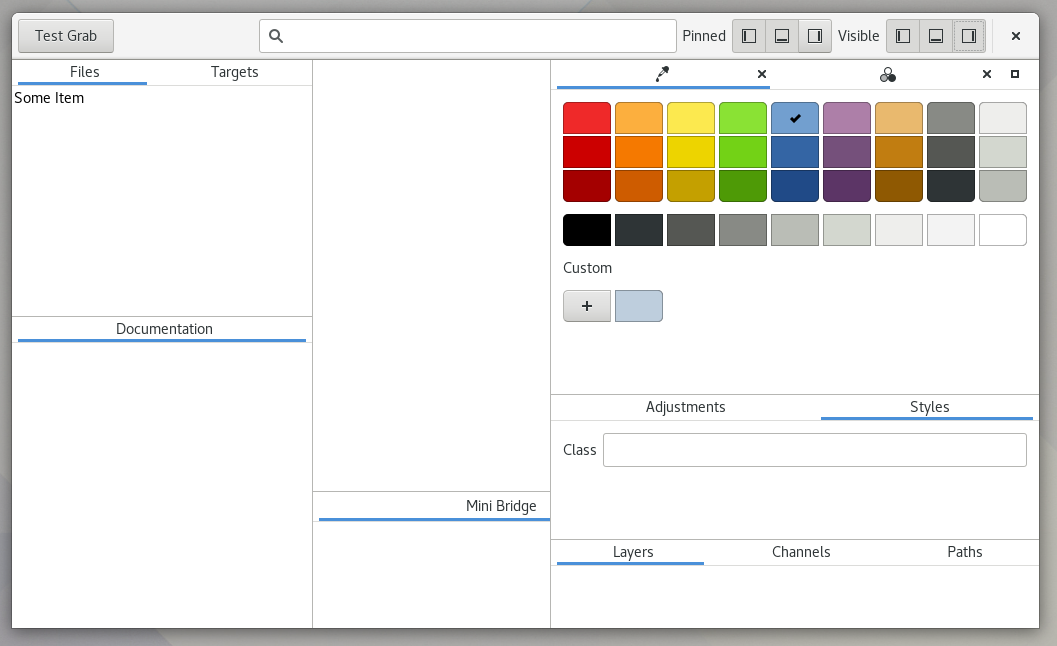
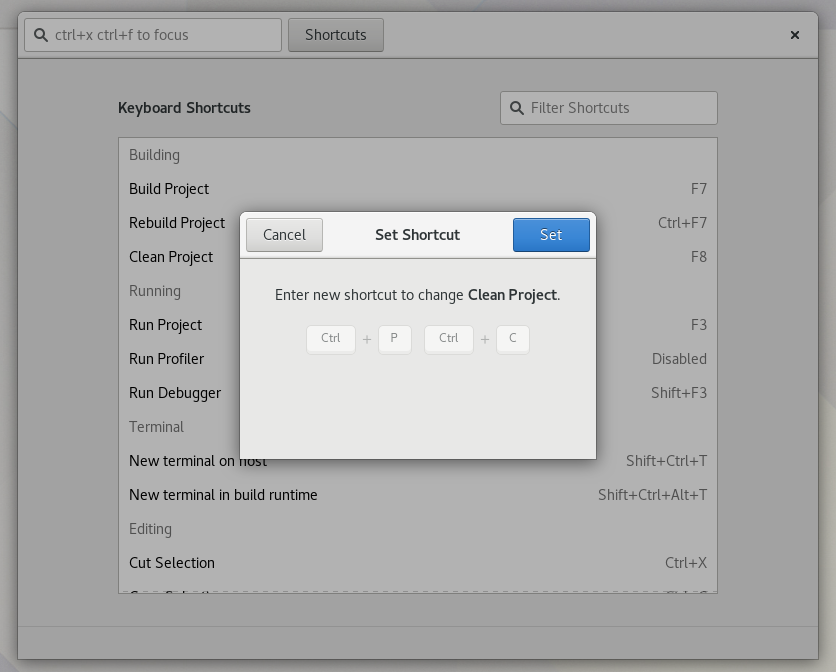
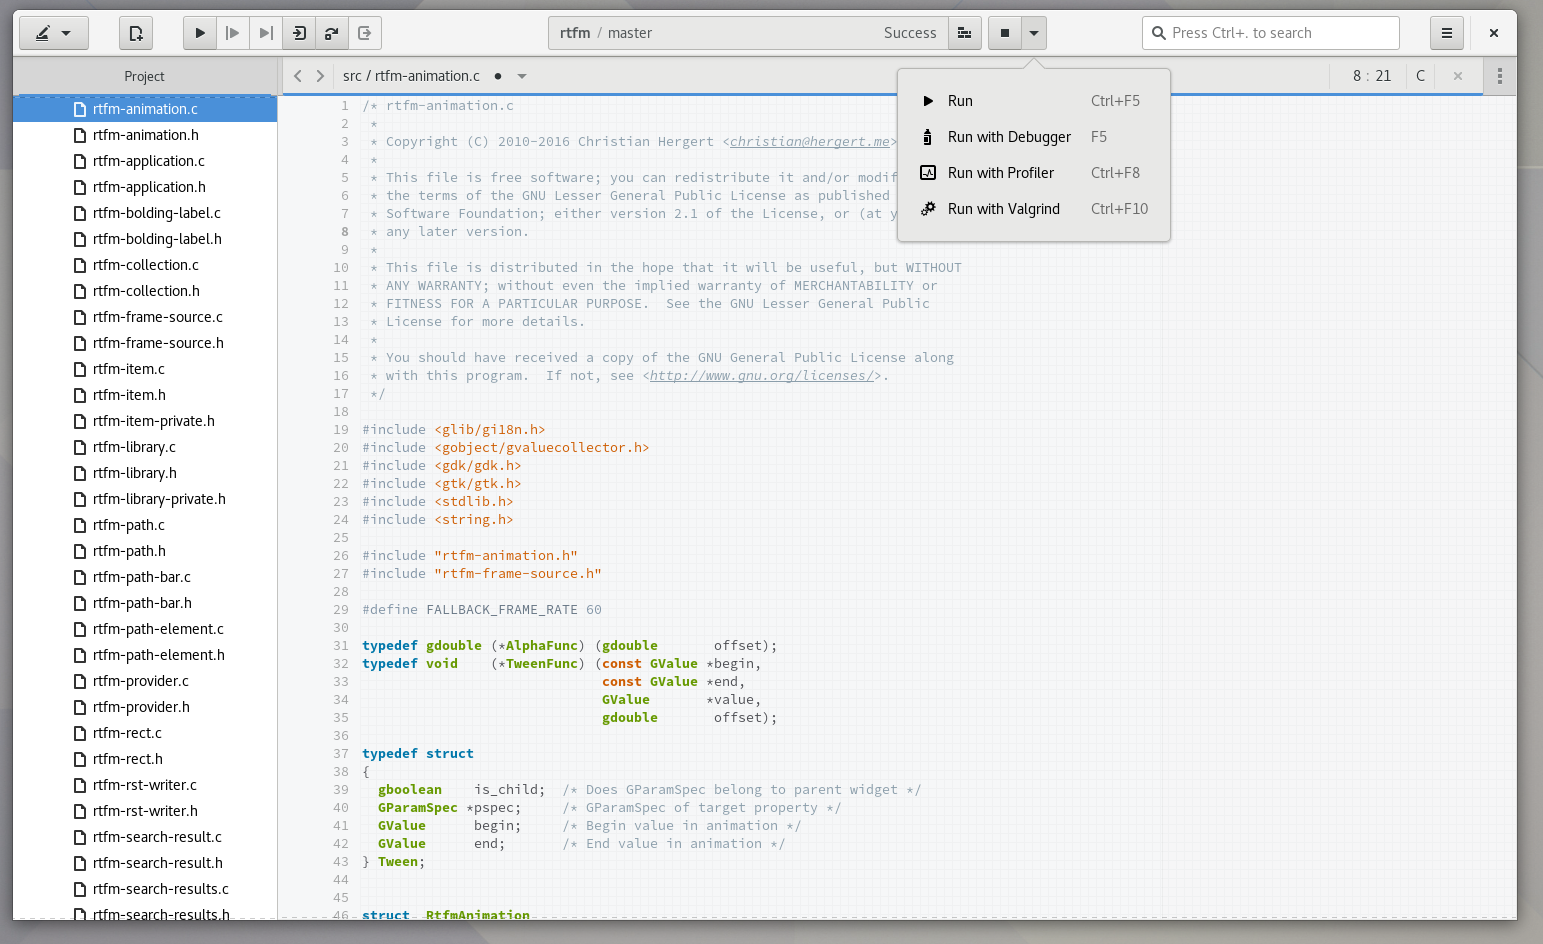
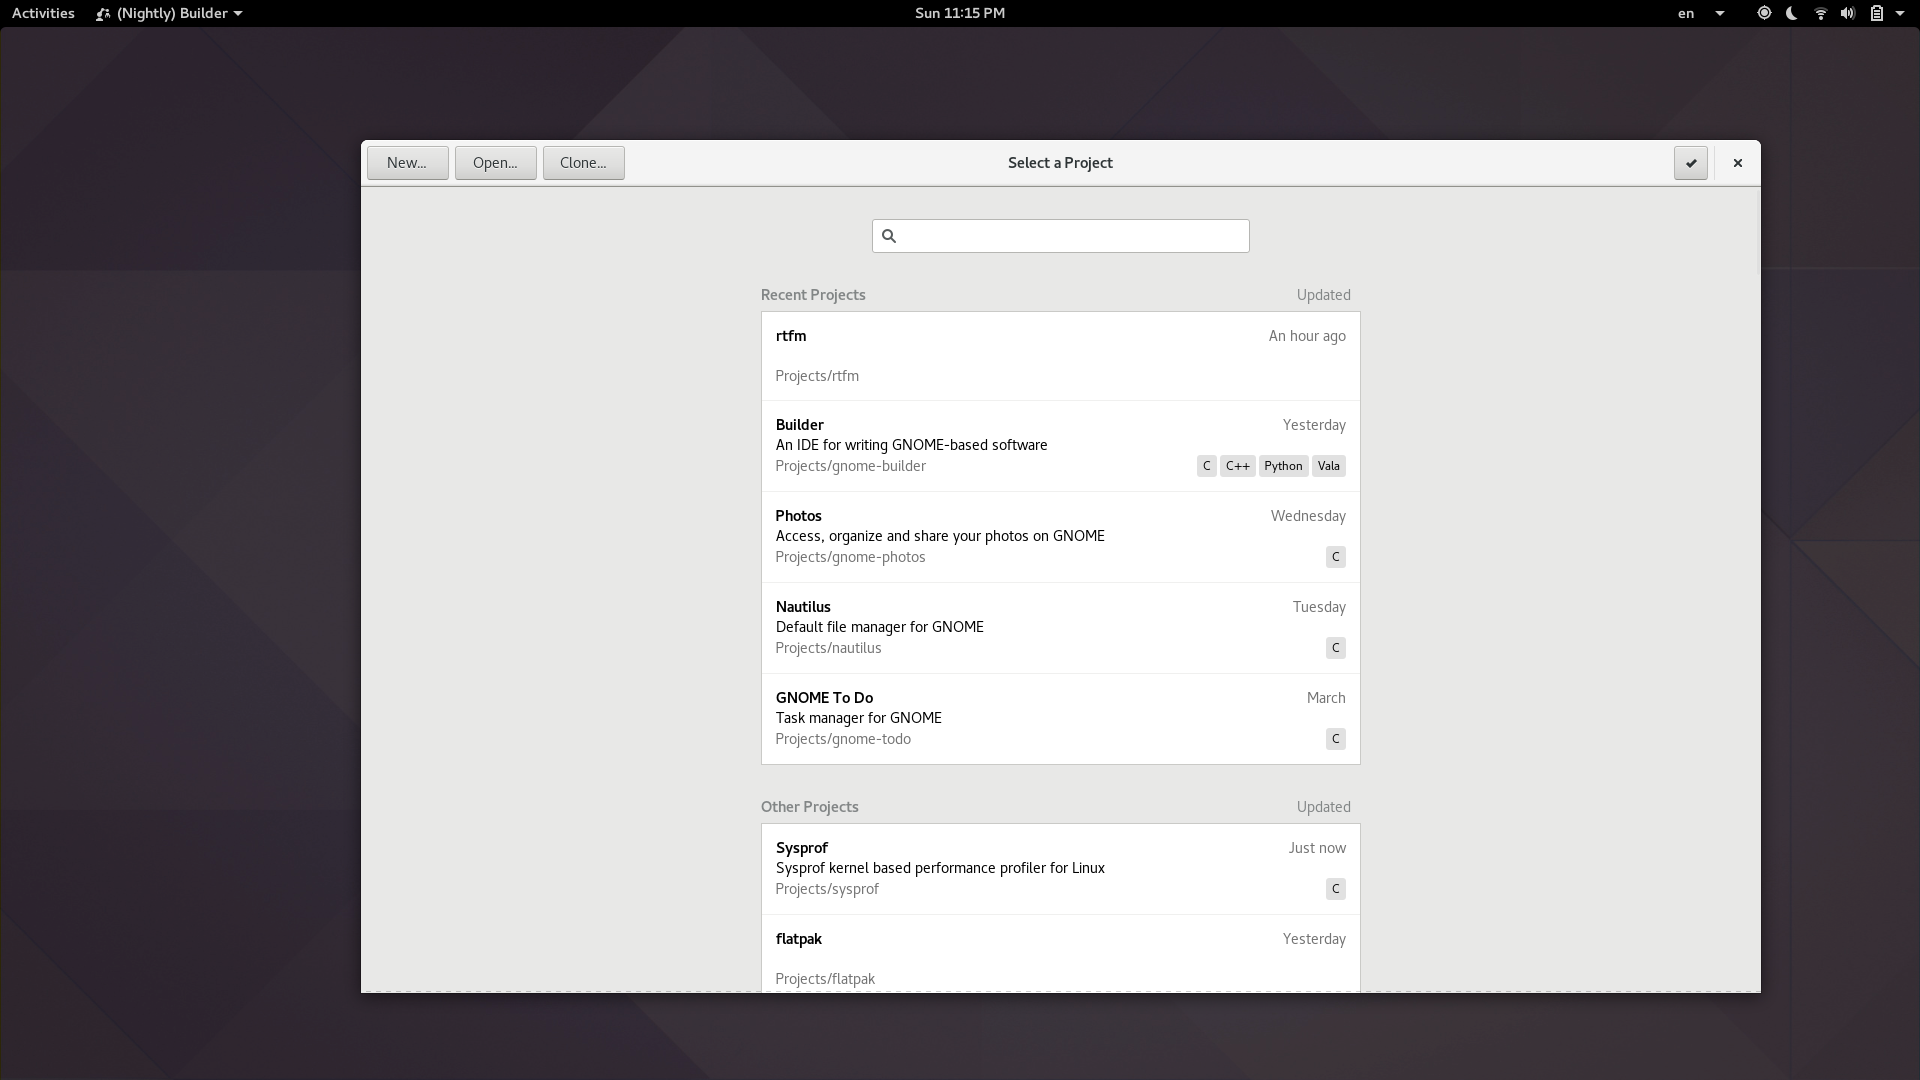
This library is truly the culmination of many years of my time writing flashy Gtk+ widgets and the surrounding plumbing. You’ll find everything from an animation framework, menu merging, tree helpers, missing data structures, caching, signal and property management, a panel engine, layered gsettings, theme management, state machines, keyboard shortcuts (including chords) and more.
It comes in at nearly 50,000 lines of C. You can imagine why I’m tired of the copy pasta.
The project builds with Meson, so it should be easy to use as a sub-project if you don’t want to rely on a system installed version. It has support for GObject Introspection and can also generate a .vapi for Vala if that’s your thing.
There is no documentation yet, but I’m slowly getting more and more tests added which can serve as examples in the mean time. Go read some code, it’s good for you.
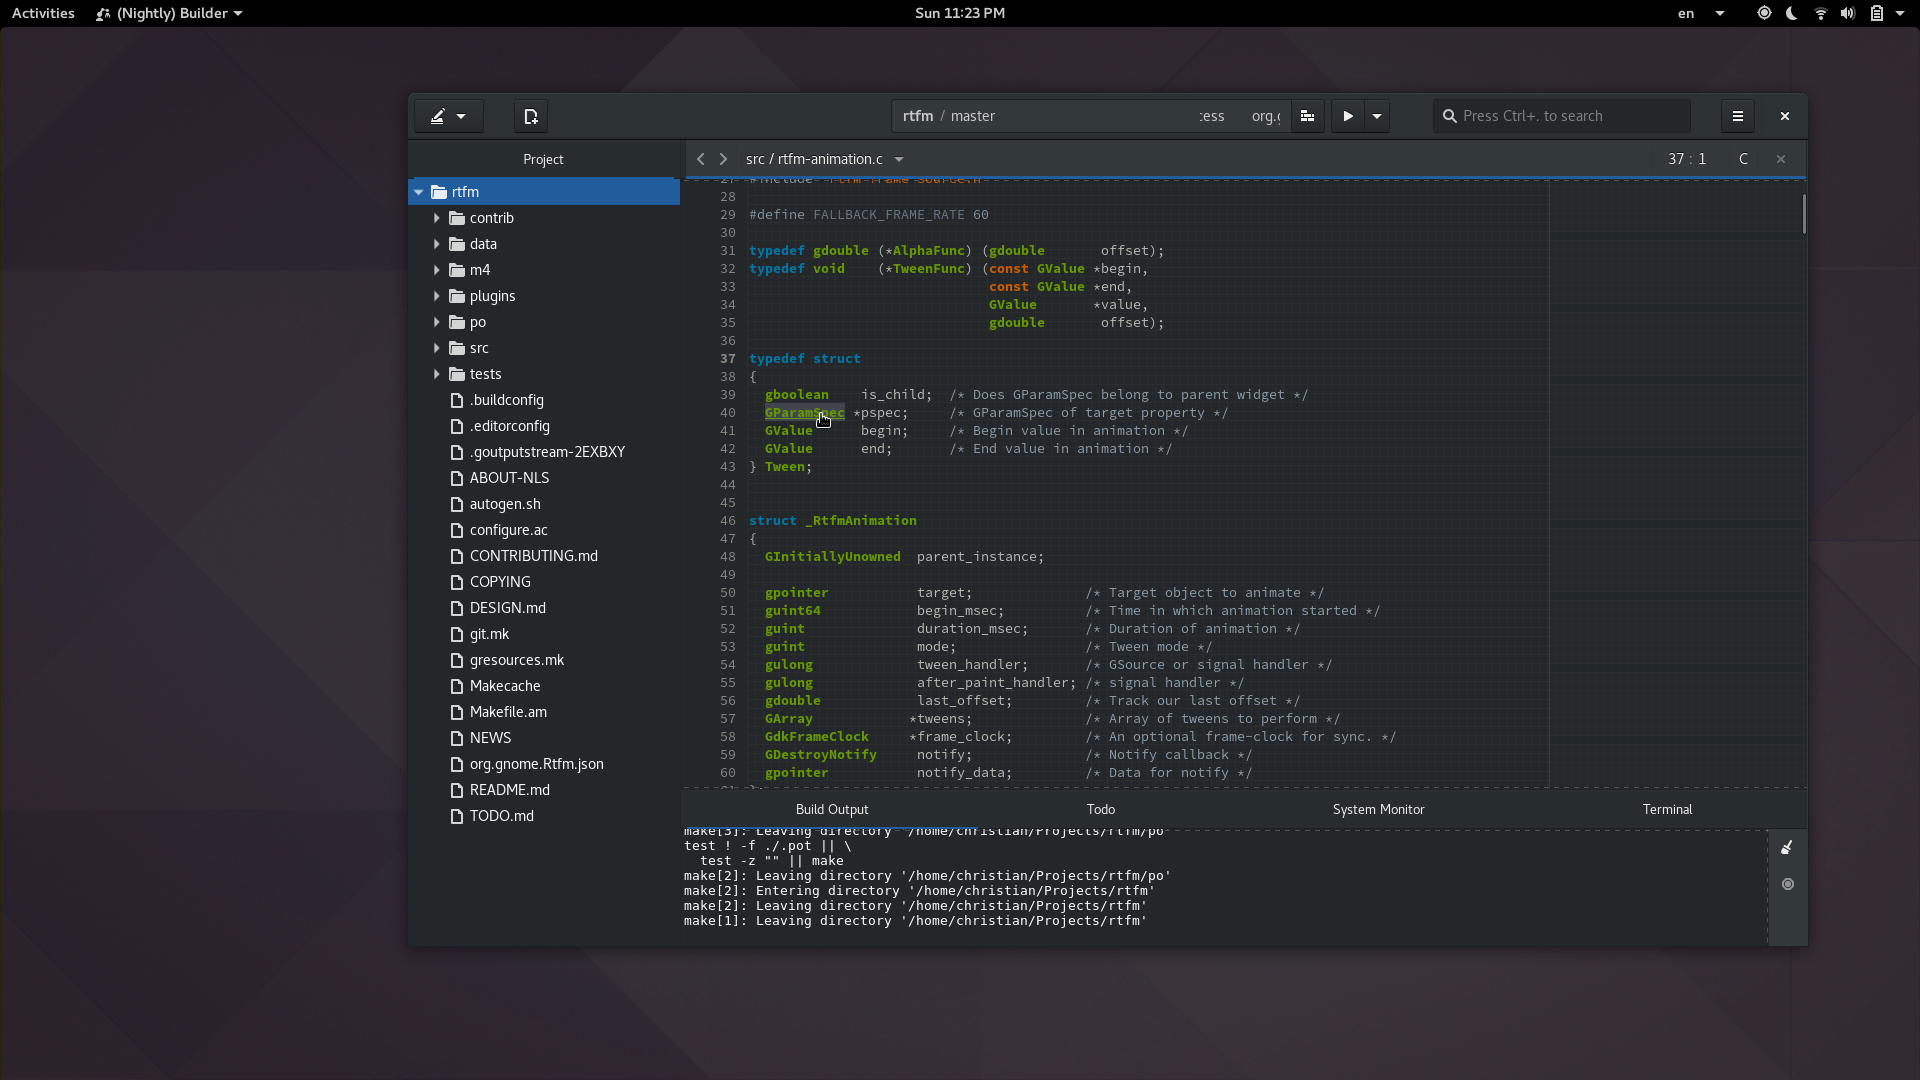
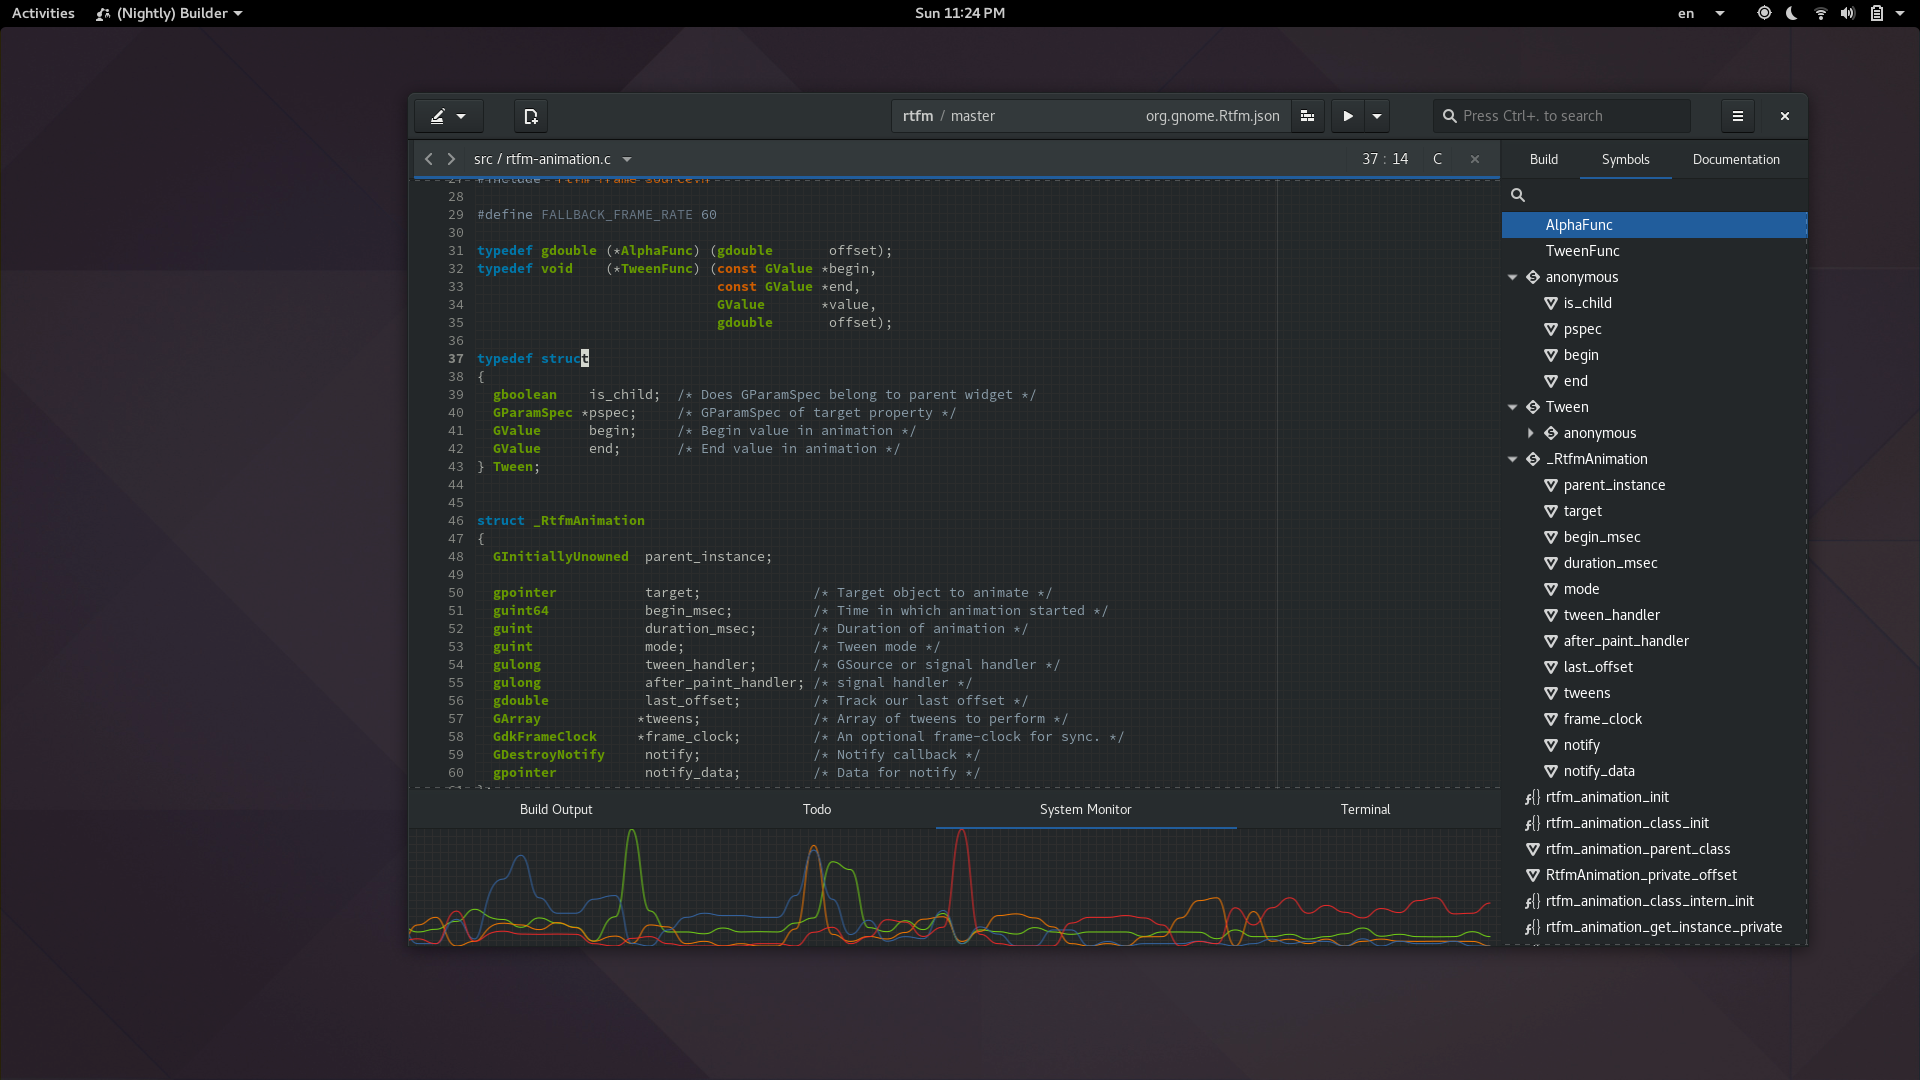
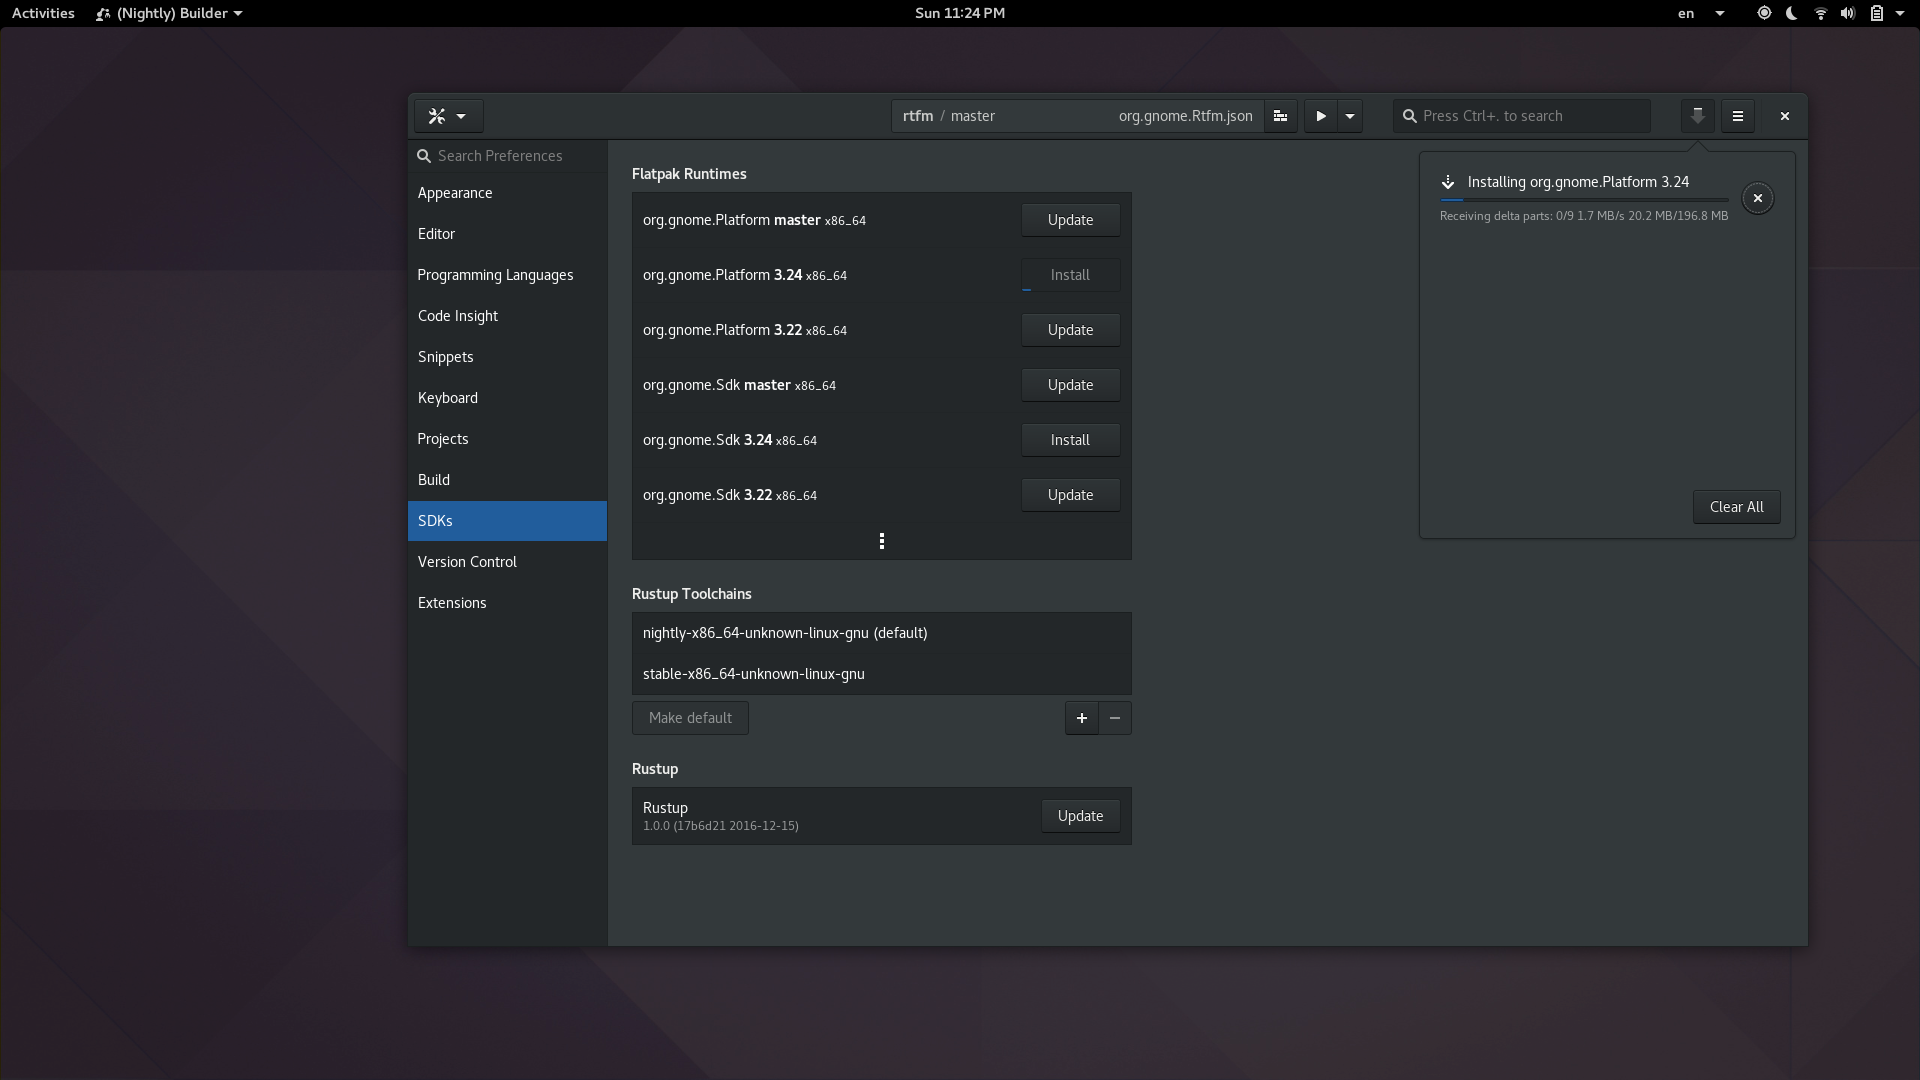
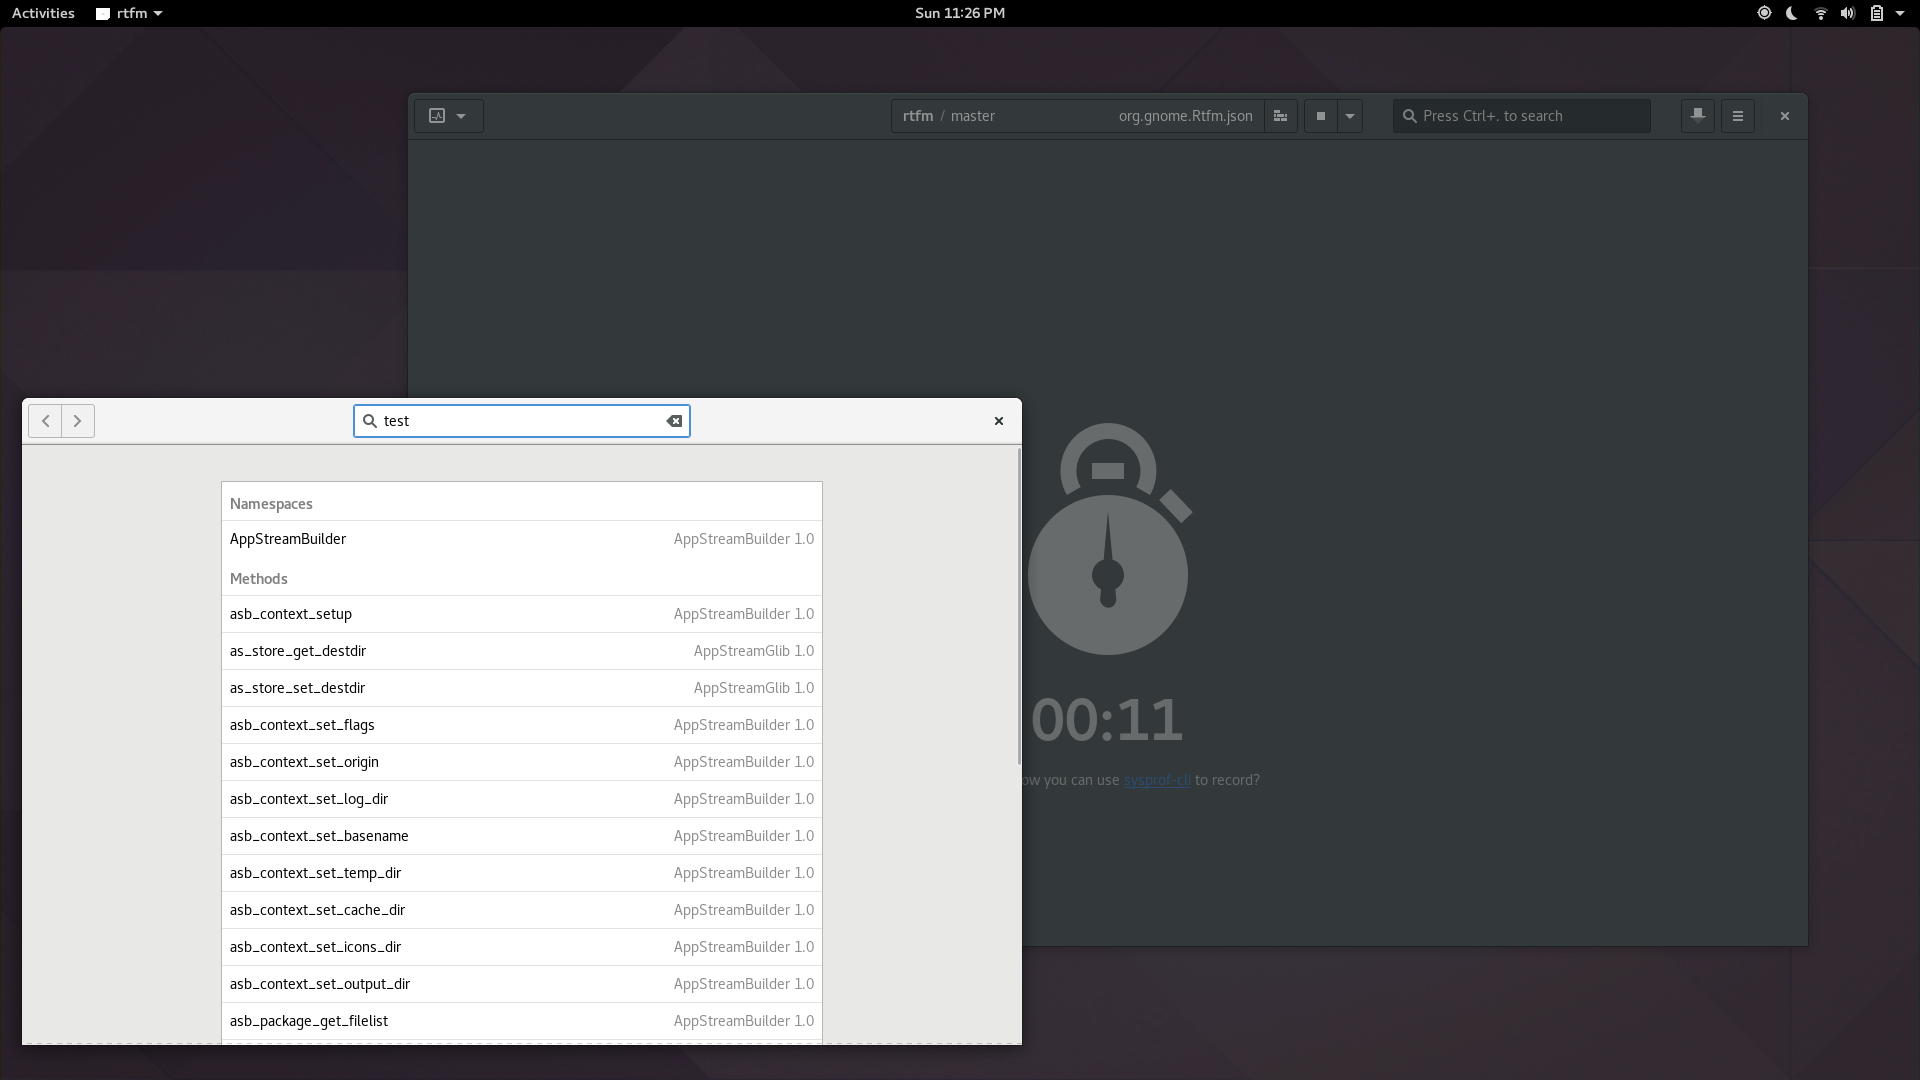
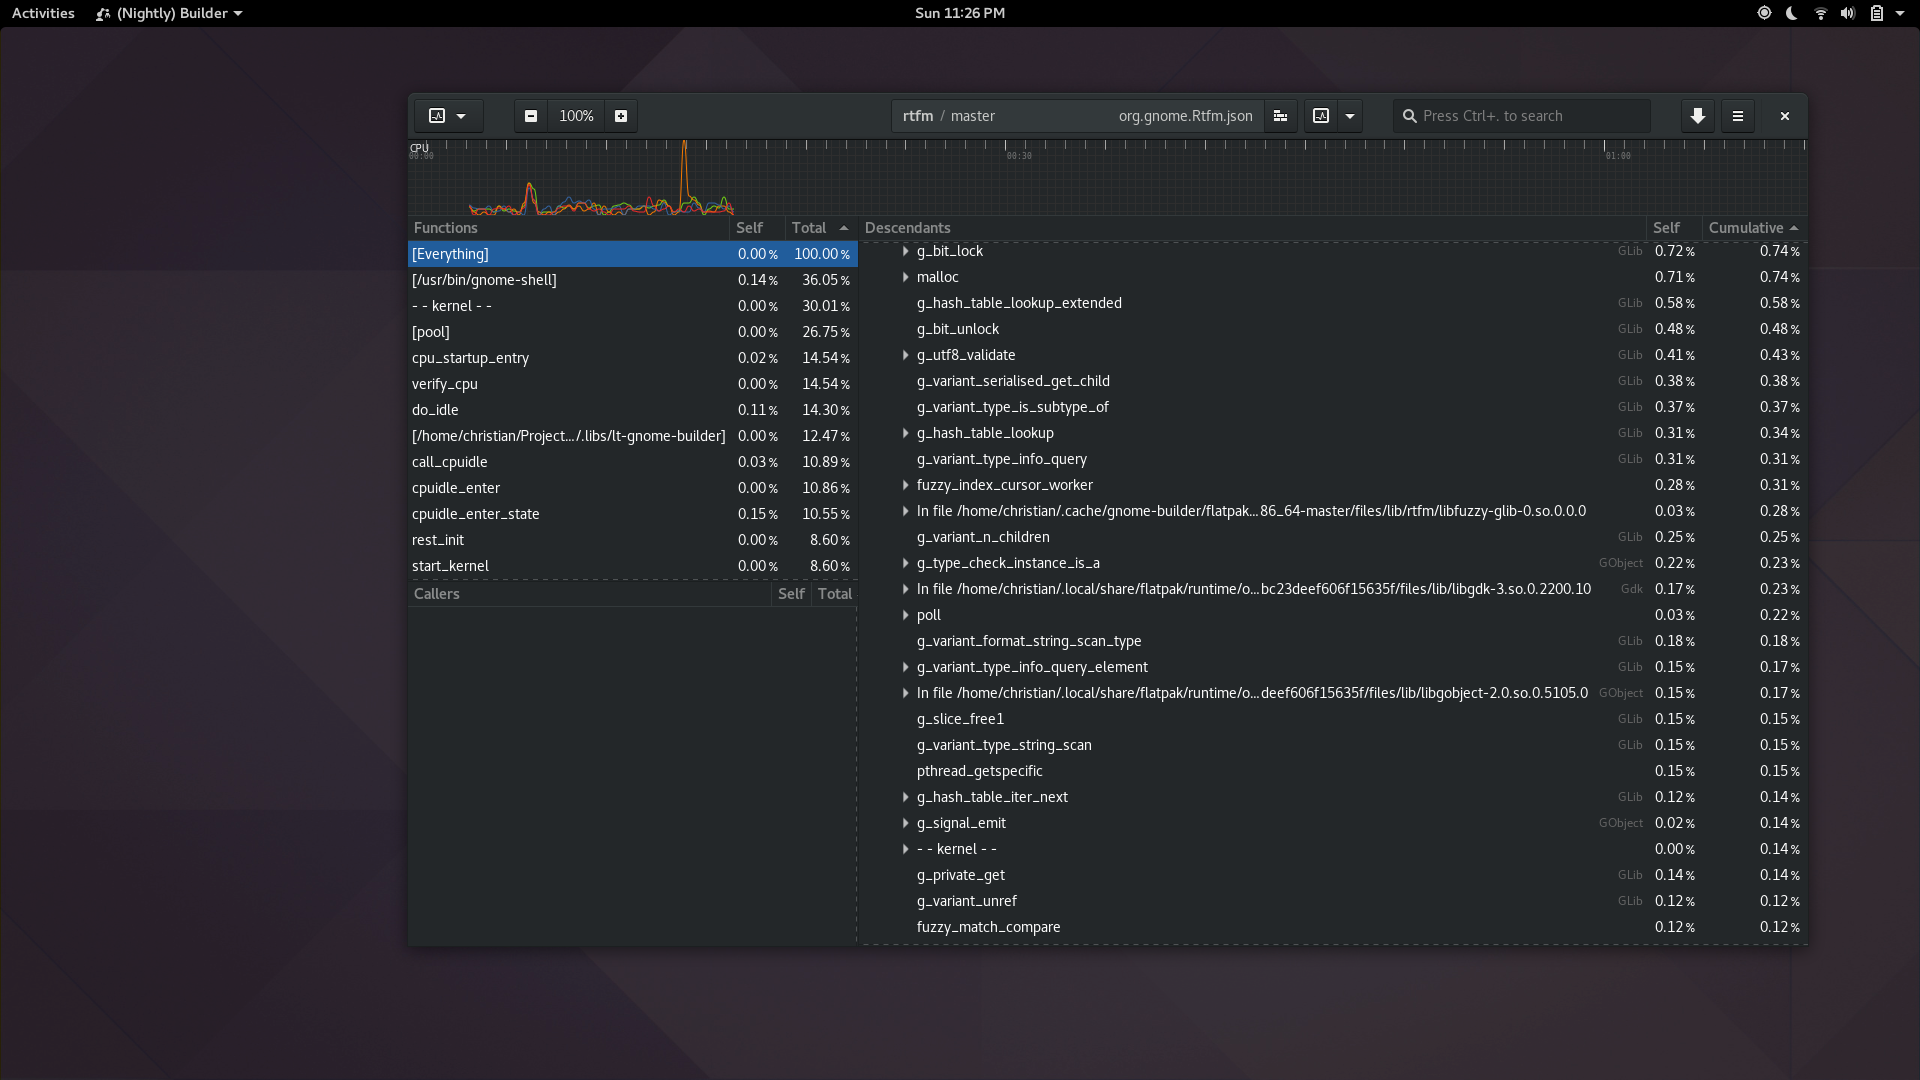
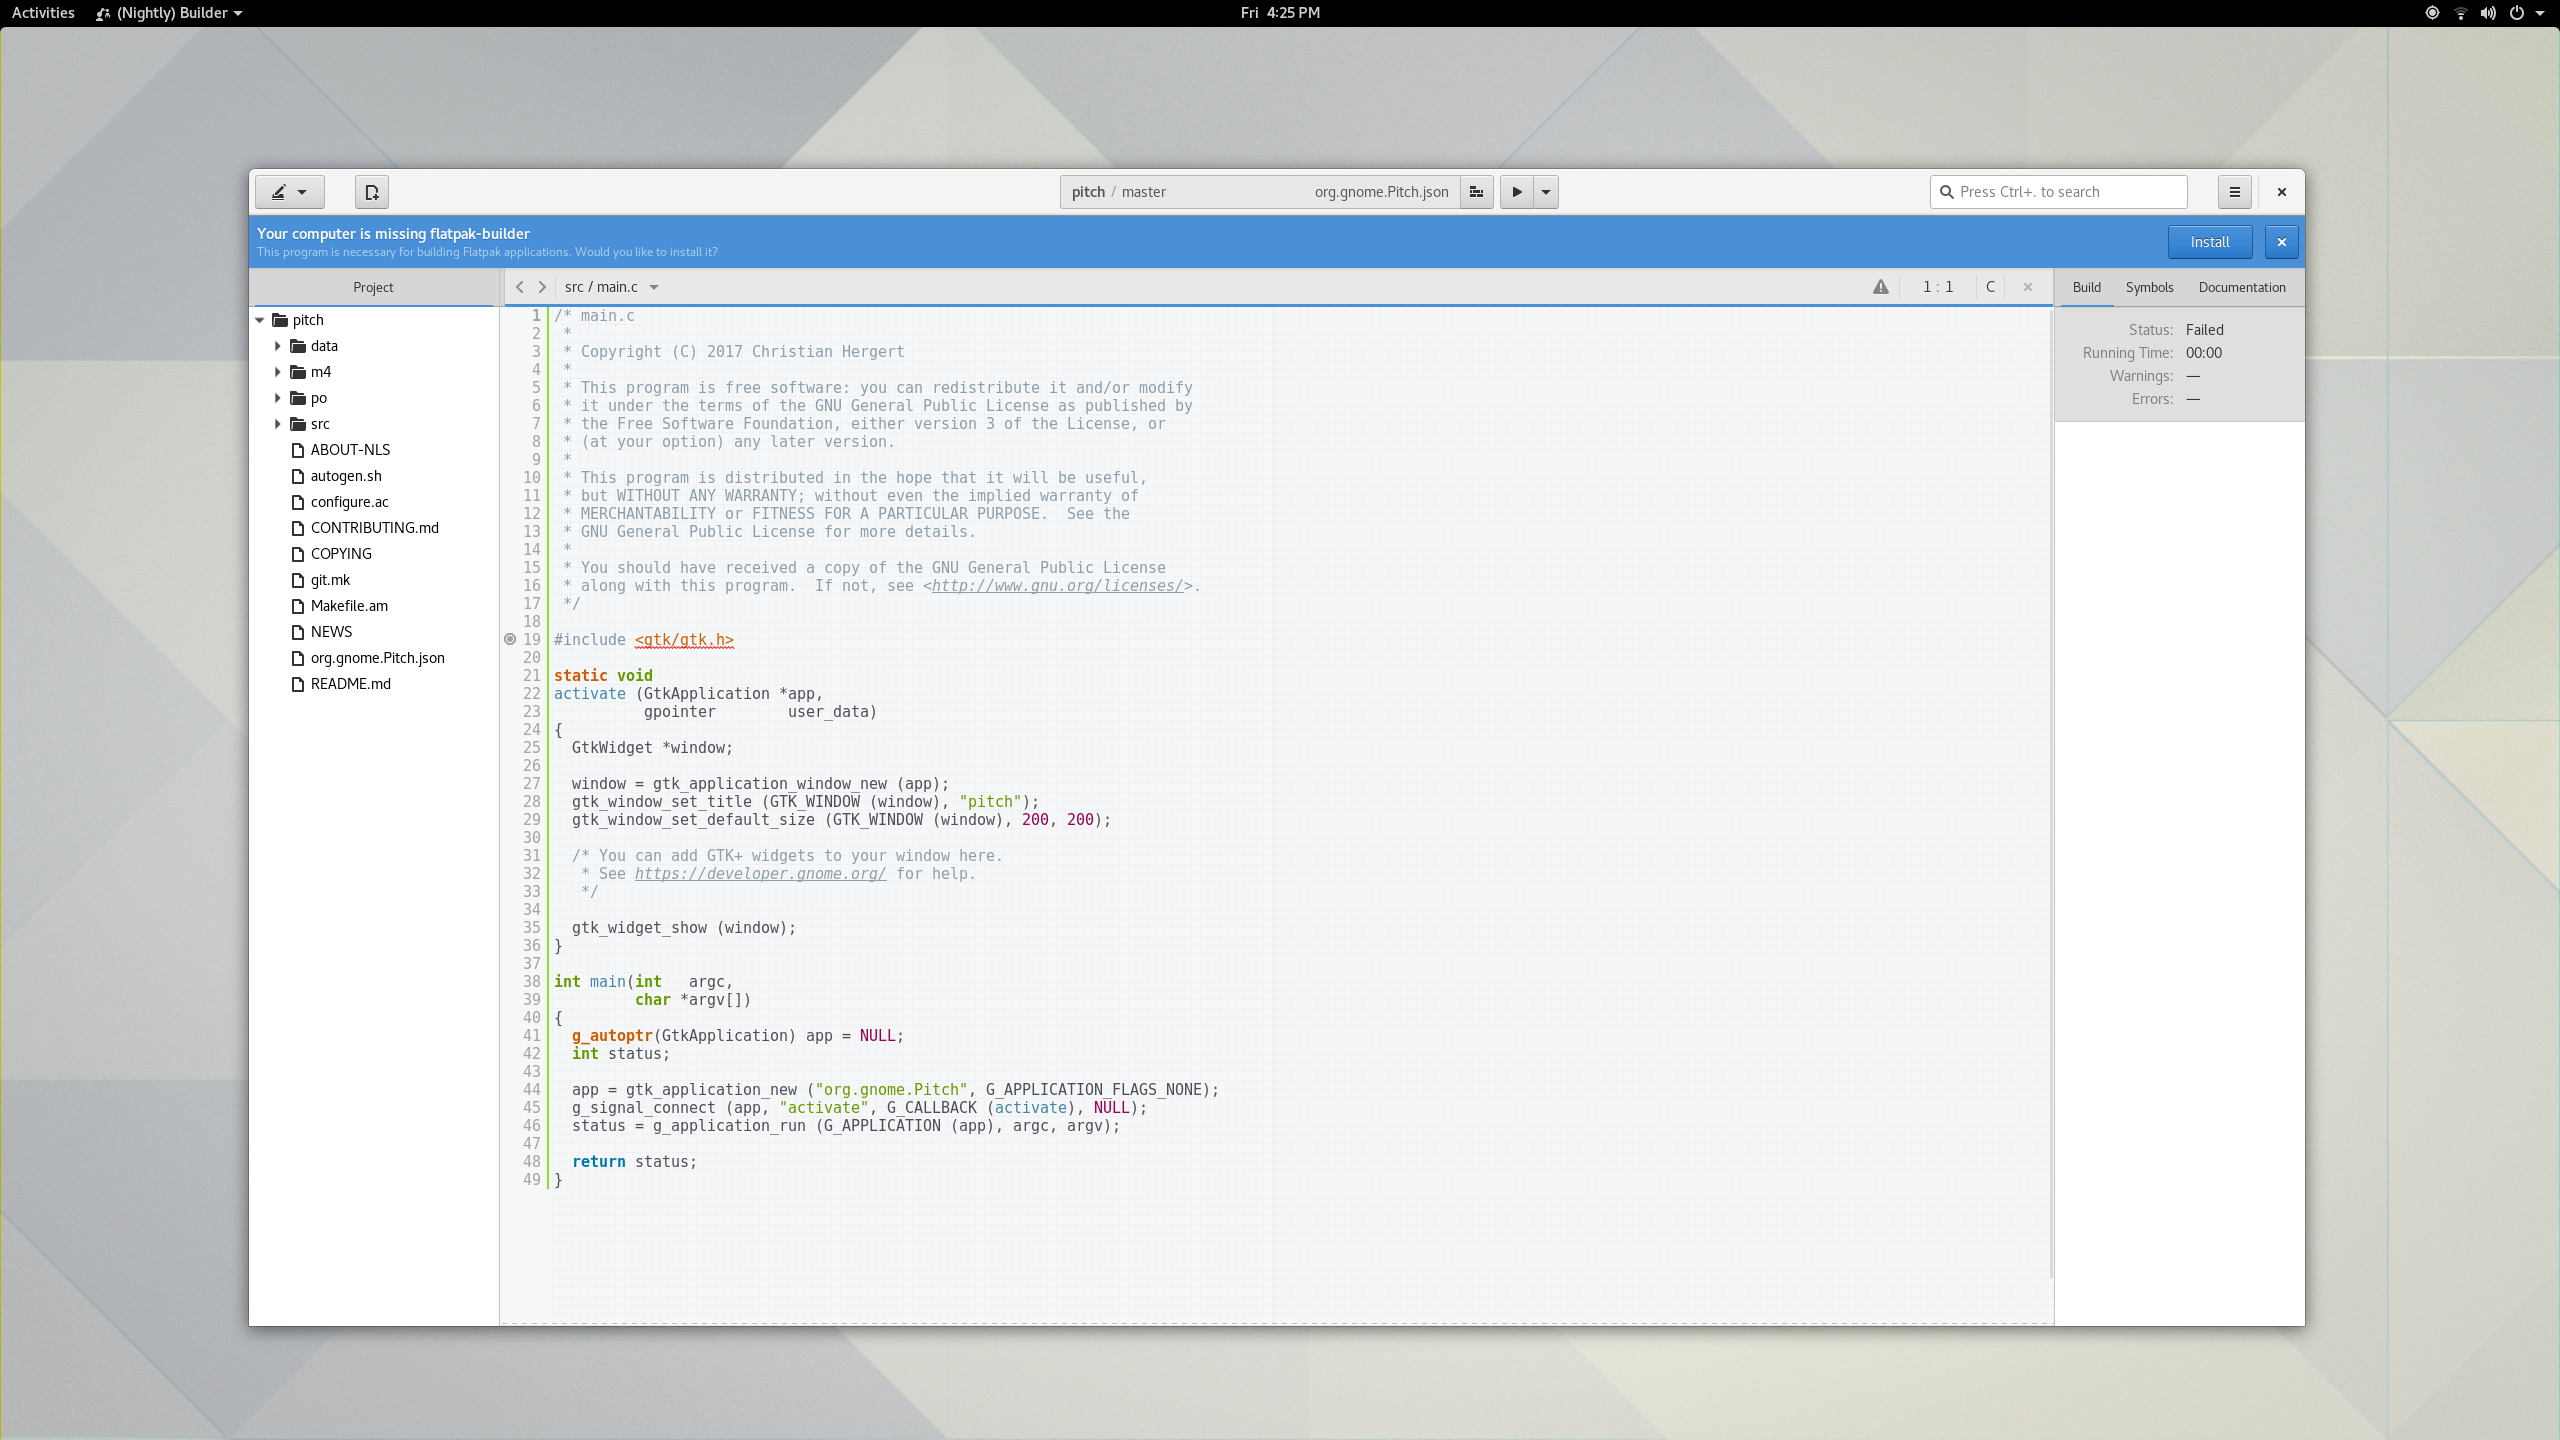
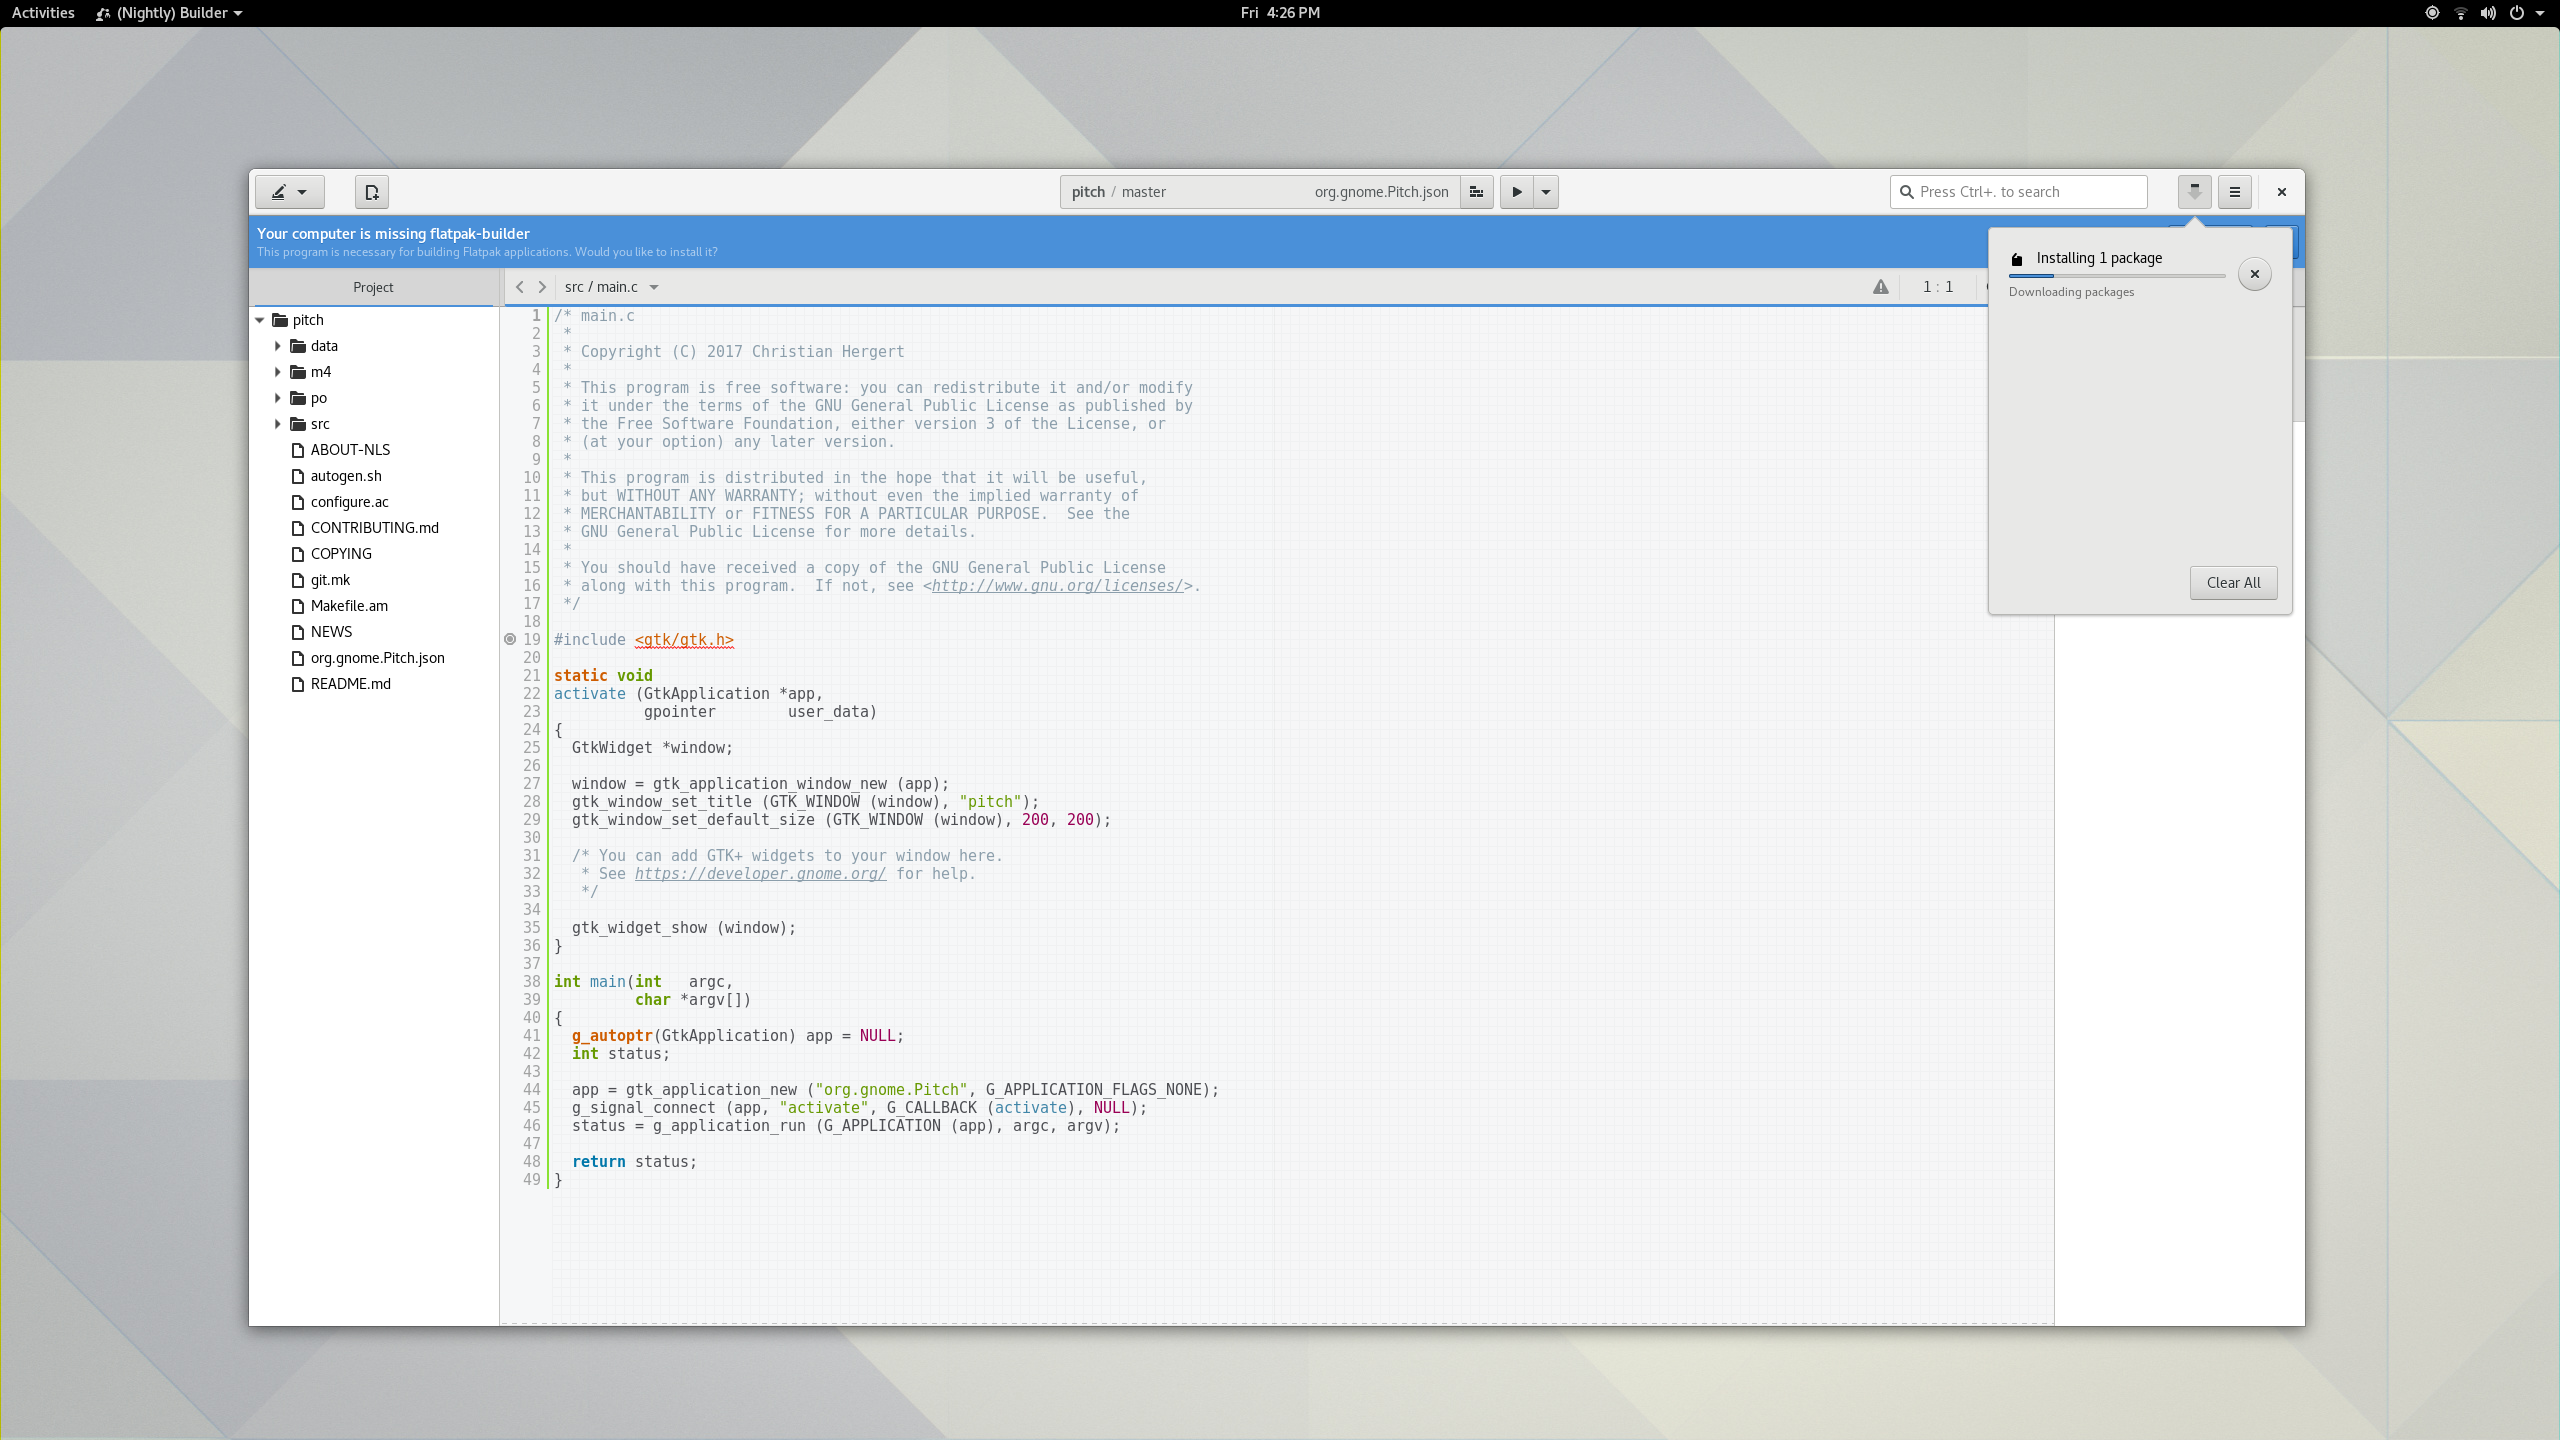
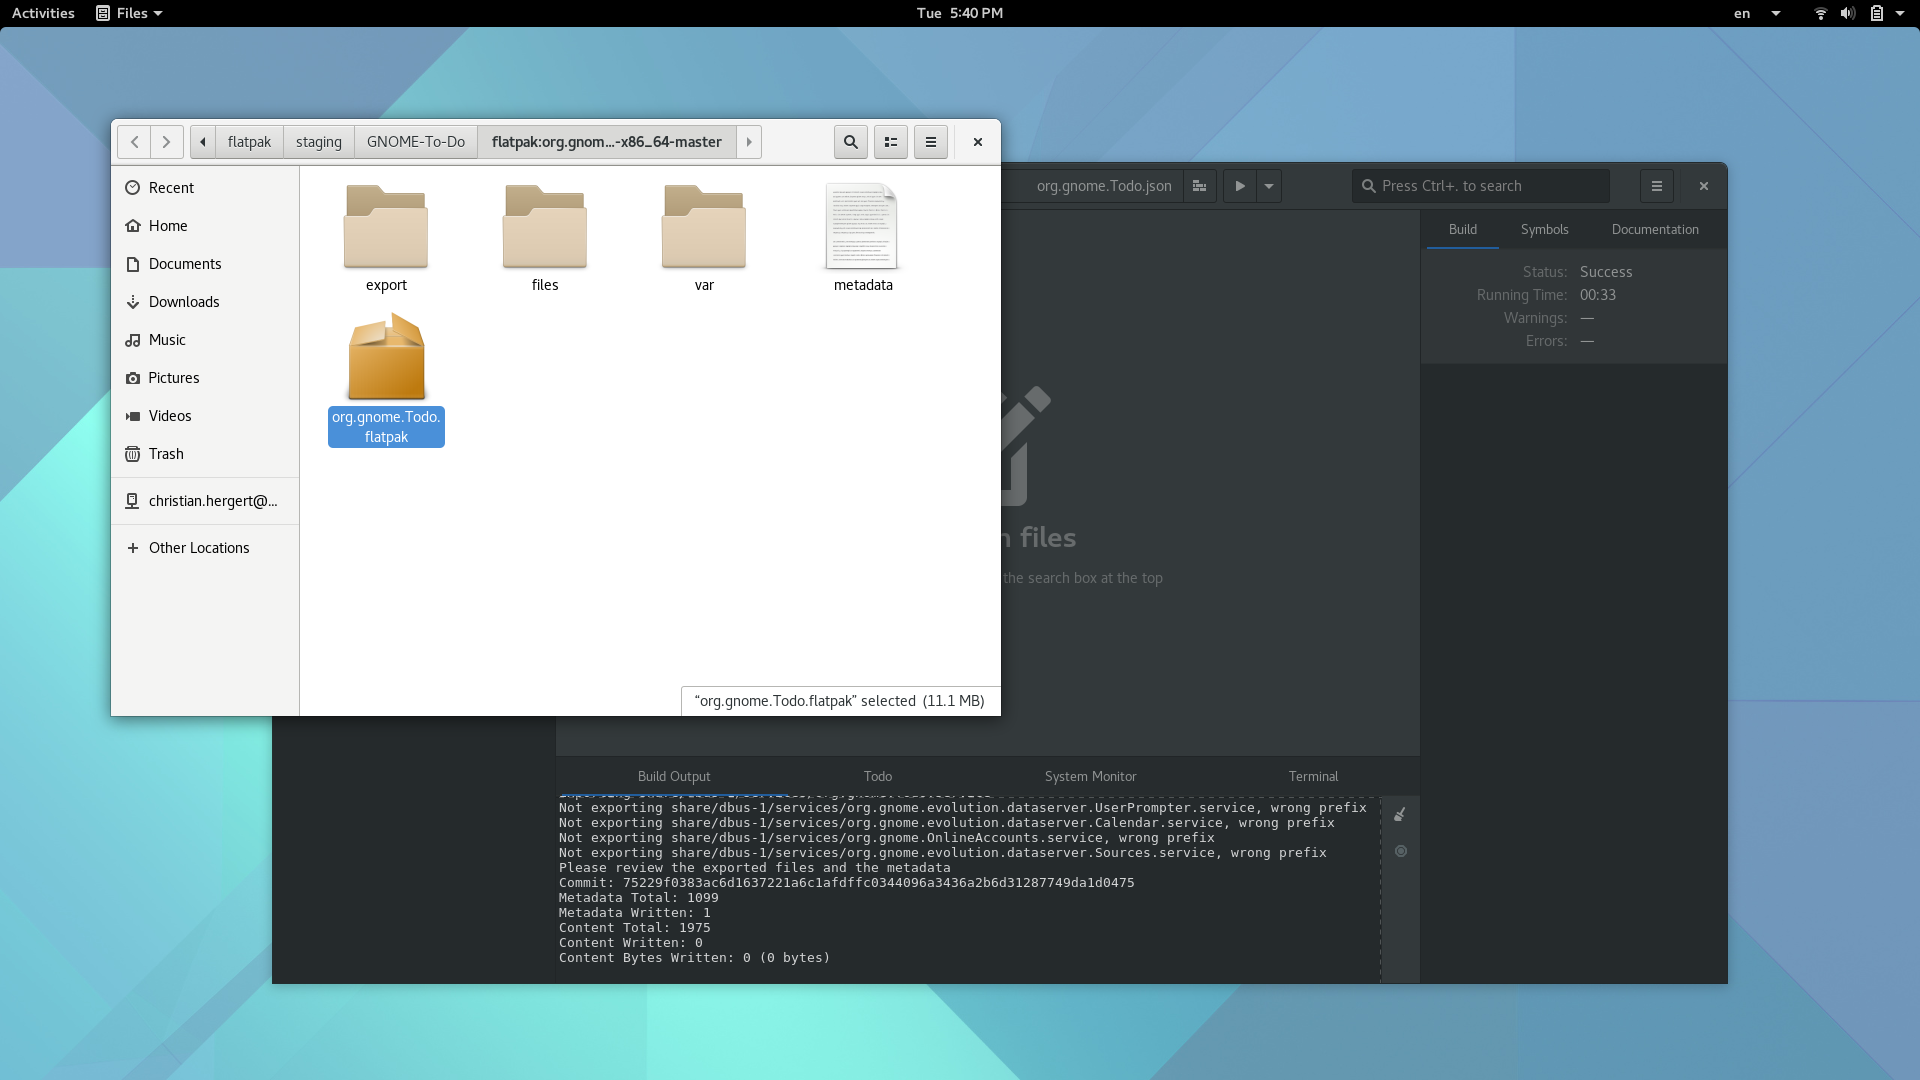
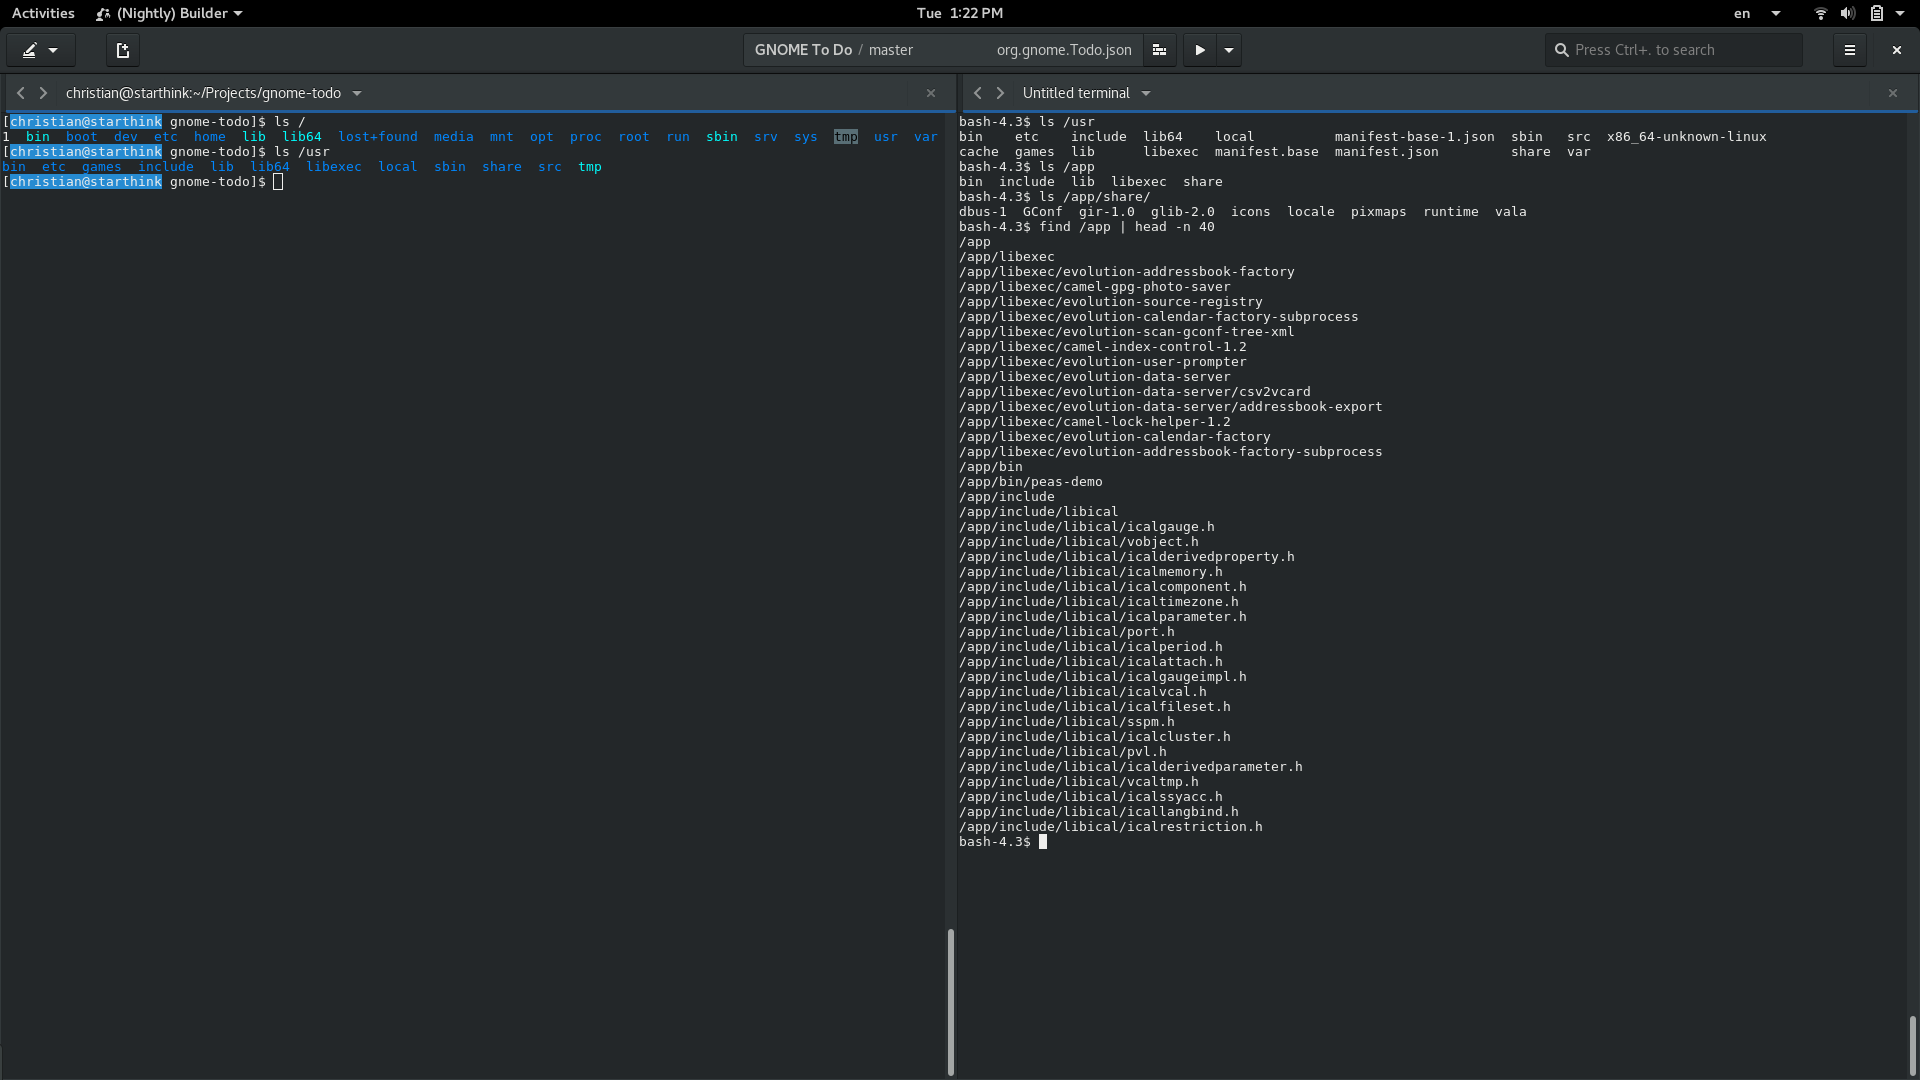
Here are a couple teasers