Decades ago, when you wanted to run debug builds for UI applications, things were incredibly slow.
First you’d wait minutes for the application to present a window. Then wait tens of seconds for each frame to render. You were extremely lucky if Valgrind caught the issue while you exercised the UI.
Things have gotten much better due to movement in two different directions.
In one direction GCC and Clang got compiler integration for sanitizers like ASAN. Instead of relying on extreme amounts of emulation in Valgrind compilers can insert the appropriate checks, canaries, and memory mapping tricks to catch all sorts of behavior.
In the other direction we’ve started drawing modern UI toolkits with the GPU. The idea here is that if the work is dispatched to the GPU, there is less for the CPU to run and therefore less work for the sanitizers and/or Valgrind to do.
Don’t let that fool you though. A lot of specialized work is done on the CPU still to allow those GPUs to go fast. You trade off framebuffer updates and huge memory bus transfers for more complex diffing, batching and reordering operations, state tracking, occasional texture uploads, and memory bandwidth for vertex buffers and the likes.
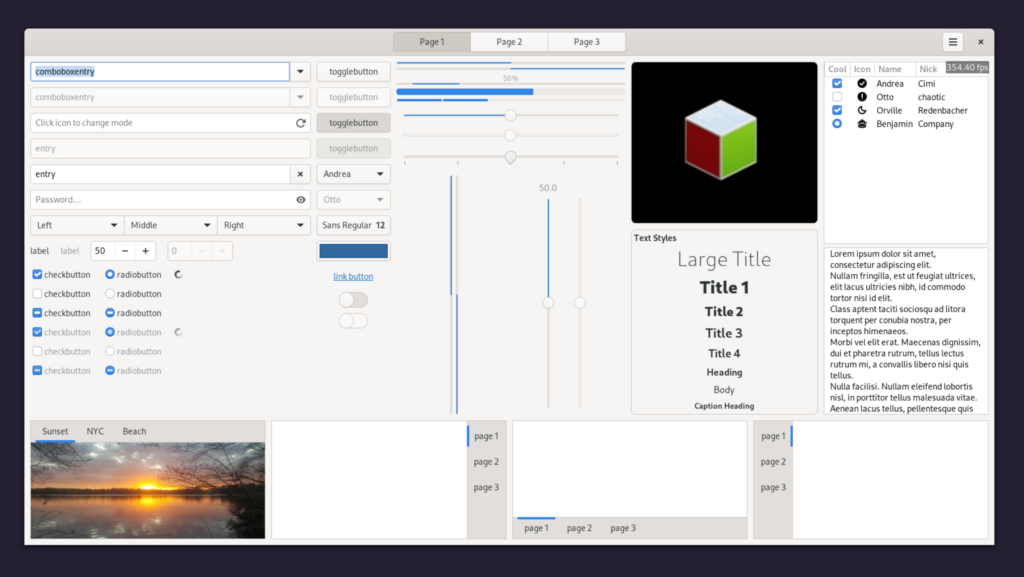
Here I’ve compiled all the hot parts of a GTK application with the address sanitizer. That includes GLib/GIO/GObject, Harfbuzz, Pango, and GTK. The application is also running with GSK_DEBUG=full-redraw to ensure we redraw the entire window every single frame with full damage. We use GDK_DEBUG=no-vsync to let it run as fast as it can rather than block waiting for the next vblank.
And still, GTK can produce hundreds of frames per second.
Truly magical.
