A profiler of our own

So now that you are all aware that I’ve been working to modernize Sysprof, you might not be surprised to read that I decided to push things in a bit more interesting of a direction.

I have a very opinionated stance on languages. Which is, in general, they’re all terrible. Only to be made more terrible by their implementations. Which is to say, we’re all screwed and how do these computers work anyway?

But alas, succumbing to the numbness of existence is not how I want to spend my life, so time to pull up my figurative bootstraps and improve what we’ve got.

So what’s in my cross-hairs this week? Well, quite frankly, those JavaScripts. I’ve worked on a handful of language runtimes, but modern JavaScript engines really take the cake for turning a Von Neumann machine into something completely foreign and utterly non-debuggable, non-profile-able, generally unpleasant for anyone to come in and improve things other than the original author. (Same could be said about C. But wait, I said I *wasn’t* succumbing to the numbness).

Well, that isn’t completely true, given that you only write JavaScript within the context of a browser. The tooling in browsers these days is rapidly approaching something useful. Which is saying a lot when you have a language that is almost exclusively using nameless functions attached to prototype fields.

So here we go, off into the land of mystery. libmozjs24 is our path, with only headers and a few sources to guide us.

So how do profilers work anyway?

Lets simplify this to a static C-like language for the moment.

Say your program is happily running along, maybe processing things from a main loop. Along comes a signal from the kernel. The kernel decides it will deliver the signal to your main thread (see man pthread_sigmask for information on how signals are delivered and how to block them). What happens next is that on top of your current executing stack, your registered signal handler (see man sigaction) is executed.

At this point, you can do a couple of things. Generally, you might use something like libunwind to unwind the stack (past your signal handler) and record each of the instruction pointers for each frame. Using that, you can later look at what library was mapped into the region containing the instruction pointer, and resolve the function name by reading the library ELF (and possibly demangling if it is a C++ function).

If you remember your UNIX handbook, the way to spawn a process (simplified) is to fork(), followed by an exec() of the new process. So how do we get our signal handler into that process?

POSIX timers

In the 2008 version of POSIX, timers were introduced (See man timer_create for more information). They allow you to deliver a signal on an registered interval. Even better, POSIX timers follow through exec but not fork. Exactly what we want. We can fork(), setup the timer, and then exec() our target.

It looks something like this:

struct sigevent sev = { 0 };
sev.sigev_signo = SIGPROF;                   /* Send us SIGPROF */
sev.sigev_notify = SIGEV_THREAD_ID;          /* Linux extension! */
sev._sigev_un._tid = syscall (__NR_gettid);  /* See man gettid */
timer_create (CLOCK_MONOTONIC, &sev, &timer);

The above code creates a timer that we can enable/disable to deliver SIGPROF on a given interval. Note that the above code uses a Linux extension that allows you to specify the thread to receive the signal. Without something like that, you would need to either create a thread to use pthread_kill() to send SIGPROF, or mask SIGPROF from all other threads, lest they receive the signal handler instead of your target thread.

So why is the thread that the profiler runs on important? We’ll get to that later when we start looking at JITd languages.

To activate the timer, we setup our interval (frequency) to sample.

struct itimerspec its = { 0 };
its.it_interval.tv_sec = 0;
its.it_interval.tv_nsec = NSEC_PER_SEC / SAMPLES_PER_SEC;
its.it_value.tv_sec = 0;
its.it_value.tv_nsec = NSEC_PER_SEC / SAMPLES_PER_SEC;
timer_settime (self->timer, 0, &its, &old_its);

Extracting Samples

Now say we used sigaction(2) to setup a signal handler for SIGPROF. And now it is being called via signal delivery of SIGPROF. Our stack might look something like:

our_sigprof_handler()
< signal handler invoked >
some_worker()
main_loop_dispatch()
main_loop_iterate()
main()

We can unwind to get to the root of the stack, stash each of those addresses somewhere, and then return from our signal handler (allowing the program to continue executing).

However, the devils in the details there. We are in a signal handler, which basically means, you can’t do much, safely. Why? Well avoiding deadlocks mostly.

Say that SIGPROF got delivered while you were in malloc()? It might look something like:

our_sigprof_handler()
< signal handler invoked >
do_alloc()
_int_lock()
malloc()
some_worker()
main_loop_dispatch()
main_loop_iterate()
main()

Now, if you try to call malloc(), you’ll deadlock on _int_lock(). Basically, the only thing you can do is write to some memory you have pre-allocated. Buffer space, if you will.

Thankfully, you can do one more thing, which is write() to a file-descriptor. That is handy in case our buffer gets too full.

But you need to be very careful here. Even things like g_assert() could potentially cause a printf() or similar which might internally malloc. So you might need to -DG_DISABLE_ASSERT for production (which you should be doing anyway).

The complexities of a JIT

JITs truly are the magic of our times. They are the meta of the computer to improve itself faster than we can. That said, like your smart friends, they can be super annoying.

Discussing what a JIT is, the added complexity of tracing JITs, and their almost always pairing with garbage collection is out of scope for this. However, there are some excellent implementations you can go read (See mono as one such example of quality engineering).

In this case, the meaning of an address (the function in question, to say) could be the same between two samples, but be part of two completely different functions. Suppose that the JIT regenerated and reused the existing memory.

If you simply went by the address and did not account for the change, then you’d get wildly inaccurate results.

How SPSProfiler comes to the rescue

Thankfully, this work was building on top of SPSProfiler from libmozjs. While we have to provide our own sampler (which we’ve described the basics of above), it provides the necessary JIT integration in a moderately fast manner.

js::ProfileEntry

What mozjs gives us is a way to ask the runtime to deliver the current JS stack into a static buffer that we can read from. Each time JS dives into or out of a function, that “shadow stack” is updated.

However, since libmozjs has a garbage collector, if we were to access this stack information from any other thread, we’d be racing the GCing of strings pointed to by that shadow stack. So we need to ensure we interrupt the executing stack (hence SIGPROF, timers, etc).

Racing with a GC doesn’t matter in a C like language because, well there is no GC, and we can resolve symbol names after the fact because of ELF and DWARF debug information.

volatile uint32_t stack_depth = 0;
js::ProfileEntry stack[1024];
js::SetRuntimeProfilingStack (js_runtime,
                              stack,
                              &stack_depth,
                              G_N_ELEMENTS (stack));
js::EnableRuntimeProfilingStack (self->runtime, true);

Deduplicating Functions

To get the function name for JavaScript functions, we can simply read the string pointed to by the js::ProfileEntry. Something like:

if (entry->js()) {
  const gchar *name = entry->label() ?: "-- javascript --"
}

Now, if we had to copy that string for every instruction pointer in the stack, on every sample, we’d have pretty significant overhead in our profiler. So we do a bit of a deduplication hack. We have something that looks like a chunked allocator (GStringChunk) except it can’t be an allocator, because oh wait, in a signal handler.

So instead, we just have a fixed buffer size to store a single instance of the string, and a closed hashtable (no allocations required) to help with our deduplication.

While we fill the deduplicated function buffer, we hand out monotonic address identifiers for each new string. We steal some high bits in the address to indicate that this is a JITd function. (0xE << __wordsize-8). Normally this would colide with kernel addresses, but not in practice.

So now we can just replace our JITd addresses with these and store them like we would normally for C-like stacks.

What’s missing?

While SPSProfiler will put JS information (including native code) for functions before the current JavaScript frame, it doesn’t seem to give info after the current JS frame. So if your JS code calls into C code, which doesn’t result in a callback back into JavaScript code, getting reliable stack addresses is non-trivial. Maybe I’m missing something here though.

I need to go read some more code, because I’m likely to believe there is a way to deal with this, but might require newer libmozjs. Anyway, future blog post and all.

Capture formats

My new sysprof implementation uses a new binary capture format I’ve put together. Basically something really simple that lets me get data into the buffer quickly without too much fuss, alignment safe (allowing dereference of integers from the buffer with out use of memcpy()) and without the super annoying reality of Linux’s perf event stream which has dynamic trailing data based on what options were enabled when sampling. Seriously, don’t do that.

I still have some things to add, but this is the first step towards making more interesting captures (like in-app performance counters, VBlank information, compositor FPS, GTK+ frame timings, etc).

So what does that even mean?

Well, I guess you can see for yourself. Here is a simple capture I did to pick on GNOME documents (no reason really, just the first JavaScript/C hybrid app that came to mind) showing Sysprof reading our JavaScript profiler output.

Gjs Profiler

There is still some work to be done. I need to get the Gjs patches in a format suitable for inclusion. That means fixing up some boring signal handler code to be more safe. Ray Strode has already provided some good feedback here.

Additionally, I need to get my sysprof2 repository grafted into upstream Sysprof. This week I swear. We also need to get patches into some programs that use libgjs directly without the use of gjs-console so that they too can be profiled. gnome-shell is the obvious culprit here.

Come hack on Sysprof with me? Please?

If any of this interests you, I’d love to have some people come help work on modernizing Sysprof into something we all love. It’s still missing one thing I loved while working on PerfKit years ago. Pretty graphs and charts of runtime information. We can start sampling cpu, memory, network, kms/drm information, and more. With that data available, we can build some pretty compelling tooling for GNOME and GNU/Linux in general. (BSDs obviously too, but today Sysprof is Linux only due to the Linux kernel integration).

No doubt, there are gaps and missing information in this blog post. It’s hard to capture all the details after you do the work. For the nitty-gritty details, best to go look at the code.

  • https://github.com/chergert/sysprof2
  • https://github.com/chergert/gjs
  • Build/install the code above.
  • gjs-console --profile-output=foo.syscap /usr/bin/gnome-documents
  • You might need to let it exit gracefully, I don’t have periodic sample flushes implemented yet.
  • sysprof foo.capture
  • Explore!

Thanks to Red Hat for letting me dive head first into this. They really are the best employer I’ve ever had.

JavaScript (Gjs) Profiling

So this happened…

Sysprof learns a new trick

Everything is still sort of a work-in-progress, but soon I expect to have patches for all the right people in all the right places. There is a lot of slight-of-hand going on here, so it’s worth taking some time to get the details documented.

Making profiling easy

One of the tools we often find ourselves using when working on GTK+ is sysprof. While doing some profiling recently, I got annoyed that it was one of the few programs on my system that required GTK+ 2.x.

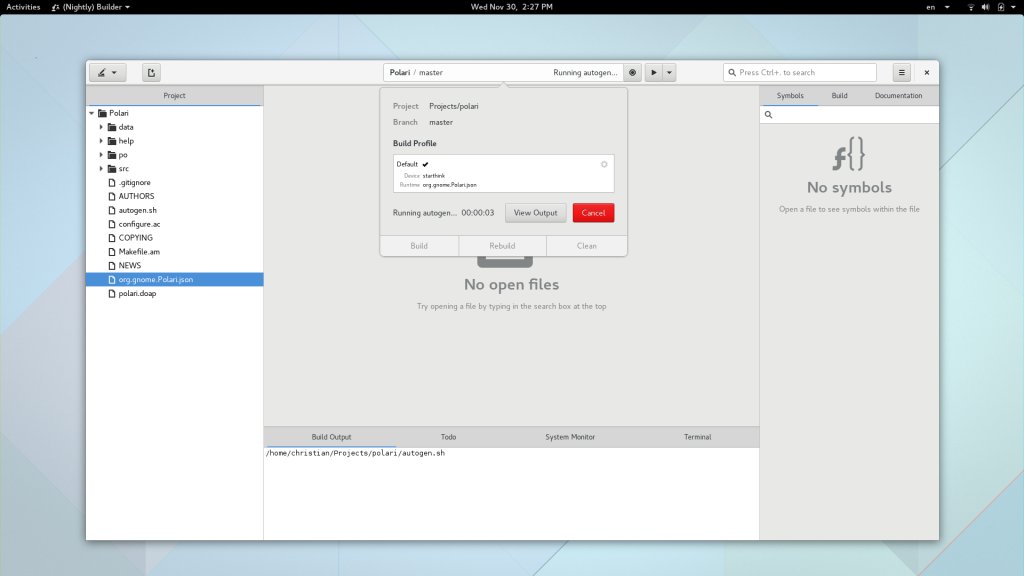
I decided to improve things over the last week and see if we can make something that could be used with Builder too.

First, I needed a library so that we can consume these bits from Builder. So now there is a libsysprof-2 library. The modules have been cleaned up to fit into typical GObject-style library usage.

There were some rough edges on the UI as well. For example, if you tried to launch a profile from the UI, it would fail because non-root users cannot call the __NR_perf_event_open syscall. Getting around this requires running the UI as root (non-ideal) or having a helper process that can run as root and perform the syscall for you. Obviously, I went with the latter. That means there is now a sysprof daemon that uses polkit to check for authorization. GNOME Shell users will see the typical authorization dialog if your DBus connection to the daemon lacks the required credentials.

Additionally, I abstracted the event sources. This will allow us to plug in additional data in the future like cpu, memory, network, systemtap probes, and more.

Due to abstracting the new data sources, I needed a new capture format. I decided to put together a very simple binary capture format for now. It makes things rather simple so we can have mmap() windows as we capture events to disk. We also support memory captures thanks to memfd (and the same mmap window code).

For the inevitable question of “Why not just use the perf capture format?”, my answer right now is simply that I hope to support more than just perf captures and I’d like to have everything in a single file.

I’m going to start merging this into sysprof on git.gnome.org over the next week, but if you want to take a look at things now, you can find the code here.

I really hope that moving this project forward inspires some of you to jump into the code base and help. There is so much we can do in this space. Having great tools helps us all write greater software faster.

sysprof-blog1

sysprof-blog2

Screenshot from 2016-04-03 03-49-54

sysprof-blog3

sysprof-blog4

How to setup distcc (and ccache) in Builder

If you find yourself with a distcc setup, you might be wondering how to set it up in Builder. Let us assume you’ve setup a distccd on a Fedora 23 server doing something like the following.

# dnf install distcc-server
# echo 'OPTIONS="--jobs 24 --allow 192.168.122.0/24"' >> /etc/sysconfig/distccd
# systemctl enable distccd.service
# service distccd start

Now open your project in Builder and go to the configuration perspective.

Build Configuration

Duplicate the configuration and add the CC and DISTCC_HOSTS environment variables like below. I like using -std=gnu11, but you need not do the same.

Add CC and DISTCC_HOSTS

Keep in mind, that distcc is not magic pixie dust. It isn’t always faster than compiling locally.

Now that we have a basic distcc setup, lets extend it to use ccache to cache compilation results that are exactly the same as previous builds. First make sure you have ccache installed.

# dnf install ccache

Next tweak the environment variables to use ccache gcc as our CC, and instruct ccache to use distcc by setting the CCACHE_PREFIX environment variable to "distcc".

Using ccache as CC

What can you extend in Builder?

Erick asked recently about what you can extend in Builder. I figured that would be better as a blog post, so hopefully he doesn’t mind the public attention!

Of course, everything in Builder is under development, and there are lots of things that are not yet ready for prime time as plugins. But we are getting there pretty quickly.

Also note, that this list is based on 3.19.90, which was just released last week. It looks a little something like this.

Screenshot of Builder 3.19.90 in with Dark Mode theme

Completion Providers

IdeCompletionProvider, which is really just an extension of GtkSourceCompletionProvider allows integration with auto-completion in Builder. There are a bunch of examples in-tree. Clang is rather complex, but there is also Python Jedi, and Ctags.

Application Addins

As discussed previously, IdeApplicationAddin can be thought of singletons within the application. A nice way to share information in your plugin that is not project specific.

Application Tools

An IdeApplicationTool allows creating a sub-command that is accessible using the ide command. Compare this to how you use the git command line tools.

Services

An IdeService is similar to an application addin, but is per-project. So each loaded project in Builder will have the service instantiated. We use this in the clang plugin to manage background AST generation. We then use these ASTs to do things like auto-completion, symbol resolving and symbol tree, semantic highlighting, and more.

Build Result Addins

When performing builds with Builder, you might want to extract information from the build output. This is exactly what the GCC plugin does to extract build time diagnostics. Your extension will be loaded when building and can receive callbacks or signals during the build process. See IdeBuildResultAddin.

Build Systems

The Build System support in Builder is provided by plugins. Currently, we only support autotools out of the box. However, I’m looking forward to contributions for more build systems. To implement a build system, you’ll need to take a look at IdeBuildSystem, IdeBuildResult, and IdeBuilder.

Devices

It’s no secret that my goal for Builder is to raise the bar in terms of developing with external devices. We don’t have much using this yet, but the goal long term is to listen to udev events and show devices as they are added in Builder. See IdeDeviceProvider for adding support here. Long term, this will be integral when interacting with IdeRuntime so that we can setup cross-compilers.

You can even imagine the devices being remote and connected via SSH.

Semantic Highlighting

Builder has support to make writing semantic highlighters easier. One of the tough parts of writing a highlighter is doing so at such a rate that does not block the main loop or make the UI stutter. IdeHighlighter is how we do this. Some examples are our clang highlighter and xml highlighter.

Auto Indenters

While I have grand ideas for new ways to write auto-indenters, our interface IdeIndenter will probably not need to change. This type of thing is always a lot of spaghetti code, rife with backtracking. But in 3.22 I hope to simplify this with a new “selector-based” indentation engine. More on that in the coming months. Currently we have a basic GNU C89 indenter, Python, XML, and Vala.

Perspectives

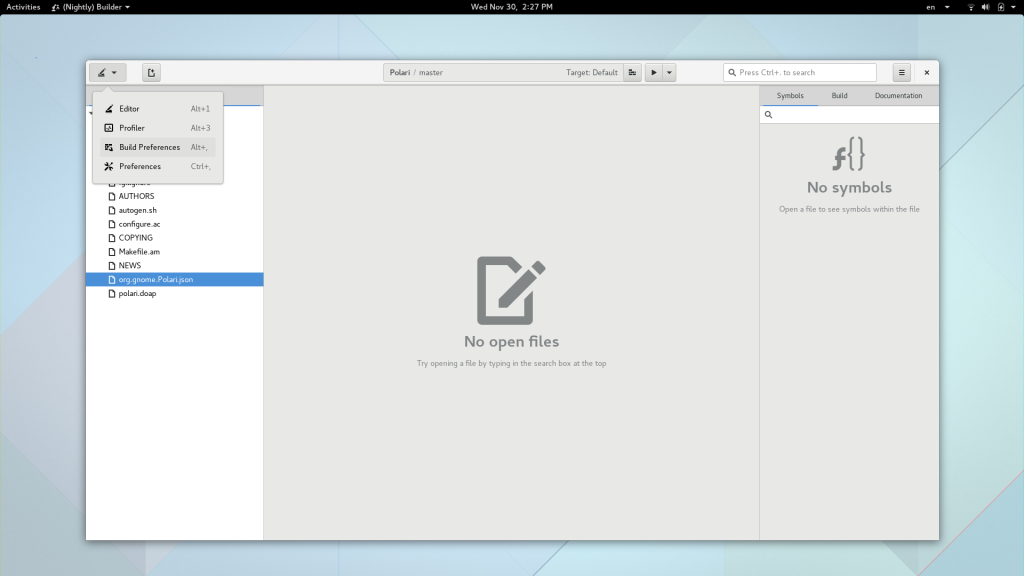
It’s no secret that I’m not happy with the current sidebar in Builder, but it’s the first step in the direction we want to go. Gotta start somewhere! But the piece that is very useful, is the concept of perspectives. Long term I expect perspectives to be how we avoid the the “jam everything into toolbars” IDE trap. Simply add the IdePerspective to the IdeWorkbench to add a new perspective. We current have 3, the editor, build configurations, and preferences. I expect a couple more by 3.22.

Workbench Addins

The IdeWorkbenchAddin allows you to tweak the UI of the workbench. Your addin is created once the workbench has loaded a project. You might add a GAction to be used in your UI, add a perspective, or surprise me.

Preferences

The IdePreferencesAddin is how you add new preferences to Builder. It has a declarative interface to add switches and knobs and be able to remove them when your plugin unloads. This feature is how we avoid the “Configure Plugin” trap I complain so much about in “plugin orientated architectures”.

Project Miners

Unfortunately, last I tried tracker to do project discovery I ended up with about 20 GB of resident memory and then my system crashed. So we currently do project mining manually from Builder. I really hope this isn’t always the case, but it’s where we are today.

Use IdeProjectMiner to implement a project miner and it will get shown when Builder shows the project greeter. We currently only discover autotools projects on your system.

System Runtimes

An IdeRuntime is how we manage executing processes within a context such as a jail, container, or host system. Think of it as a toolchain that can be separate from your host system and used for compilation and execution tasks.

The IdeRuntimeProvider interface is how you discover and create these runtimes.

Currently, we have two (well three) implementations. One for Xdg-App runtimes, and one for Jhbuild runtimes. The third is the host system, but that is more of a “no-op” implementation.

I can see more of these being added in the future. Python’s virtualenv, multiple ruby installations, Mono version runtimes, Docker, etc.

When integrating these with an IdeDevice, I hope that we can even get off-system building working inside of virtual-machines (Boxes for example). For me, that would simplify the “Build on Fedora”, “Deploy on RHEL” story.

Search Providers

The search box at the top of Builder is powered by IdeSearchProviders. I really hope to make this feature more powerful in upcoming releases.

Symbol Resolvers

The IdeSymbolResolver interface allows you to locate a symbol given a position in a text buffer. This is how we jump to source locations when you type <alt>. in a buffer (or gd in vim mode).

The symbol resolver also helps us create a hierarchy of symbols as found in the Symbol Tree panel.

See the clang and vala implementations.

Version Control

Version control in Builder is implemented using the IdeVcs interface. Currently, we only support git, thanks to the wonderful libgit2-glib library.

If the version control interface implements the IdeVcs::get_buffer_change_monitor() vfunc, then you will magically get those pretty change lines in the text editor gutter.

Editor Addins

If you want to add extensions to every editor created in Builder, use the IdeEditorViewAddin interface.

This interface is rather incomplete today, so I’m really interested in the things you’d like to do so we can make this as easy as possible.

Project Creation

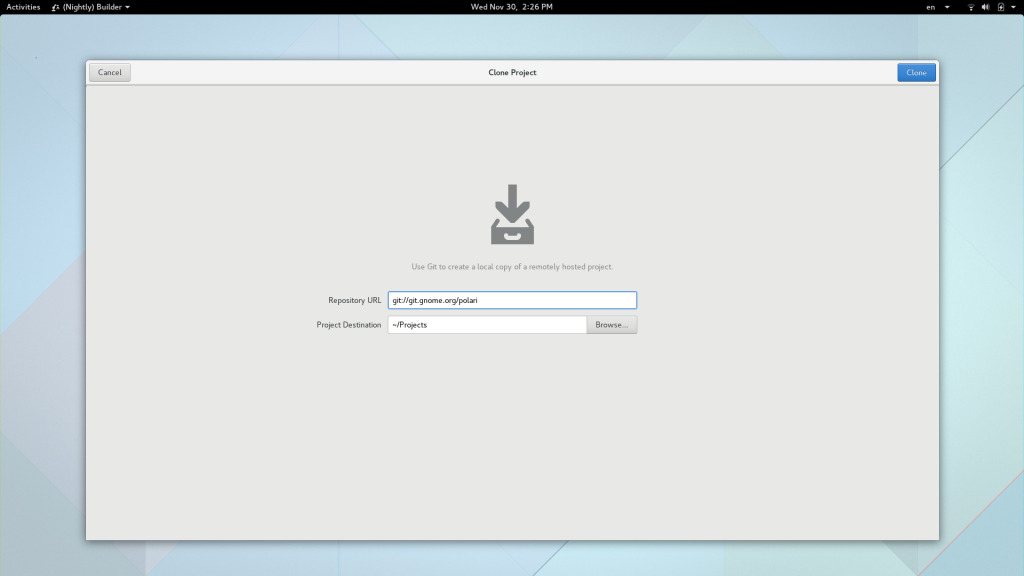
The project greeter, as seen when Builder launches, has support to create new projects. Although, today we only support cloning from Git or from a local directory. In 3.22 we need to extend this to support our new project template support.

To add a new project creation method, implement the IdeGenesisAddin. You can find the git and directory implementations for inspiration.

Project Templates

The basic plumbing for project templates has landed, but it is only exposed via the ide create-project command line program for 3.20. As I said above, I hope to complete this for 3.22 (or mentor someone to complete it for me, hint hint).

Implement the IdeTemplateProvider and IdeProjectTemplate interfaces for how to go about doing this.

The autotools+shared-library, which is written in Python, might serve as some inspiration.

Multi-process Coordination

To keep the Builder process lightweight, we advise doing memory and CPU intensive operations in sub-processes. The IdeWorker interface makes this easy. Builder will spawn a worker process for you, and setup a private D-Bus (no daemon required) to communicate to your sub-process.

Longer term, we hope to add more containment features, CPU and memory throttling (with cgroups), and process recycling when memory fragmentation gets absurd.

This would be a great GSoC project if any students are still reading this far down 😉

Conclusion

We have a lot more things to add in the near future. See my work-in-progress ideas for 3.22 features on our Roadmap.

Build Configurations and Xdg-App

It’s no secret that one of the main features I wanted to land this cycle was introductory support for Xdg-App. There really was quite a bit to do to make that happen, including all sorts of seemingly unrelated plumbing.

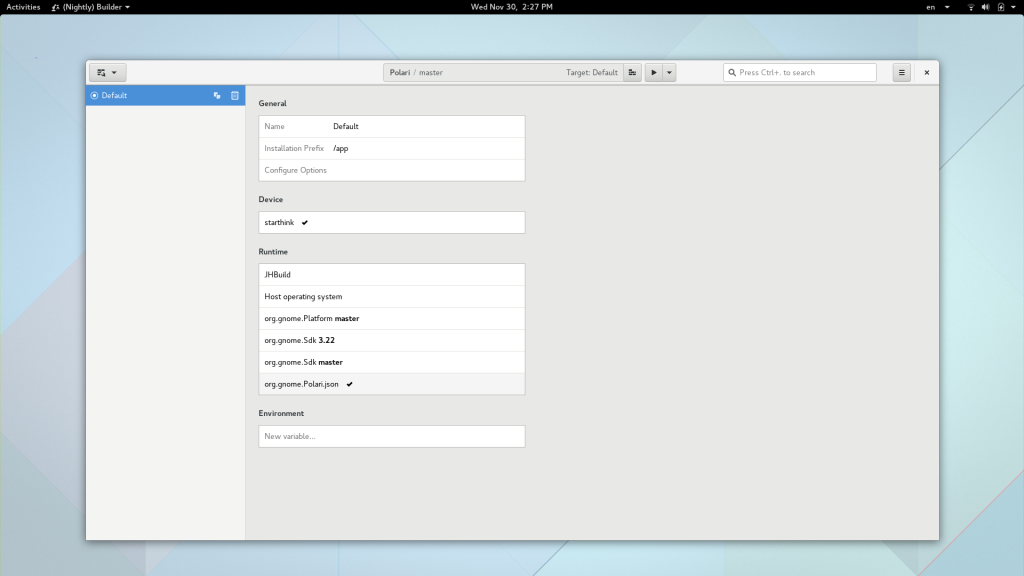
One seemingly unrelated piece is the long-anticipated support for “Build Configurations”. I deferred on this feature for as long as possible because it needs to support many movable parts, for which we didn’t have a clear vision of. But now that our applications vision is becoming less and less murky, it was time to attack it.

IdeContext now contains an IdeConfigurationManager. This object can be used to get access to available configurations (IdeConfiguration). A configuration currently contains a target device (IdeDevice), a target runtime (IdeRuntime), environment variables (IdeEnvironment), and various other common properties.

We’ve ambitiously tried to avoid writing random dot files to your project, but time has come to add one. If you create a build configuration, we’ll drop a small .buildconfig GKeyFile in the root of your project tree. It contains the necessary information to bootstrap your project or build it with a given Xdg-App runtime.

Currently, we only have two runtime implementations. The default, is simply the host system. Think of it as a pass-through runtime. The second, is an Xdg-App runtime. It uses the runtime SDK installed via the xdg-app command line tool. For 3.22, I expect to have UI to install runtime SDKs.

You might imagine additional runtimes that we could create. Jhbuild is an obvious one, although hopefully it is less and less necessary now that we have a nightly GNOME SDK.

Build Configuration

EggColumnLayout

The widget behind the new preferences implementation in Builder was pretty fun to write. Some of the details were tricky, so I thought I’d make the widget reusable in case others would like to use it. I’m sure you can find uses for something like this.

The widget allocates space for children based on their priority. However, instead of simply growing in one direction, we allocate vertically, but spill over into an adjacent column as necessary. This gives the feeling of something akin to GtkFloxBox, but without the rigidity of aligned rows and columns.

This widget is meant to be used within a GtkScrolledWindow (well GtkViewport really) where the GtkScrolledWindow:hscrollbar-policy is set to GTK_POLICY_NEVER.

The resulting work is called EggColumnLayout and you can find it with all the other Egg hacks.

EggColumnLayout in Builder preferences

A short description of the tune-ables are:

EggColumnLayout:column-width tunes the width of the columns. These are uniform among all columns so you should set it to something reasonable. The default is 500px. As an aside, dynamically descovering the column width uniform to all children would probably not look great, nor be straight-forward.

EggColumnLayout:column-spacing is the spacing between columns. Had we used children containers, we could have probably done this in CSS, but the property is “good enough” in my opinion.

EggColumnLayout:row-spacing is the analog to :column-spacing but for the space between the bottom of one child and the top of a subsequent child.

That is pretty much it. Just add your children to this and put the whole thing in a GtkScrolledWindow.

Happy Hacking.

Project Templates

Now that Builder has integrated Template-GLib, I started working on creating projects from templates. Today, this is only supported from the command line. Obviously the goal is to have it in the UI side-by-side with other project creation methods.

I’ve put together a demo for creating a new shared-library project with autotools. Once I’m happy with the design, I’ll document project templates so others can easily contribute new templates.

Anyway, you can give it a go as follows.

ide create-project my-project -t shared-library
cd my-project
ide build

Hiding, Dock-able, and Floating Panels

I’m doing some research on panel systems that people love, hate, and love to hate. Send me a short email with the following to get your voice heard. No promises of implementation, but I’d like to inform myself nonetheless.

Name: Application or Library Name
Screenshots: 1-2 screenshot links
Likes: 1-2 Sentence max of likes
Dislikes: 1-2 Sentence max of dislikes