Sysprof + Builder

After the GNOME 3.20 cycle completed I started revamping Sysprof. More here, here, and here. The development went so smoothly that I did a 3.20 release a couple of weeks later.

A primary motivation of that work was rebuilding Sysprof into a set of libraries for building new tools. In particular, I wanted to integrate Sysprof with Builder as our profiler of choice.

On my flight back from GUADEC I laid the groundwork to integrate these two projects. As of Builder 3.21.90 (released yesterday) you can now profile your project quite easily. There are  more corner cases we need to handle but I consider those incremental bugs now.

Some of our upcoming work will be to integrate the Sysprof data collectors with Python and Gjs. The Gjs implementation is written, it just needs polish and integration with upstream. I think it will be fantastic once we have a compelling profiling story weather you are writing C, C++, Vala, Python, or Gjs.

We’ve also expanded the architectures supported by Sysprof. So I expect by time 3.22 is released, Sysprof will support POWER8, ARM, ARM64, mips, and various others as long as you have an up to date Linux kernel. That is an important part of our future plans to support remote profiling (possibly over USB or TCP). If you’re interested in working on this, contact me! The plumbing is there, we just need someone with time and ambition to lead the charge.

Selecting the Profiler

Builder's Callgraph View

Builder Happenings

Over the last couple of weeks I’ve started implementing Run support for Builder. This is somewhat tricky business since we care about complicated manners. Everything from autotools support to profiler/debugger integration to flatpak and jhbuild runtime support. Each of these complicates and contorts the problem in various directions.

Discovering the “target binary” in your project via autotools is no easy task. We have a few clever tricks but more are needed. One thing we don’t support yet is discovering bin_SCRIPTS. So launching targets like python or gjs applications is not ready yet. Once we discover .desktop files that should start working. Pretty much any other build system would be easier to implement this.

So much work behind the scenes for a cute little button.

Screenshot from 2016-07-17 22-09-21

While running, you can click stop to kill the spawned application’s process group.

Screenshot from 2016-07-17 22-10-38

But that is not all that is going on. Matthew Leeds has been working on search and replace recently (as well as a whole bunch of paper cuts). That work has landed and it is looking really good!

Screenshot from 2016-07-17 22-12-45

Also exciting is that thanks to Sebastien Lafargue we have a fancy new color picker that integrated with Builder’s source editor. You can visualize colors in your source files and change them using the dropper or numerous sliders based on how you’d like to tweak the color.

Screenshot from 2016-07-17 22-11-38

I still have a bunch of things I want to land before GUADEC, so back to the hacker den for me.

Builder Designs

Thanks to the wonderful design skill of Allan, Builder got a bunch of new designs this last month. Last week, after arriving home from the Toronto hackfest, I started reshaping Builder to match.

We’ve simplified the greeter to remove an interstitial page and raise the discoverability of some of Builder’s features.

greeter

Creating a project has been simplified and we made some features more discoverable by removing the need to dive into a GtkComboBox. Clearly, we still have a bunch of templates to land for 3.22.

new-project

Cloning a project from git is functionally the same, but we give a bit more context to what is going on.

clone-project

Those that came to my talk at FOSDEM got to hear me complain about how we have a sidebar in Builder, but I didn’t like it and wanted something different going forward. Well, we finally have landed that.

The perspective selector is in the top left corner, and clicking on it will also show you some shortcuts to help you move through Builder faster. As we grow the application, we hope to provide a bunch more useful keybindings for folks. Some of this is going to require rethinking how keybindings work in modern gtk+.

perspective-selector

One thing that was relatively buried in Builder that we wanted to improve was the Build support. We want to make it easy to build your project without getting overwhelmed by panels. So we’ve introduced a new center widget in the header called the OmniBar. It provides a high-level overview of the project and information on the current build progress, if any.

omnibar

I hope to see some more iteration on this before 3.22, and possibly API to allow plugins to supplement information for the OmniBar.

Allan is still working on even more designs this cycle, so I have no doubt that 3.22 will be our best release yet.

Matthew Leeds has been working diligently on our new search and replace engine (in addition to many Vim compatibility improvements). I’m looking forward to having that land soon (and some screenshots to go with it)!

Builder 3.20.4

Those of us happy hackers in #gnome-builder have been diligently preparing 3.20.4 for you. I expect that most people will end up using this version during the 3.20 life-cycle as the big distros are starting to ship 3.20. We might do another 3.20 release, but I haven’t decided. There are lots of stability and performance improvements, and I’m pretty happy with where things are going.

Now that this release is out, it is probably time to start pushing hard on our 3.22 features. I’m happy to have Fangwen Yu working on Builder this summer on our search and replace engine. We have some great mockups in the works and I have no doubt Fangwen is going to do a great things with the code-base.

A few screenshots, because that’s what I’m known for.

Screenshot from 2016-05-06 18-17-10

Screenshot from 2016-05-06 18-20-29

Screenshot from 2016-05-06 18-22-38

Tarballs can be found on downloads.gnome.org.

Build System Fallbacks

It’s no secret that I focus my build system efforts in Builder around Autotools. I’m happy to include support for other build systems, so long as I’m not the person writing it.

Sometimes the right piece of code falls together so easily you wonder how the hell you didn’t think of it before. Today was such a day.

If you are using Builder from git (such as via jhbuild) or from the gnome-builder-3-20 branch (what will become 3.20.4) you can use Builder with the fallback build system. This is essentially our “NULL” build system and has been around forever. But today, these branches learned something so stupidly obvious I’m ashamed I didn’t do it 6 months ago when implementing Build Configurations.

If you go into the Build Configuration panel (the middle button in the sidebar) you can specify environment flags. Builder will use CFLAGS, CXXFLAGS, and VALAFLAGS now to prime those compilers in the absence of Autotools (where we have discovered these dynamically).

build-flags

And now semantic language features should work.

examples

How to Sysprof

So now that a new Sysprof release is shipped, lets pick on an unsuspecting library to see what it is like to improve performance in a real-world scenario. Today we’ll pick on GtkSourceView. They shouldn’t feel bad though, GtkSourceView is an absolutely wonderful library and like any piece of software, it can be improved.

GtkSourceView has a lovely helper program to test things out in the tests/ directory. If you are an app or library developer, please do this! It makes things much easier.

So lets run ./test-widget in our jhbuild environment, and start-up Sysprof. Often times, you’ll want to see how your program affects the whole system. But for this test, I want to focus on test-widget, so we will limit our capture to samples in that process. Do this by turning off the Profile my entire system switch and then selecting your target process from the list.

1-setup-profiler

Next, click record. You might be prompted to authorize your user to access performance counters based on your system configuration and user permissions.

2-click-record

After your profiling session has started, switch back to the test application and exercise the crap out of it. In this case, I turned on some features in the test widget like line numbers (something I always have enabled in Gedit and Builder) and started scrolling like crazy. I did this until I had about 30,000 samples recorded. Sysprof will tell you how many callchains have been recorded in the upper right corner of the window.

Then press the Stop button. Depending on the size of your capture, it might take a couple seconds, but the callgraph will then be generated. It has to crack open all of the linked libraries and extract symbol information from them, so it can take a second or two.

3-view-callgraph

Now the mysterious part. Start diving into the descendants tree following the most expensive cumulative times. We want to find something that looks “out of place”. Getting good at that takes practice. If your callchain gets too deep, just hit enter on the row and it will focus in on that item.

In the image below, you’ll see I jumped past main, various main loop junk until i got to gtk_main_do_event(). This is the crux of event dispatch in GTK+. If we keep diving down by the most expensive callchain, we get to a peculiar function, center_on(). It seems to be calling into gtk_text_view_get_iter_location() a bunch, I wonder why.

4-center_on

So lets go find the code. It is clearly called by GtkSourceGutterRendererText, so that is where we will start.

In the code below, it looks like the text gutter renderer (what draws line numbers next to your code) needs to either place the text in the middle of the row, the top of the row (in the case of line wrapping), or the bottom of the row (also in case of line wrapping).

5-find-relevant-code

In Builder, shamefully, we don’t even allow line wrapping today. So clearly a shortcut can be taken. If wrapping is disabled, we know that we will always be centering our text to the entire height of the cell. So lets cook up a quick patch to avoid the center_on() calls altogether.

5.5-patch-the-code

Now we build, and repeat our profiling session to compare the results. Originally the gutter_renderer_text_draw() was in about 33% of our collected callchains. Now, if you look below we are down to less than 20% of our collected callchains, and center_on() is nowhere to be seen!

6-compare-results

So the moral of the story is that in about half an hour, you can profile, learn something about a code-base, and make measurable improvements. So go ye forth and make the F in Free Software stand for Fast.

Sysprof 3.20.0

Previously, previously, previously, and previously.

The past couple of weeks went by so fast working on Sysprof that I think we can actually release it as a (late) 3.20 application. We don’t have many translations, but on the other hand, we didn’t have any before.

There is so much we could do with Sysprof going forward, but I’ve got an IDE to write. If some of you are interested in working on the application, I can push you in the right direction. I have some visualization prototypes and ideas for more data collectors. I’d love to hand that off to newcomer(s) who are proficient in C and as nuts as I am about performance.

TarballsNEWS

A profiler of our own

So now that you are all aware that I’ve been working to modernize Sysprof, you might not be surprised to read that I decided to push things in a bit more interesting of a direction.

I have a very opinionated stance on languages. Which is, in general, they’re all terrible. Only to be made more terrible by their implementations. Which is to say, we’re all screwed and how do these computers work anyway?

But alas, succumbing to the numbness of existence is not how I want to spend my life, so time to pull up my figurative bootstraps and improve what we’ve got.

So what’s in my cross-hairs this week? Well, quite frankly, those JavaScripts. I’ve worked on a handful of language runtimes, but modern JavaScript engines really take the cake for turning a Von Neumann machine into something completely foreign and utterly non-debuggable, non-profile-able, generally unpleasant for anyone to come in and improve things other than the original author. (Same could be said about C. But wait, I said I *wasn’t* succumbing to the numbness).

Well, that isn’t completely true, given that you only write JavaScript within the context of a browser. The tooling in browsers these days is rapidly approaching something useful. Which is saying a lot when you have a language that is almost exclusively using nameless functions attached to prototype fields.

So here we go, off into the land of mystery. libmozjs24 is our path, with only headers and a few sources to guide us.

So how do profilers work anyway?

Lets simplify this to a static C-like language for the moment.

Say your program is happily running along, maybe processing things from a main loop. Along comes a signal from the kernel. The kernel decides it will deliver the signal to your main thread (see man pthread_sigmask for information on how signals are delivered and how to block them). What happens next is that on top of your current executing stack, your registered signal handler (see man sigaction) is executed.

At this point, you can do a couple of things. Generally, you might use something like libunwind to unwind the stack (past your signal handler) and record each of the instruction pointers for each frame. Using that, you can later look at what library was mapped into the region containing the instruction pointer, and resolve the function name by reading the library ELF (and possibly demangling if it is a C++ function).

If you remember your UNIX handbook, the way to spawn a process (simplified) is to fork(), followed by an exec() of the new process. So how do we get our signal handler into that process?

POSIX timers

In the 2008 version of POSIX, timers were introduced (See man timer_create for more information). They allow you to deliver a signal on an registered interval. Even better, POSIX timers follow through exec but not fork. Exactly what we want. We can fork(), setup the timer, and then exec() our target.

It looks something like this:

struct sigevent sev = { 0 };
sev.sigev_signo = SIGPROF;                   /* Send us SIGPROF */
sev.sigev_notify = SIGEV_THREAD_ID;          /* Linux extension! */
sev._sigev_un._tid = syscall (__NR_gettid);  /* See man gettid */
timer_create (CLOCK_MONOTONIC, &sev, &timer);

The above code creates a timer that we can enable/disable to deliver SIGPROF on a given interval. Note that the above code uses a Linux extension that allows you to specify the thread to receive the signal. Without something like that, you would need to either create a thread to use pthread_kill() to send SIGPROF, or mask SIGPROF from all other threads, lest they receive the signal handler instead of your target thread.

So why is the thread that the profiler runs on important? We’ll get to that later when we start looking at JITd languages.

To activate the timer, we setup our interval (frequency) to sample.

struct itimerspec its = { 0 };
its.it_interval.tv_sec = 0;
its.it_interval.tv_nsec = NSEC_PER_SEC / SAMPLES_PER_SEC;
its.it_value.tv_sec = 0;
its.it_value.tv_nsec = NSEC_PER_SEC / SAMPLES_PER_SEC;
timer_settime (self->timer, 0, &its, &old_its);

Extracting Samples

Now say we used sigaction(2) to setup a signal handler for SIGPROF. And now it is being called via signal delivery of SIGPROF. Our stack might look something like:

our_sigprof_handler()
< signal handler invoked >
some_worker()
main_loop_dispatch()
main_loop_iterate()
main()

We can unwind to get to the root of the stack, stash each of those addresses somewhere, and then return from our signal handler (allowing the program to continue executing).

However, the devils in the details there. We are in a signal handler, which basically means, you can’t do much, safely. Why? Well avoiding deadlocks mostly.

Say that SIGPROF got delivered while you were in malloc()? It might look something like:

our_sigprof_handler()
< signal handler invoked >
do_alloc()
_int_lock()
malloc()
some_worker()
main_loop_dispatch()
main_loop_iterate()
main()

Now, if you try to call malloc(), you’ll deadlock on _int_lock(). Basically, the only thing you can do is write to some memory you have pre-allocated. Buffer space, if you will.

Thankfully, you can do one more thing, which is write() to a file-descriptor. That is handy in case our buffer gets too full.

But you need to be very careful here. Even things like g_assert() could potentially cause a printf() or similar which might internally malloc. So you might need to -DG_DISABLE_ASSERT for production (which you should be doing anyway).

The complexities of a JIT

JITs truly are the magic of our times. They are the meta of the computer to improve itself faster than we can. That said, like your smart friends, they can be super annoying.

Discussing what a JIT is, the added complexity of tracing JITs, and their almost always pairing with garbage collection is out of scope for this. However, there are some excellent implementations you can go read (See mono as one such example of quality engineering).

In this case, the meaning of an address (the function in question, to say) could be the same between two samples, but be part of two completely different functions. Suppose that the JIT regenerated and reused the existing memory.

If you simply went by the address and did not account for the change, then you’d get wildly inaccurate results.

How SPSProfiler comes to the rescue

Thankfully, this work was building on top of SPSProfiler from libmozjs. While we have to provide our own sampler (which we’ve described the basics of above), it provides the necessary JIT integration in a moderately fast manner.

js::ProfileEntry

What mozjs gives us is a way to ask the runtime to deliver the current JS stack into a static buffer that we can read from. Each time JS dives into or out of a function, that “shadow stack” is updated.

However, since libmozjs has a garbage collector, if we were to access this stack information from any other thread, we’d be racing the GCing of strings pointed to by that shadow stack. So we need to ensure we interrupt the executing stack (hence SIGPROF, timers, etc).

Racing with a GC doesn’t matter in a C like language because, well there is no GC, and we can resolve symbol names after the fact because of ELF and DWARF debug information.

volatile uint32_t stack_depth = 0;
js::ProfileEntry stack[1024];
js::SetRuntimeProfilingStack (js_runtime,
                              stack,
                              &stack_depth,
                              G_N_ELEMENTS (stack));
js::EnableRuntimeProfilingStack (self->runtime, true);

Deduplicating Functions

To get the function name for JavaScript functions, we can simply read the string pointed to by the js::ProfileEntry. Something like:

if (entry->js()) {
  const gchar *name = entry->label() ?: "-- javascript --"
}

Now, if we had to copy that string for every instruction pointer in the stack, on every sample, we’d have pretty significant overhead in our profiler. So we do a bit of a deduplication hack. We have something that looks like a chunked allocator (GStringChunk) except it can’t be an allocator, because oh wait, in a signal handler.

So instead, we just have a fixed buffer size to store a single instance of the string, and a closed hashtable (no allocations required) to help with our deduplication.

While we fill the deduplicated function buffer, we hand out monotonic address identifiers for each new string. We steal some high bits in the address to indicate that this is a JITd function. (0xE << __wordsize-8). Normally this would colide with kernel addresses, but not in practice.

So now we can just replace our JITd addresses with these and store them like we would normally for C-like stacks.

What’s missing?

While SPSProfiler will put JS information (including native code) for functions before the current JavaScript frame, it doesn’t seem to give info after the current JS frame. So if your JS code calls into C code, which doesn’t result in a callback back into JavaScript code, getting reliable stack addresses is non-trivial. Maybe I’m missing something here though.

I need to go read some more code, because I’m likely to believe there is a way to deal with this, but might require newer libmozjs. Anyway, future blog post and all.

Capture formats

My new sysprof implementation uses a new binary capture format I’ve put together. Basically something really simple that lets me get data into the buffer quickly without too much fuss, alignment safe (allowing dereference of integers from the buffer with out use of memcpy()) and without the super annoying reality of Linux’s perf event stream which has dynamic trailing data based on what options were enabled when sampling. Seriously, don’t do that.

I still have some things to add, but this is the first step towards making more interesting captures (like in-app performance counters, VBlank information, compositor FPS, GTK+ frame timings, etc).

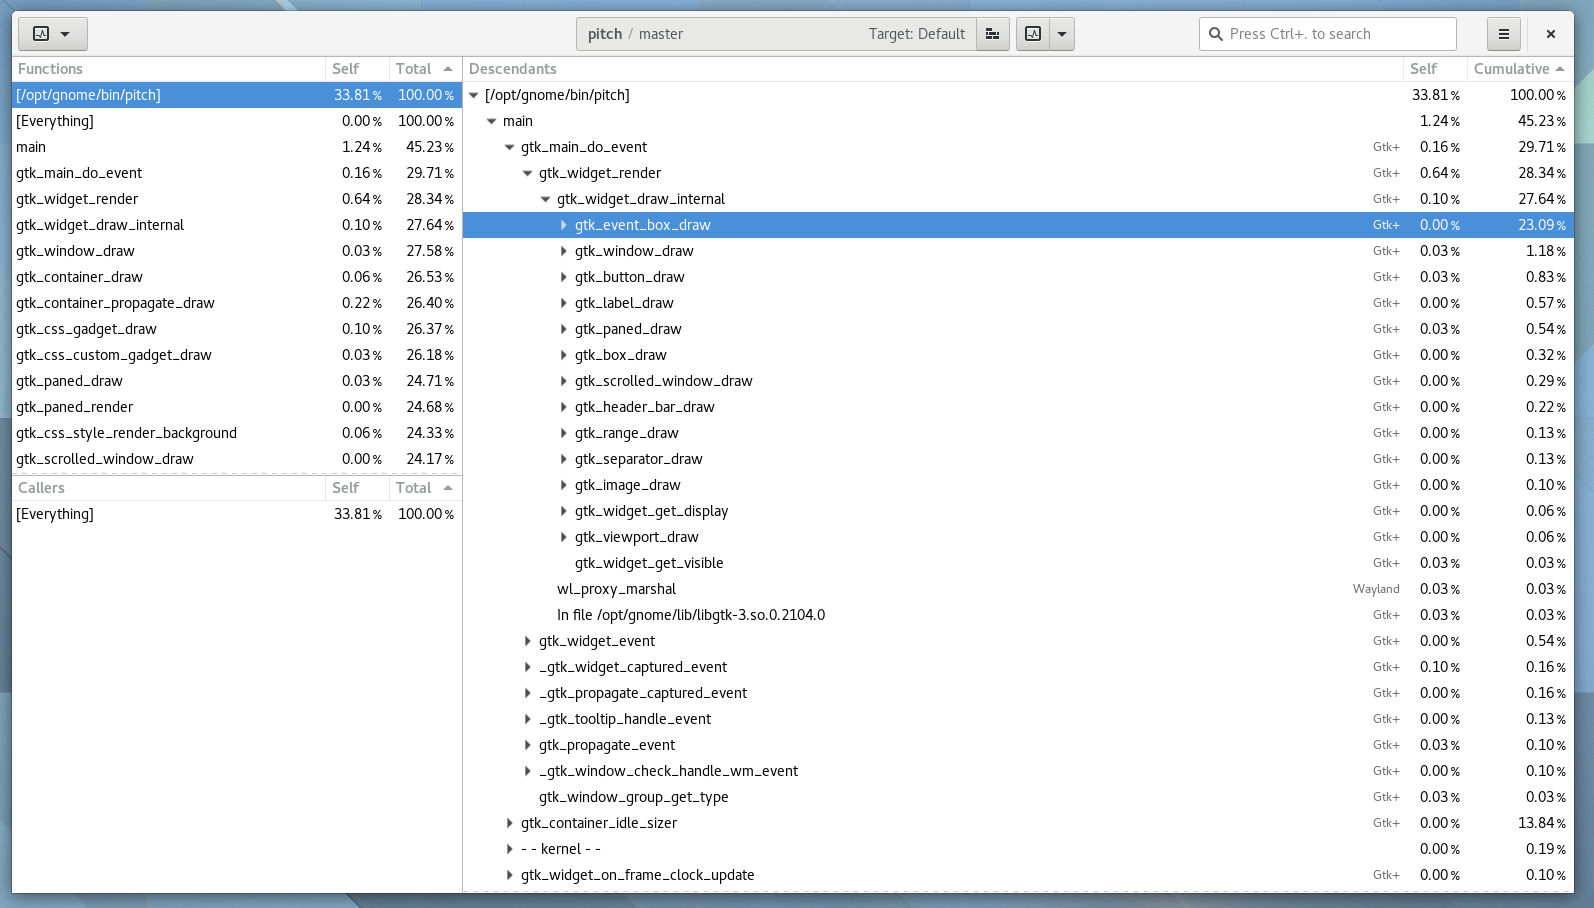
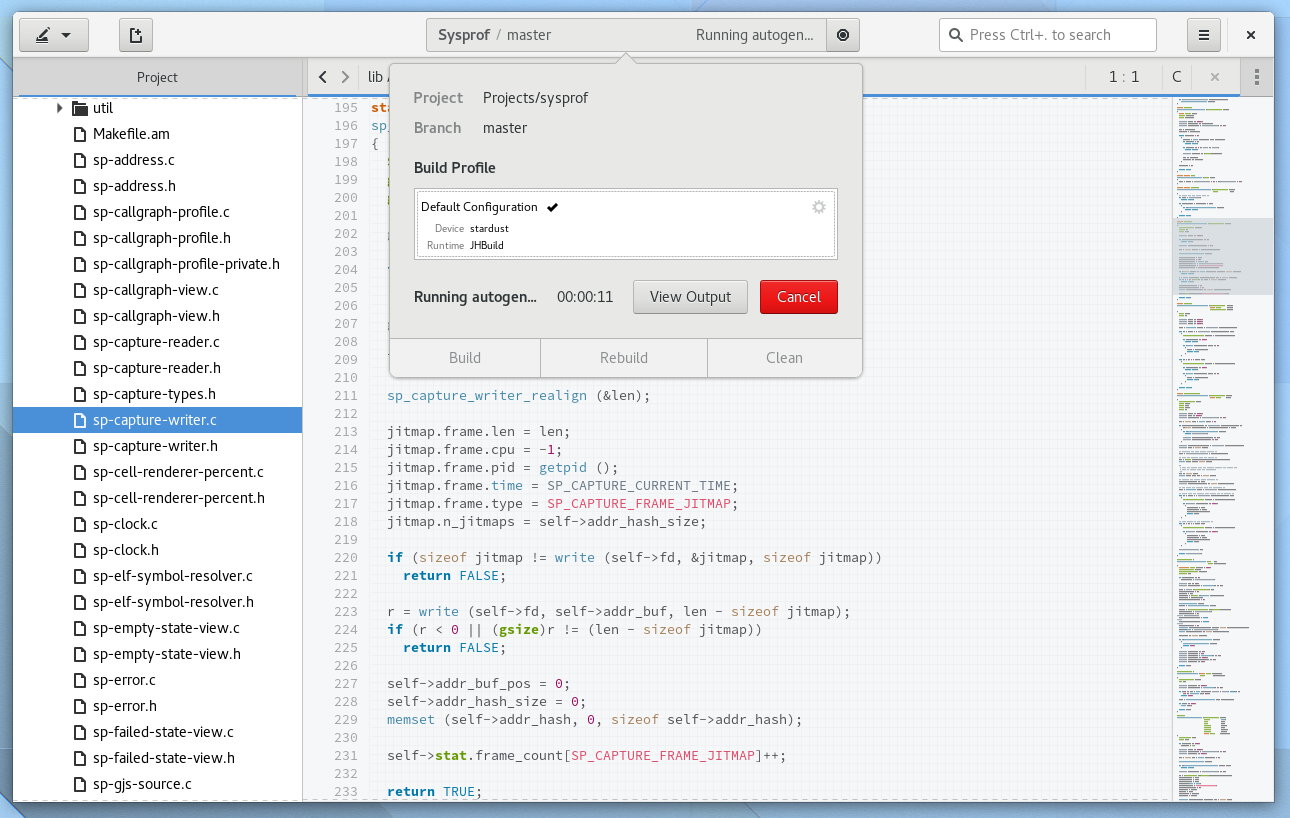
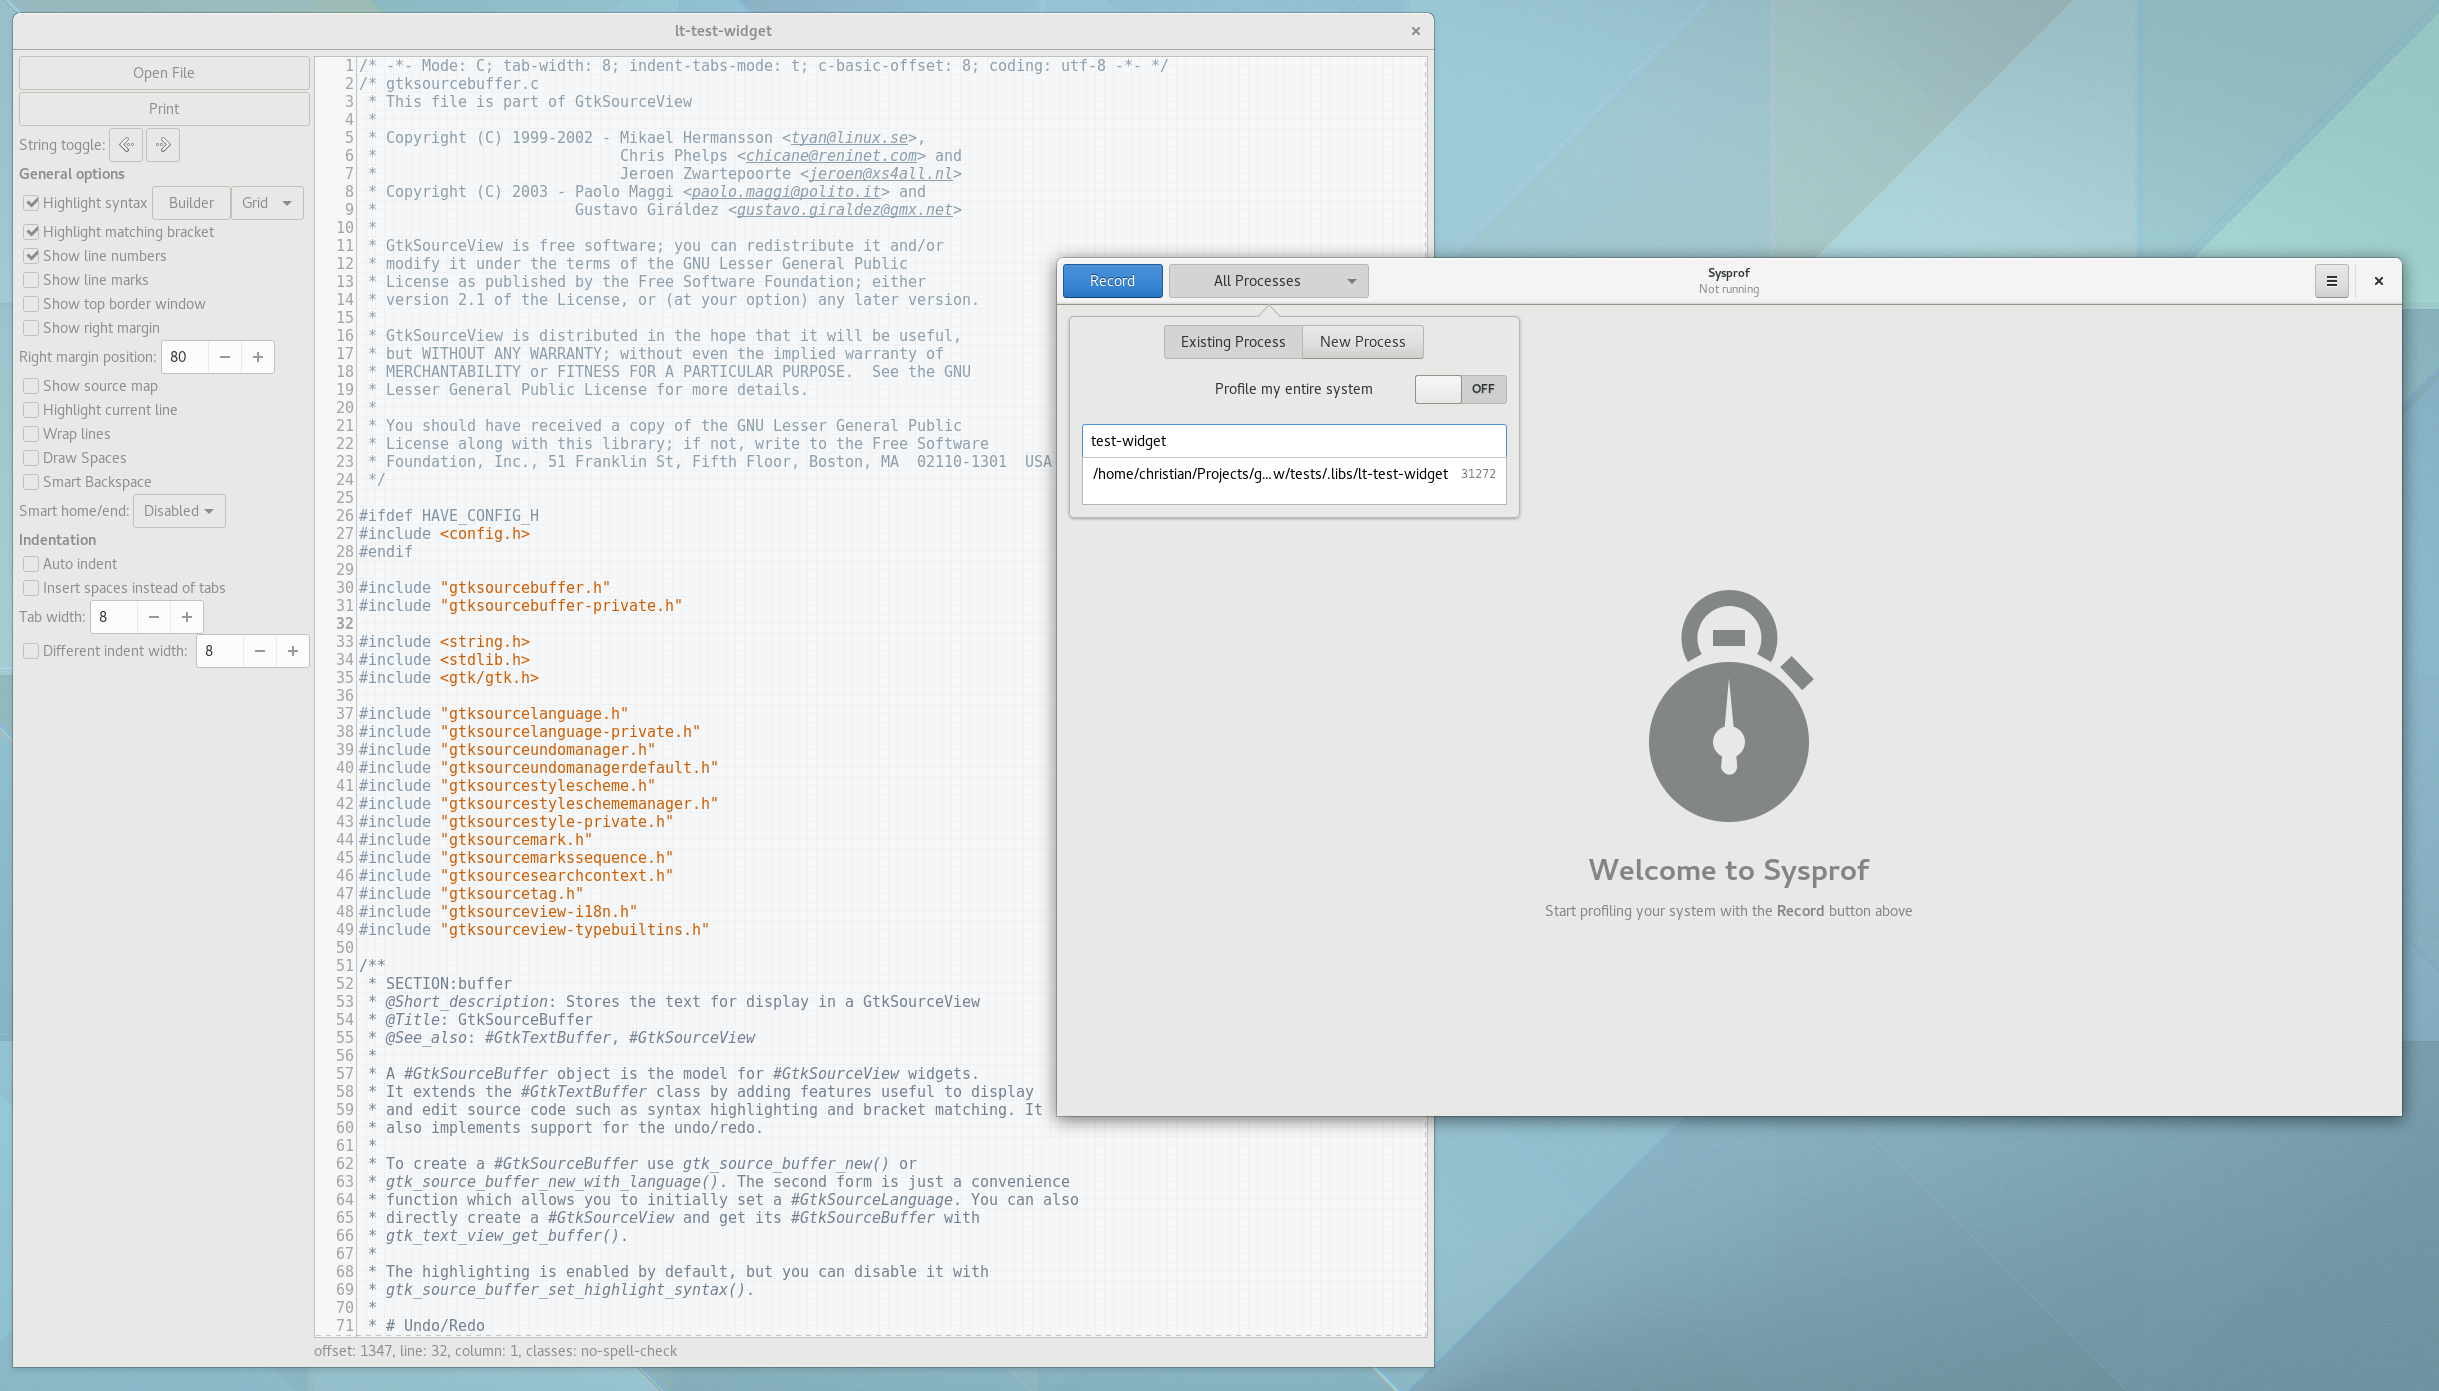
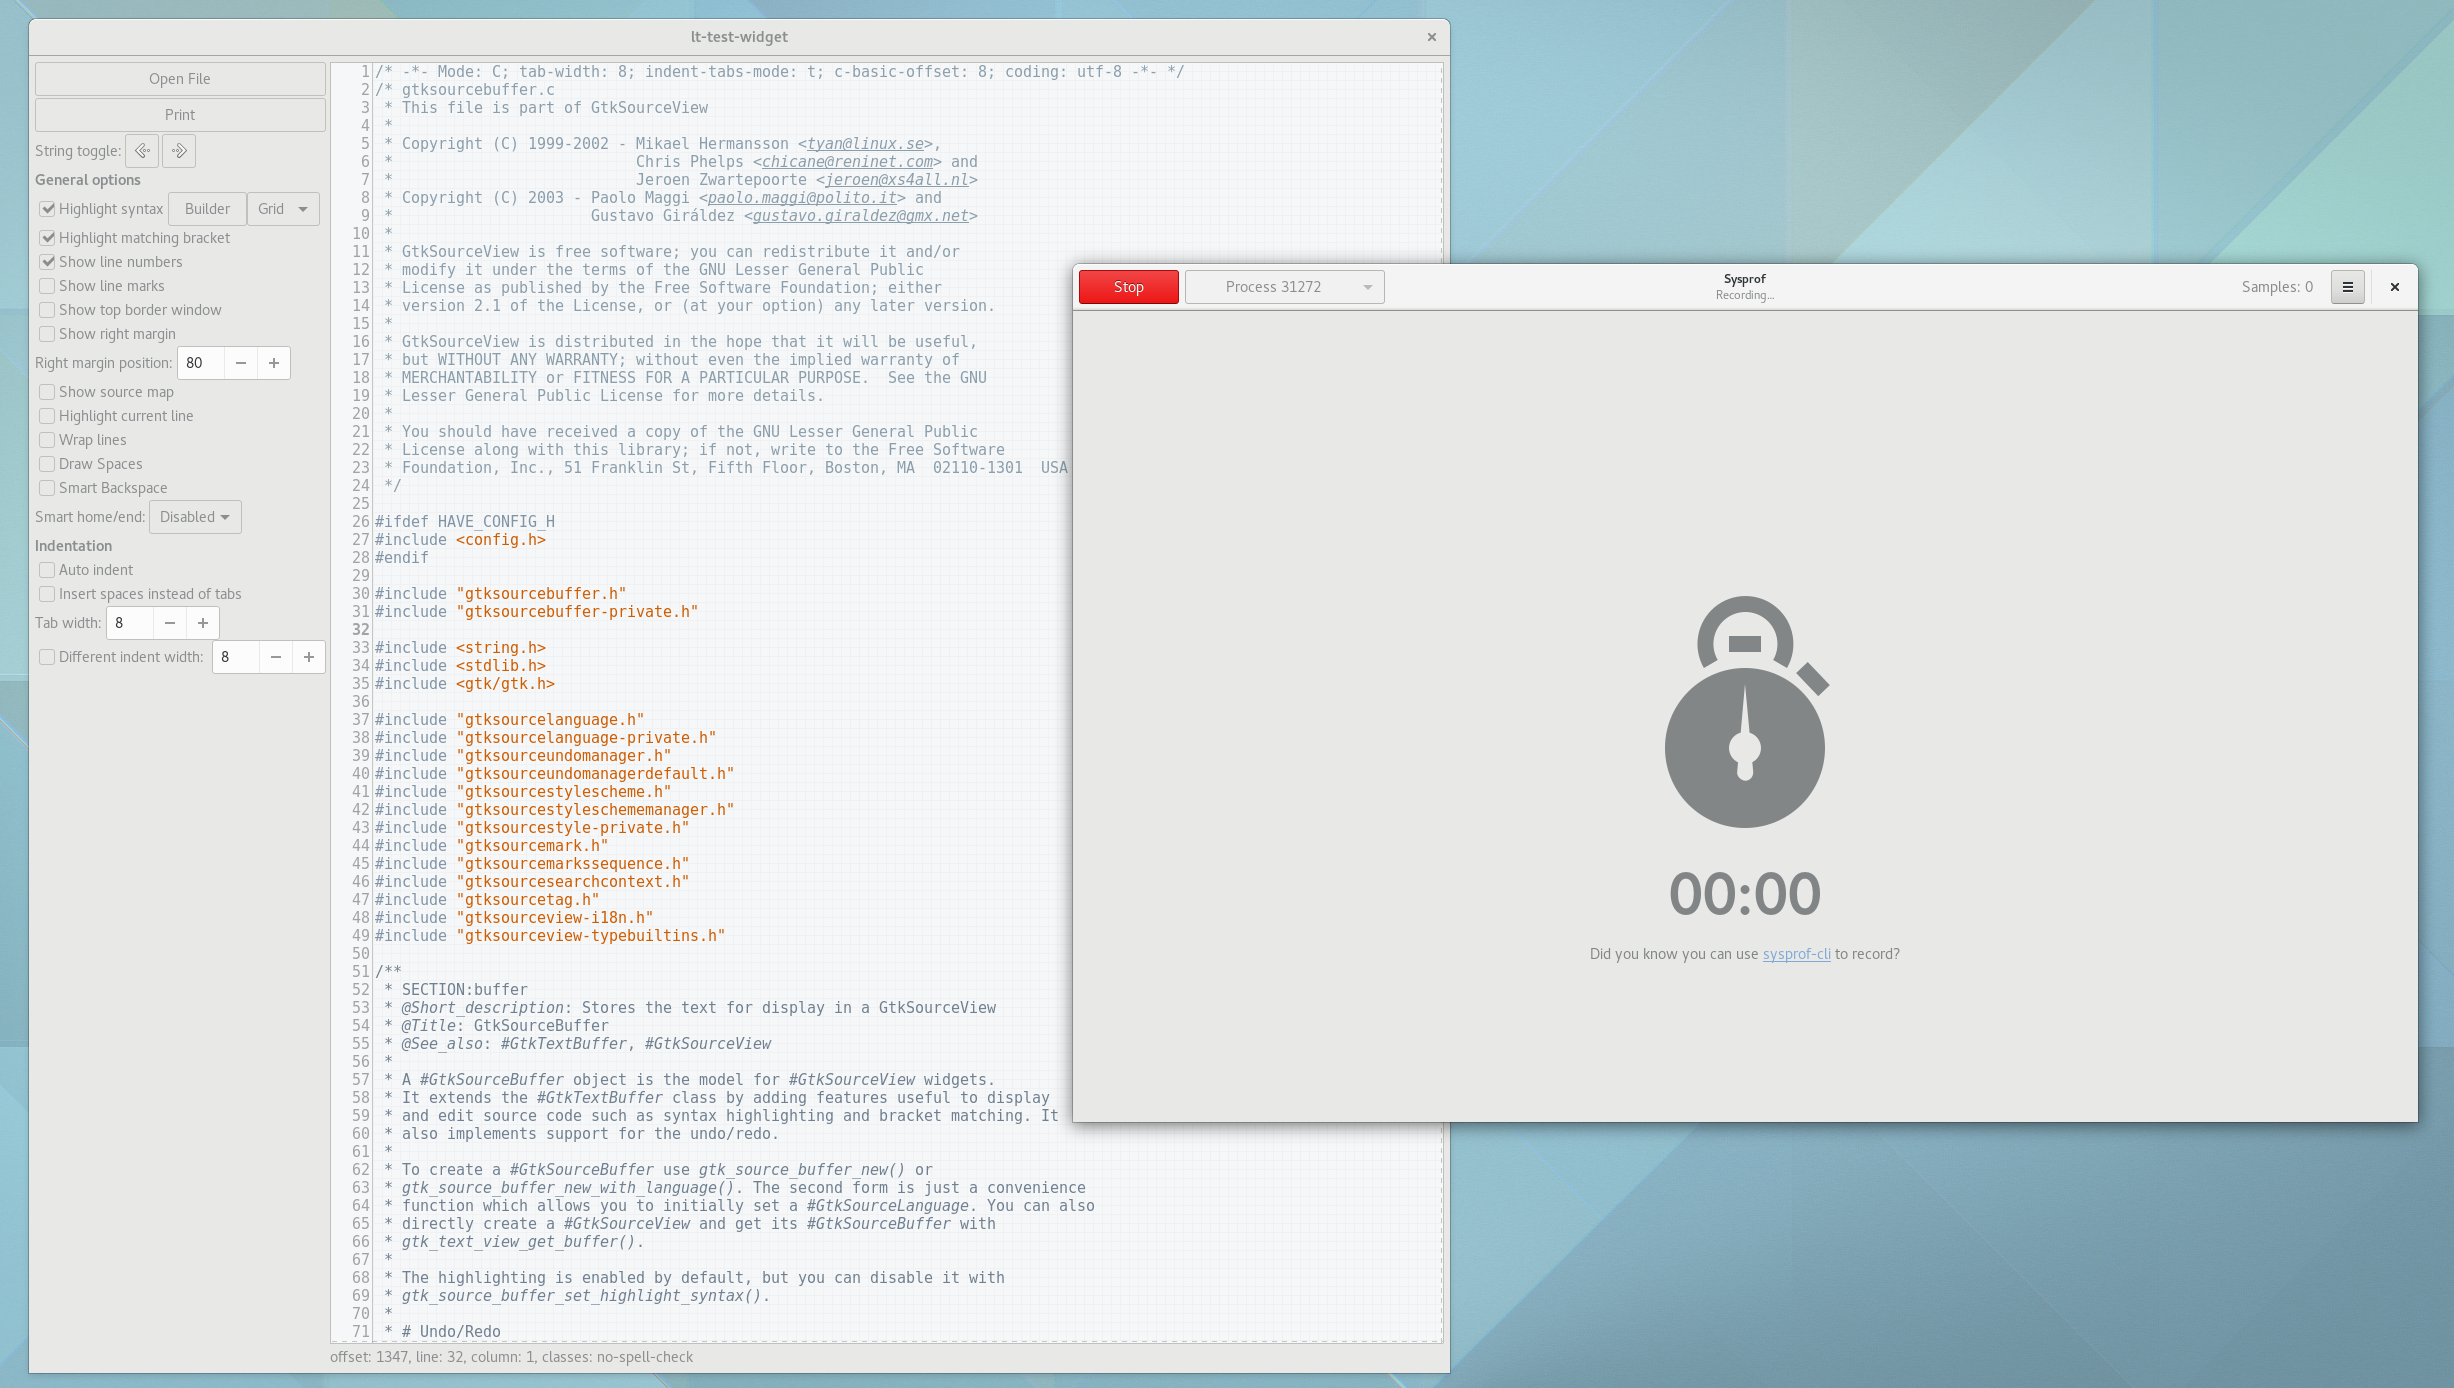
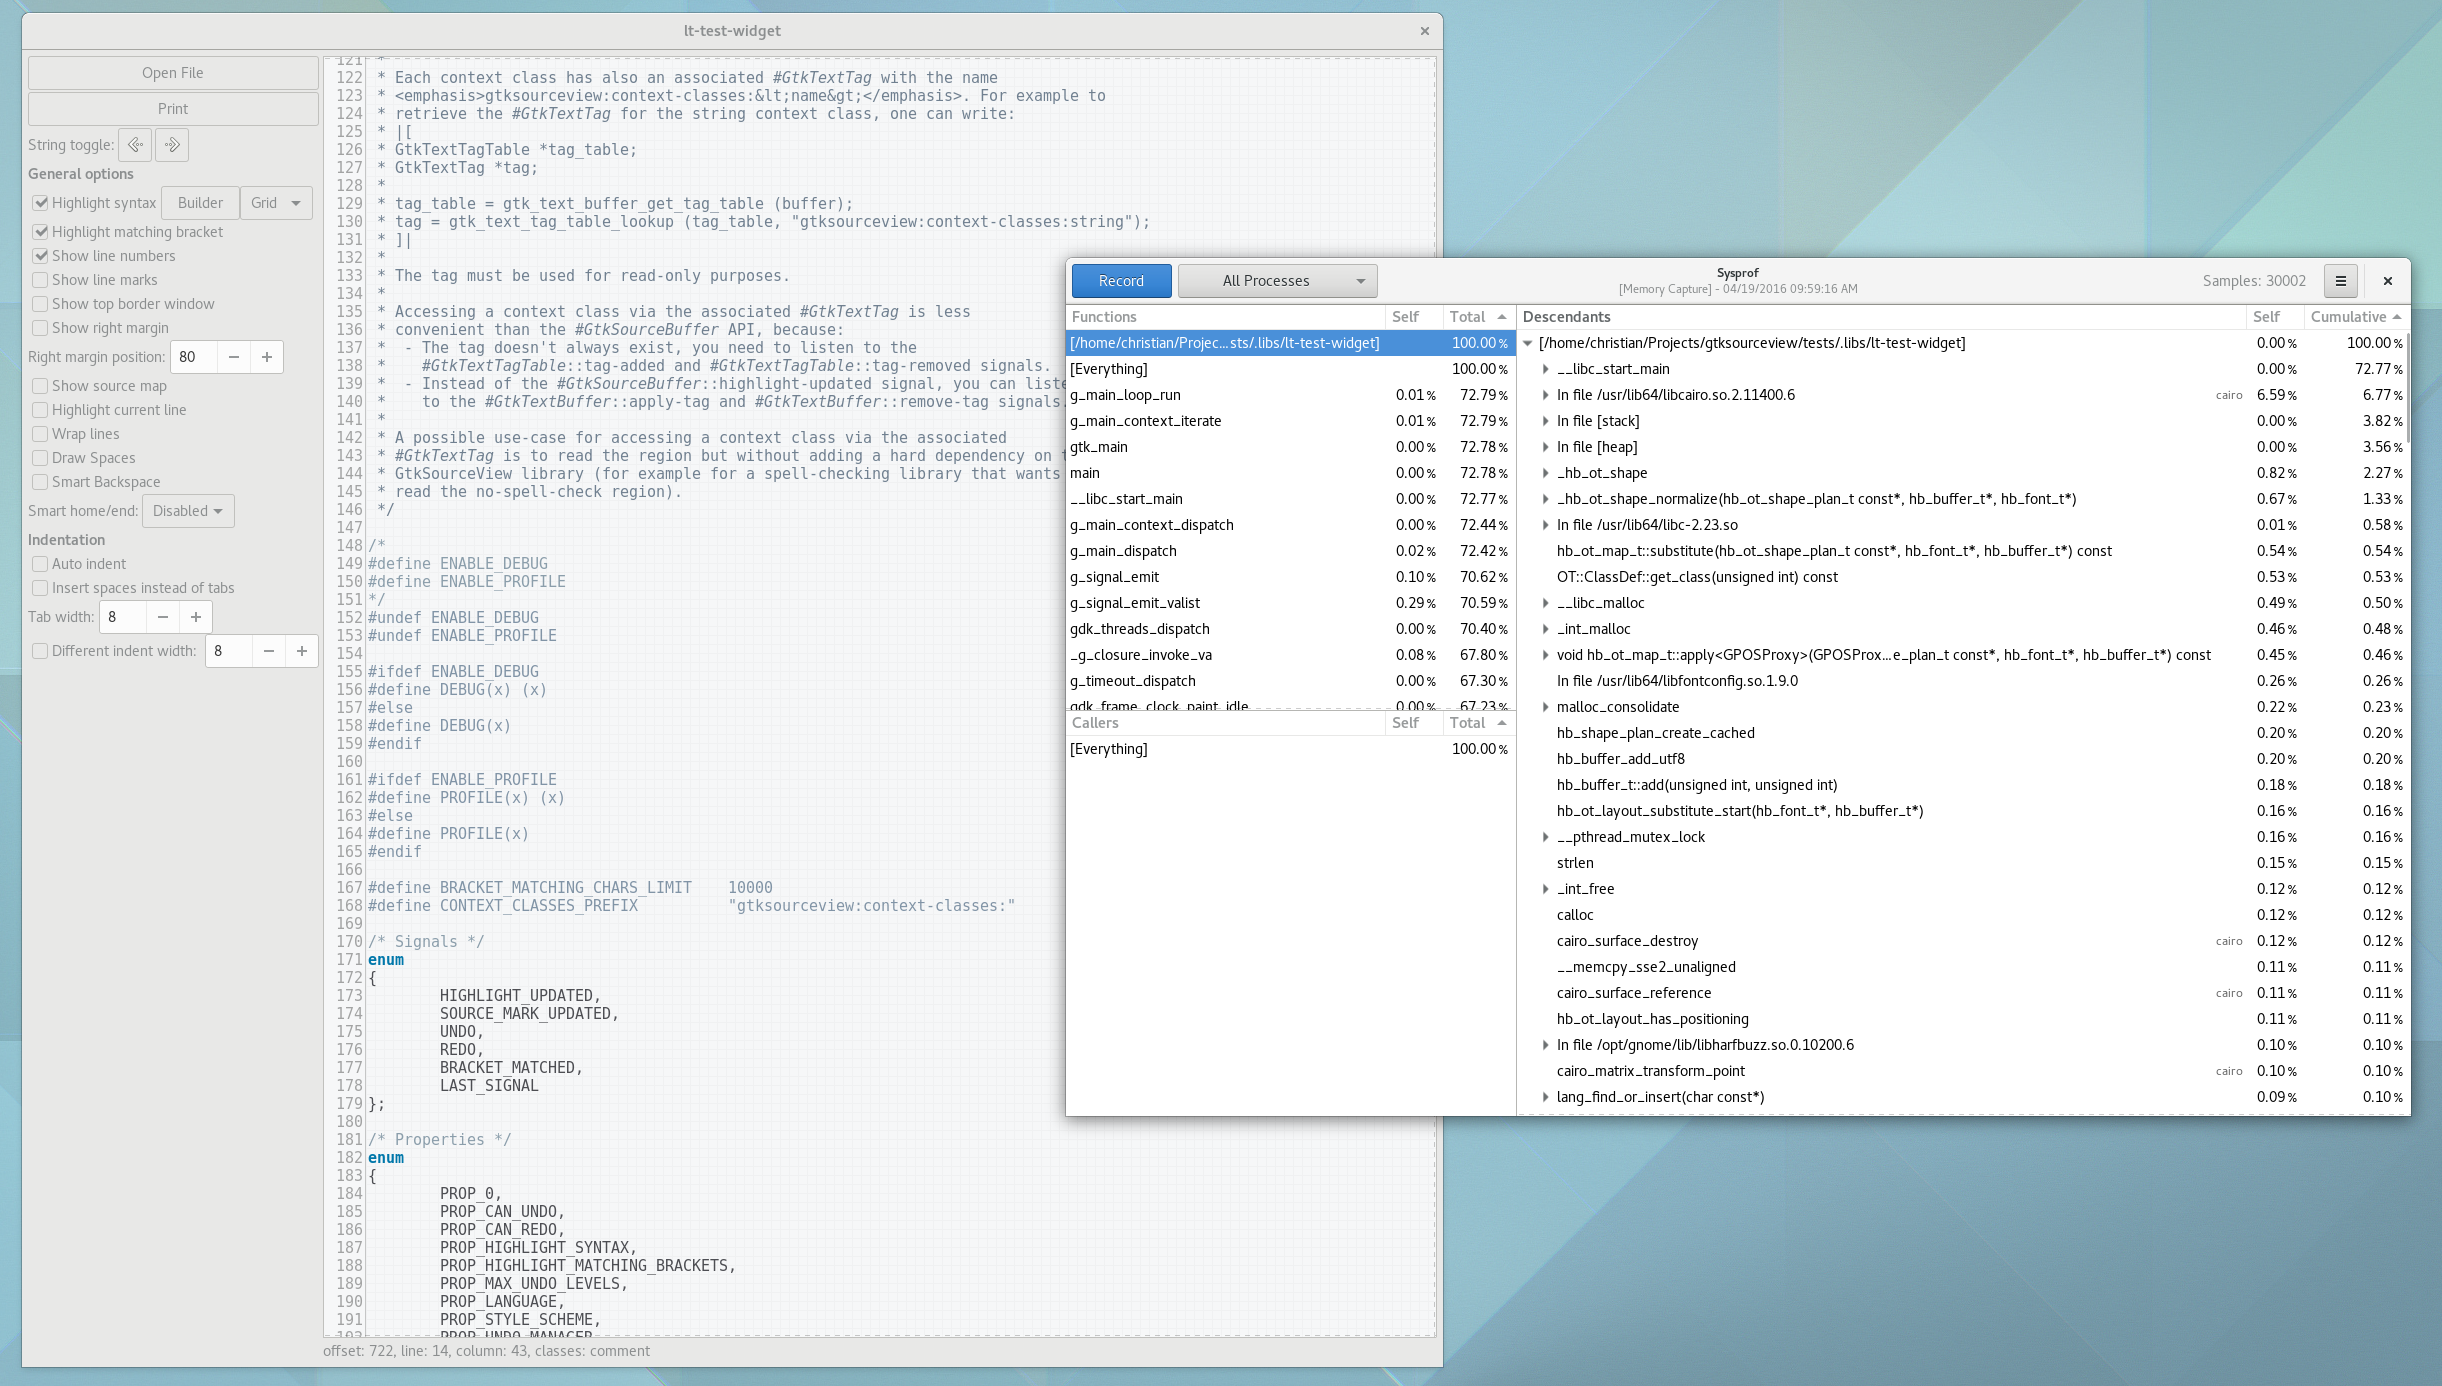
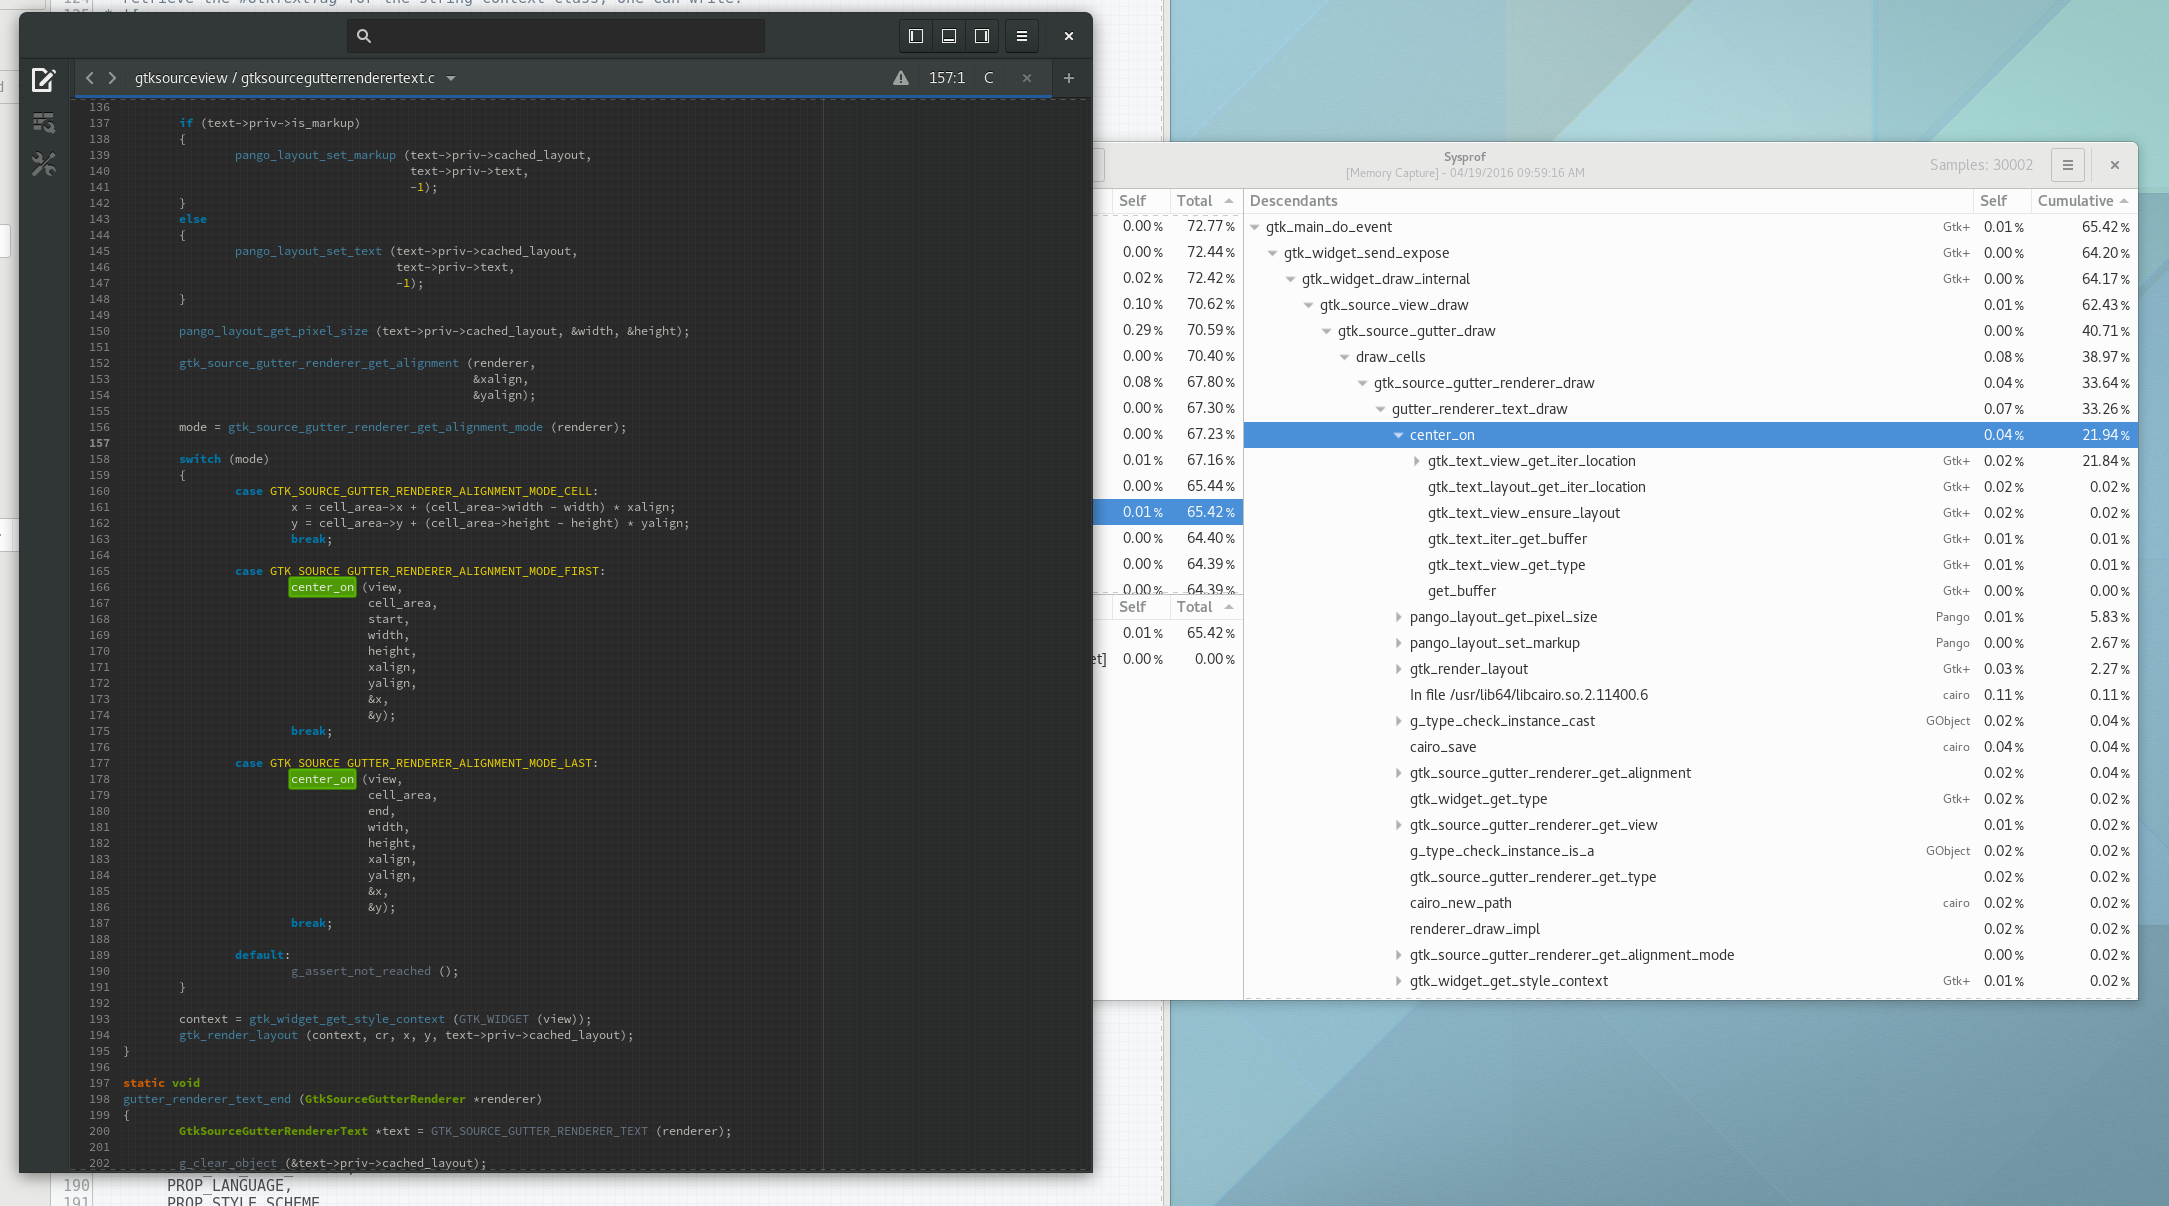
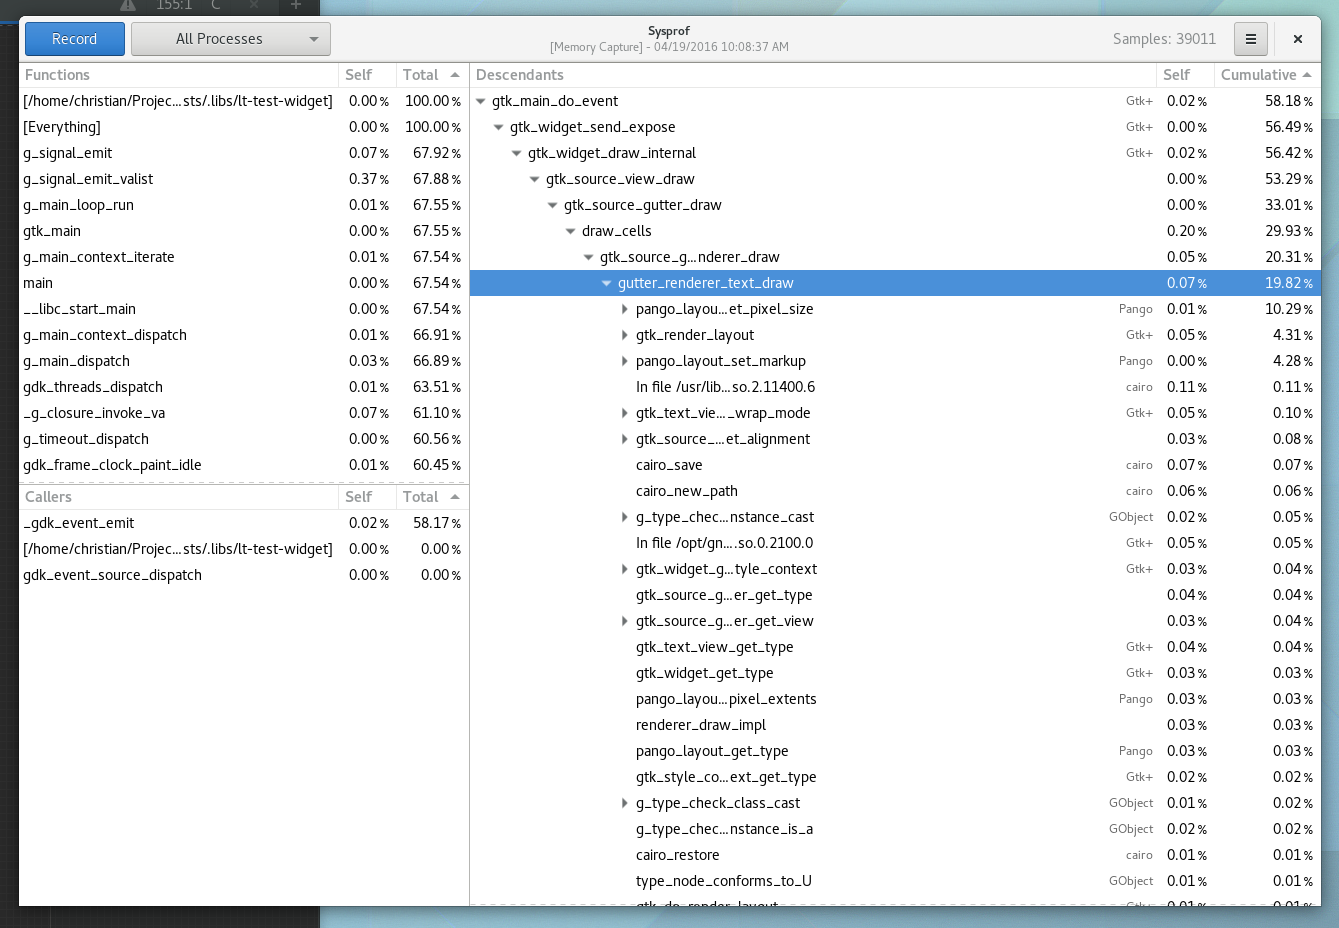
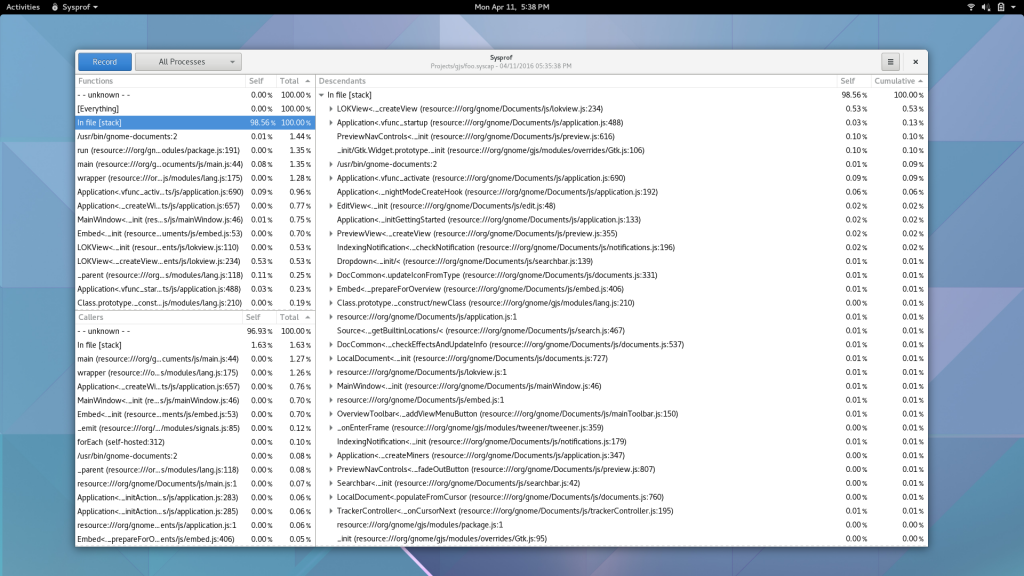
So what does that even mean?

Well, I guess you can see for yourself. Here is a simple capture I did to pick on GNOME documents (no reason really, just the first JavaScript/C hybrid app that came to mind) showing Sysprof reading our JavaScript profiler output.

Gjs Profiler

There is still some work to be done. I need to get the Gjs patches in a format suitable for inclusion. That means fixing up some boring signal handler code to be more safe. Ray Strode has already provided some good feedback here.

Additionally, I need to get my sysprof2 repository grafted into upstream Sysprof. This week I swear. We also need to get patches into some programs that use libgjs directly without the use of gjs-console so that they too can be profiled. gnome-shell is the obvious culprit here.

Come hack on Sysprof with me? Please?

If any of this interests you, I’d love to have some people come help work on modernizing Sysprof into something we all love. It’s still missing one thing I loved while working on PerfKit years ago. Pretty graphs and charts of runtime information. We can start sampling cpu, memory, network, kms/drm information, and more. With that data available, we can build some pretty compelling tooling for GNOME and GNU/Linux in general. (BSDs obviously too, but today Sysprof is Linux only due to the Linux kernel integration).

No doubt, there are gaps and missing information in this blog post. It’s hard to capture all the details after you do the work. For the nitty-gritty details, best to go look at the code.

  • https://github.com/chergert/sysprof2
  • https://github.com/chergert/gjs
  • Build/install the code above.
  • gjs-console --profile-output=foo.syscap /usr/bin/gnome-documents
  • You might need to let it exit gracefully, I don’t have periodic sample flushes implemented yet.
  • sysprof foo.capture
  • Explore!

Thanks to Red Hat for letting me dive head first into this. They really are the best employer I’ve ever had.

Making profiling easy

One of the tools we often find ourselves using when working on GTK+ is sysprof. While doing some profiling recently, I got annoyed that it was one of the few programs on my system that required GTK+ 2.x.

I decided to improve things over the last week and see if we can make something that could be used with Builder too.

First, I needed a library so that we can consume these bits from Builder. So now there is a libsysprof-2 library. The modules have been cleaned up to fit into typical GObject-style library usage.

There were some rough edges on the UI as well. For example, if you tried to launch a profile from the UI, it would fail because non-root users cannot call the __NR_perf_event_open syscall. Getting around this requires running the UI as root (non-ideal) or having a helper process that can run as root and perform the syscall for you. Obviously, I went with the latter. That means there is now a sysprof daemon that uses polkit to check for authorization. GNOME Shell users will see the typical authorization dialog if your DBus connection to the daemon lacks the required credentials.

Additionally, I abstracted the event sources. This will allow us to plug in additional data in the future like cpu, memory, network, systemtap probes, and more.

Due to abstracting the new data sources, I needed a new capture format. I decided to put together a very simple binary capture format for now. It makes things rather simple so we can have mmap() windows as we capture events to disk. We also support memory captures thanks to memfd (and the same mmap window code).

For the inevitable question of “Why not just use the perf capture format?”, my answer right now is simply that I hope to support more than just perf captures and I’d like to have everything in a single file.

I’m going to start merging this into sysprof on git.gnome.org over the next week, but if you want to take a look at things now, you can find the code here.

I really hope that moving this project forward inspires some of you to jump into the code base and help. There is so much we can do in this space. Having great tools helps us all write greater software faster.

sysprof-blog1

sysprof-blog2

Screenshot from 2016-04-03 03-49-54

sysprof-blog3

sysprof-blog4

How to setup distcc (and ccache) in Builder

If you find yourself with a distcc setup, you might be wondering how to set it up in Builder. Let us assume you’ve setup a distccd on a Fedora 23 server doing something like the following.

# dnf install distcc-server
# echo 'OPTIONS="--jobs 24 --allow 192.168.122.0/24"' >> /etc/sysconfig/distccd
# systemctl enable distccd.service
# service distccd start

Now open your project in Builder and go to the configuration perspective.

Build Configuration

Duplicate the configuration and add the CC and DISTCC_HOSTS environment variables like below. I like using -std=gnu11, but you need not do the same.

Add CC and DISTCC_HOSTS

Keep in mind, that distcc is not magic pixie dust. It isn’t always faster than compiling locally.

Now that we have a basic distcc setup, lets extend it to use ccache to cache compilation results that are exactly the same as previous builds. First make sure you have ccache installed.

# dnf install ccache

Next tweak the environment variables to use ccache gcc as our CC, and instruct ccache to use distcc by setting the CCACHE_PREFIX environment variable to "distcc".

Using ccache as CC