I write about Sysprof here quite often. Mostly in hopes of encouraging readers to use it to improve Linux as a whole.
An impediment to that is the intrusiveness to test out new features as they are developed. If only we had a Flatpak which you could install to test things right away.
One major hurdle is how much information a profiler needs to be useful. The first obvious “impossible to sandbox” API you run into is the perf subsystem. It provides information about all processes running on the system and their memory mappings which would make snooping on other processes trivial. Both perf and ptrace are disabled in the Flatpak sandbox.
After that, you still need unredacted access to the kernel symbols and their address mappings (kallsyms). You also need to be in a PID namespaces that allows you to see all the processes running on the system and their associated memory mappings which essentially means CAP_SYS_ADMIN.
Portable Services
Years ago, portable services were introduced into systemd through portablectl. I had high-hopes for this because it meant that I could perhaps ship a squashfs and inject it as a transient service on the host.
However, Sysprof needs more integration than could be provided by this because portable services are still rather isolated from the host. We need to own a D-Bus name, policy-kit action integration, in addition to the systemd service.
Even if that were all possible with portable services it wouldn’t get us access to some of the host information we need to properly decode symbols.
System Extensions
Then came along systemd-sysext. It provides a way to “layer” extensions on top of the host system’s /usr installation rather than in an isolated mount namespace.
This sounds much more promising because it would allow us to install .policy for policy-kit, .service files for Systemd and D-Bus, or even udev rules.
Though, with great power comes excruciating pain, or something like that.
So if you need to provide binaries that run on the host you need to either static-link (rust, go, zig perhaps?) or use something you can reasonably expect to be there (python?).
In the Sysprof case, everything is C so it can statically link almost everything by being clever with how it builds against glibc. Though this still requires glibc and quite frankly I’m fine with that. Potentially, one could use MUSL or ucLibc if they had high enough pain threshold for build tooling.
Bridging Flatpak and System Extensions
The next step would be to find a way to bridge system extensions and Flatpak.
In the wip/chergert/sysext branch of Sysprof I’ve made it build a number of things statically so that I can provide a system extension directory tree at /app/lib/extensions. We can of course choose a different path for this but that seemed similar to /var/lib/extensions.
Here we see the directory tree laid out. To do this right for systemd-sysext we also need to install an extension point file but I’ll save that for another day.
The Directory Tree
$ find /app/lib/extensions -type f

/app/lib/extensions/usr/lib/systemd/system/sysprof3.service

/app/lib/extensions/usr/share/polkit-1/actions/org.gnome.sysprof3.policy

/app/lib/extensions/usr/share/dbus-1/system-services/org.gnome.Sysprof3.service

/app/lib/extensions/usr/share/dbus-1/system.d/org.gnome.Sysprof3.conf

/app/lib/extensions/usr/libexec/sysprofd
Registering the Service
First we need to symlink our system extension into the appropriate place for systemd-sysext to pick it up. Typically /var/lib/extensions is used for transient services so if this were being automated we might use another directory for this.
# mkdir -p /var/lib/extensions

# ln -s /var/lib/flatpak/org.gnome.Sysprof.Devel/current/active/files/lib/extensions/ org.gnome.Sysprof.Devel
Now we need to merge the extension so it overlays into /usr. We must use --force because we didn’t yet provide an appropriate extension point file for systemd.
# systemd-sysext merge --force

Using extensions 'org.gnome.Sysprof.Devel'.

Merged extensions into '/usr'.
And now make sure our service was installed to the approriate location.
# ls /usr/lib/systemd/systemd/sysprof3.service

-rw-r--r-- 2 root root 115 Dec 31  1969 /usr/lib/systemd/system/sysprof3.service
Next we need to reload the systemd daemon, but newer versions of systemd do this automatically.
# systemctl daemon-reload
Here is where things are a bit tricky because they are somewhat specific to the system. I think we should make this better in the appropriate upstream projects to avoid this altogether but also easily handled with a flatpak installation trigger.
First make sure that policy-kit reloads our installed policy file.
# systemctl restart polkit.service
With dbus-broker, we also need to reload configuration to pick up our new service file. I’m not sure if dbus-daemon would require this, I haven’t tested that. Though I wouldn’t be surprised if this is related to inotify file-monitors and introducing a merged /usr.
# gdbus call -y -d org.freedesktop.DBus \

  -o /org/freedesktop/DBus \

  -m org.freedesktop.DBus.ReloadConfig
At this point, the service should be both systemd and D-Bus activatable. We can verify that with another gdbus call quick.
# gdbus call -y -d org.gnome.Sysprof3 \

  -o /org/gnome/Sysprof3 \

  -m org.freedesktop.DBus.Peer.Ping

()
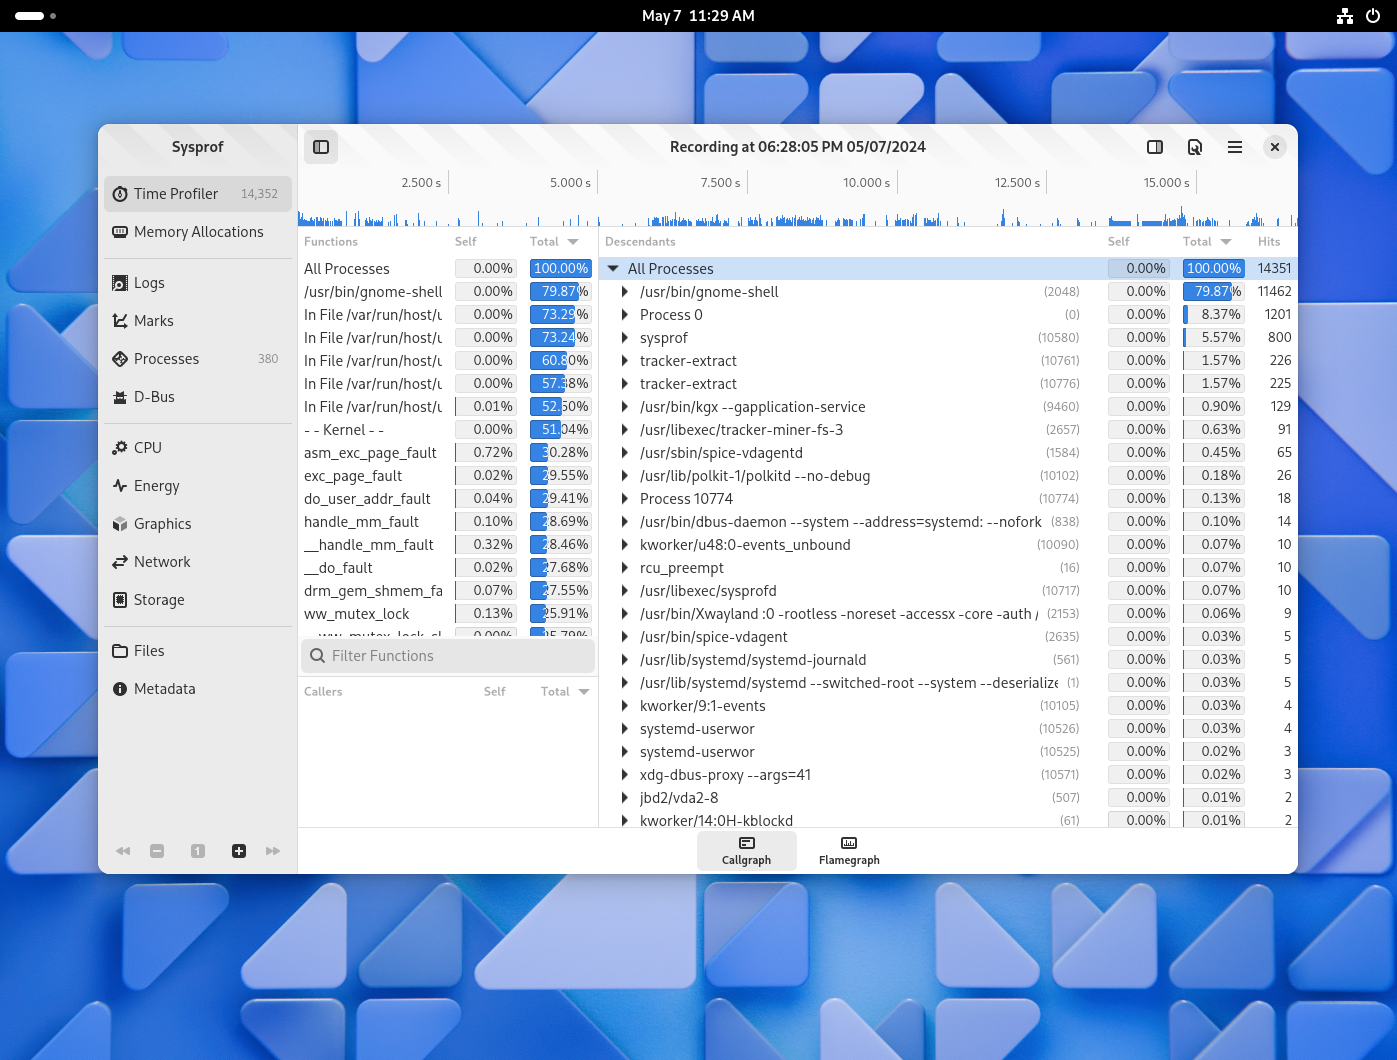
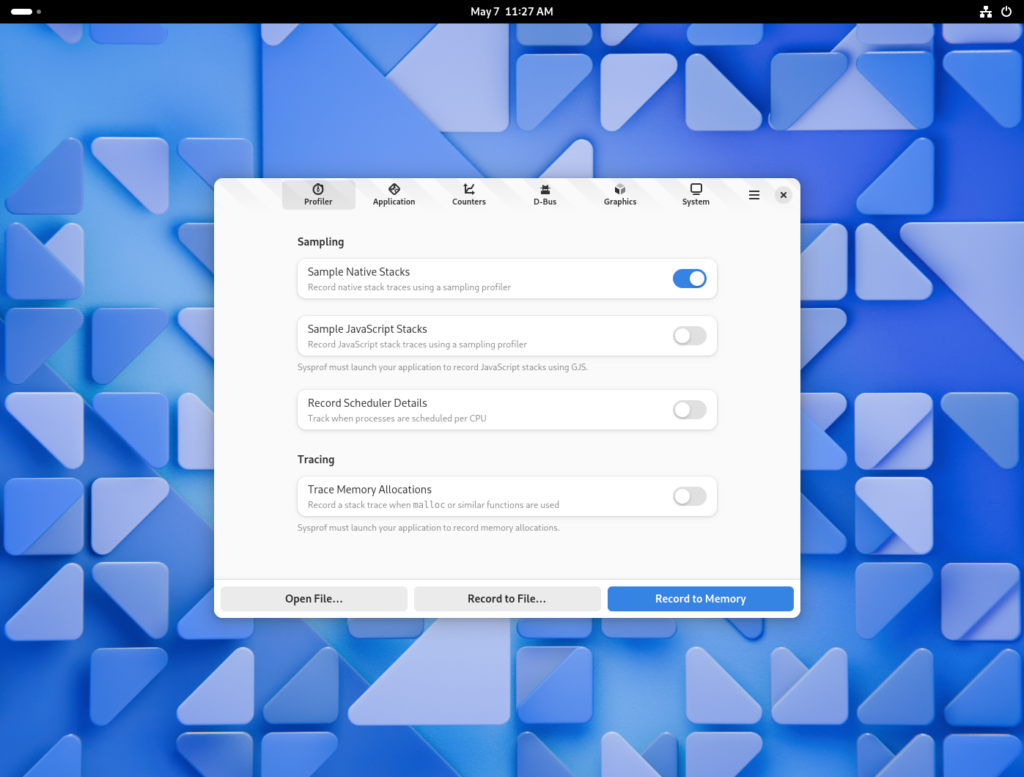
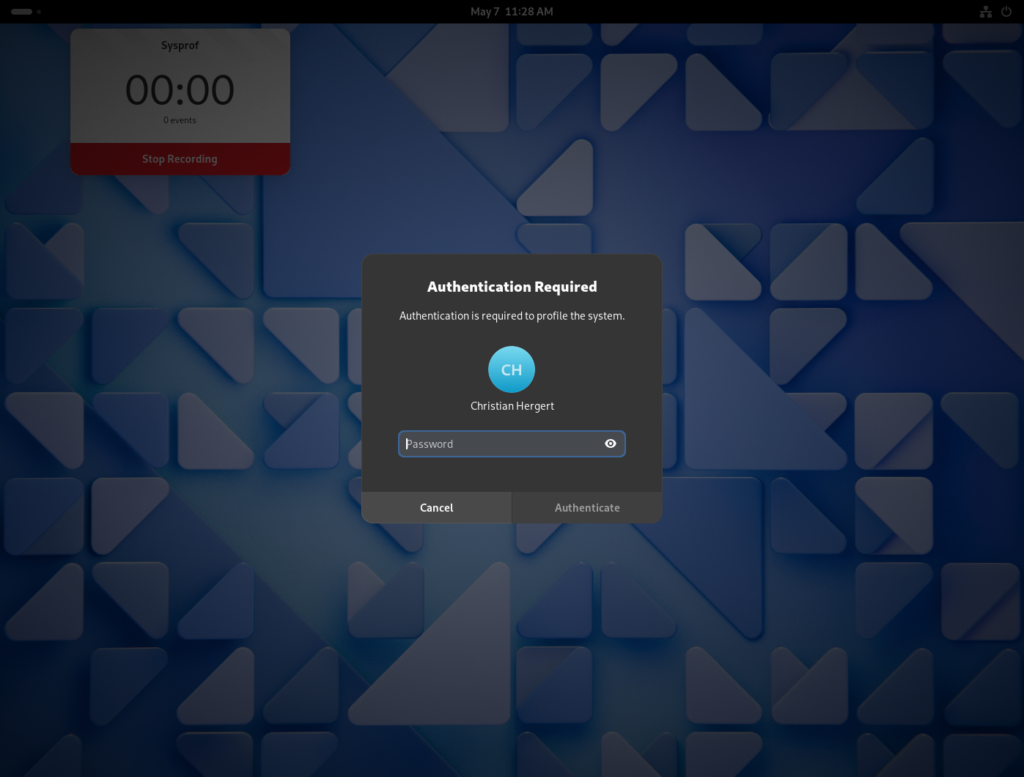
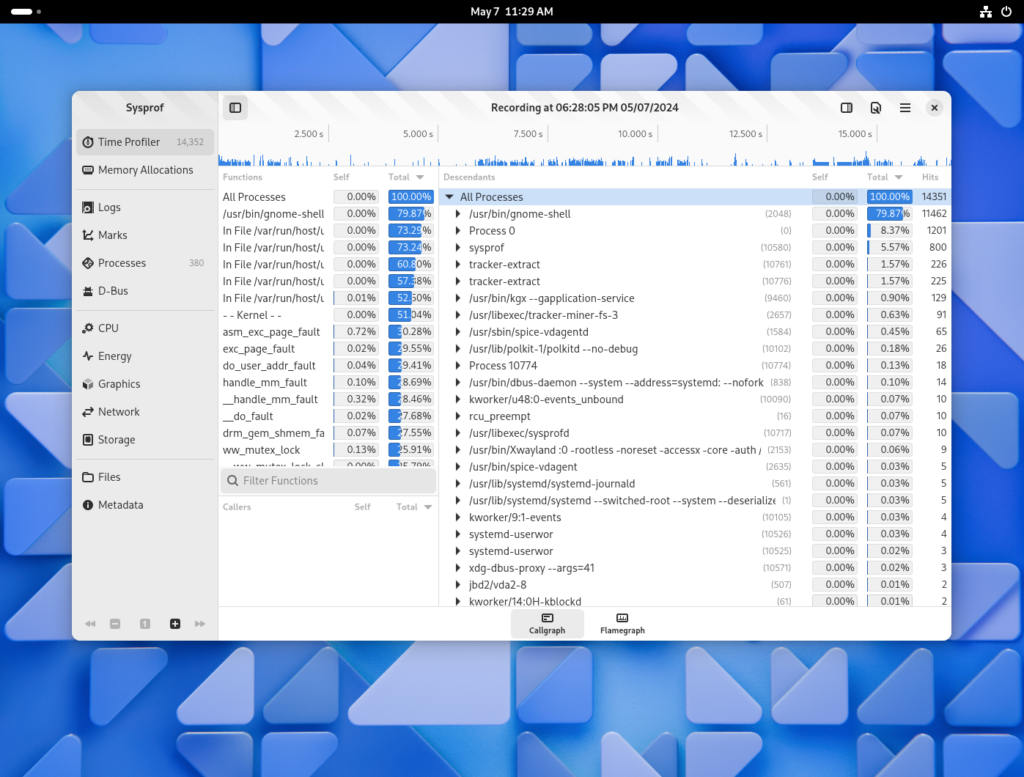
Now I can run the Flatpak as normal and it should be able to use the system extension to get profiling and system data from the host as if it were package installed.
$ flatpak run org.gnome.Sysprof.Devel
The following screenshots come from GNOME OS using yesterdays build with what I’ve described in this post. However, it also works on Fedora Rawhide (and probably Fedora 40) if you boot with selinux=0. More on that in the FAQ below.
Flatpak Integration
So obviously nobody would want to do all the work above just to make their Flatpak work. The user-facing goal here would be for the appropriate triggers to be provided by Flatpak to handle this automatically.
Making this happen in an automated fashion from flatpak installation triggers on the --system installation does not seem terribly out-of-scope. It’s possible that we might want to do it from within the flatpak binary itself but I don’t think that is necessary yet.
FAQ
What about non-system installations?
It would be expected that system extensions require installing to a system installation.
It does not make sense to allow for a --user installation, controllable by an unprivileged user or application, to be merged onto the host.
Does SELinux affect this?
In fact it does.
While all of this works out-of-the-box on GNOME OS, systems like Fedora will need work to ensure their SELinux policy to not prevent system extentions from functioning. Of course you can boot with selinux=0 but that is not viable/advised on end-user installations.
In the Sysprof case, AVC denials would occur when trying to exec /usr/libexec/sysprofd.
Does /usr become read-only?
If you have systemd <= 255 then system-sysext will most definitely leave /usr read-only. This is problematic if you want to modify your system after merging but makes sense because sysext was designed for immutable systems.
For example, say you wanted to sudo dnf install a-package on Fedora. That would fail because /usr becomes read-only after systemd-sysext merge.
In systemd >= 256 there is effort underway to make /usr writable by redirecting writes to the top-most writable layer. Though my early testing of Fedora Rawhide with systemd 256~rc1 still shows this is not yet working.
So why not a Portal?
One could write a portal for profilers alone but that portal would essentially be sysprofd and likely to be extremely application specific.
Can I use this for udev rules?
You could.
Though you might be better served by using the new Device and/or USB portals which will both save you code and systems integration hassle.
Can I have different binaries per OS?
Yes.
The systemd-sysext subsystem has a directory layout which allows for matching on some specific information in /etc/os-release. You could, for example, have a different system extension for specific Debian or CentOS Stream versions.
Can they be used at boot?
If we choose to symlink into a persistent systemd-sysext location (perhaps /etc/extensions) then they would be available at boot.
Can services run independent of user app?
Yes.
It would be possible to have a system service that could run independently of the user facing application.