Prompt

Prompt is a terminal that marries the best of GNOME Builder’s seamless container support, the beauty of GNOME Text Editor, and the robustness of VTE. I like to think of it as a companion terminal to Builder.

Though it’s also useful for immutable/container-oriented desktops like Fedora Silverblue or Project Bluefin where containers are front-and-center.

A screenshot of Prompt with a menu open showing a list of available containers to spawn a new terminal shell within.

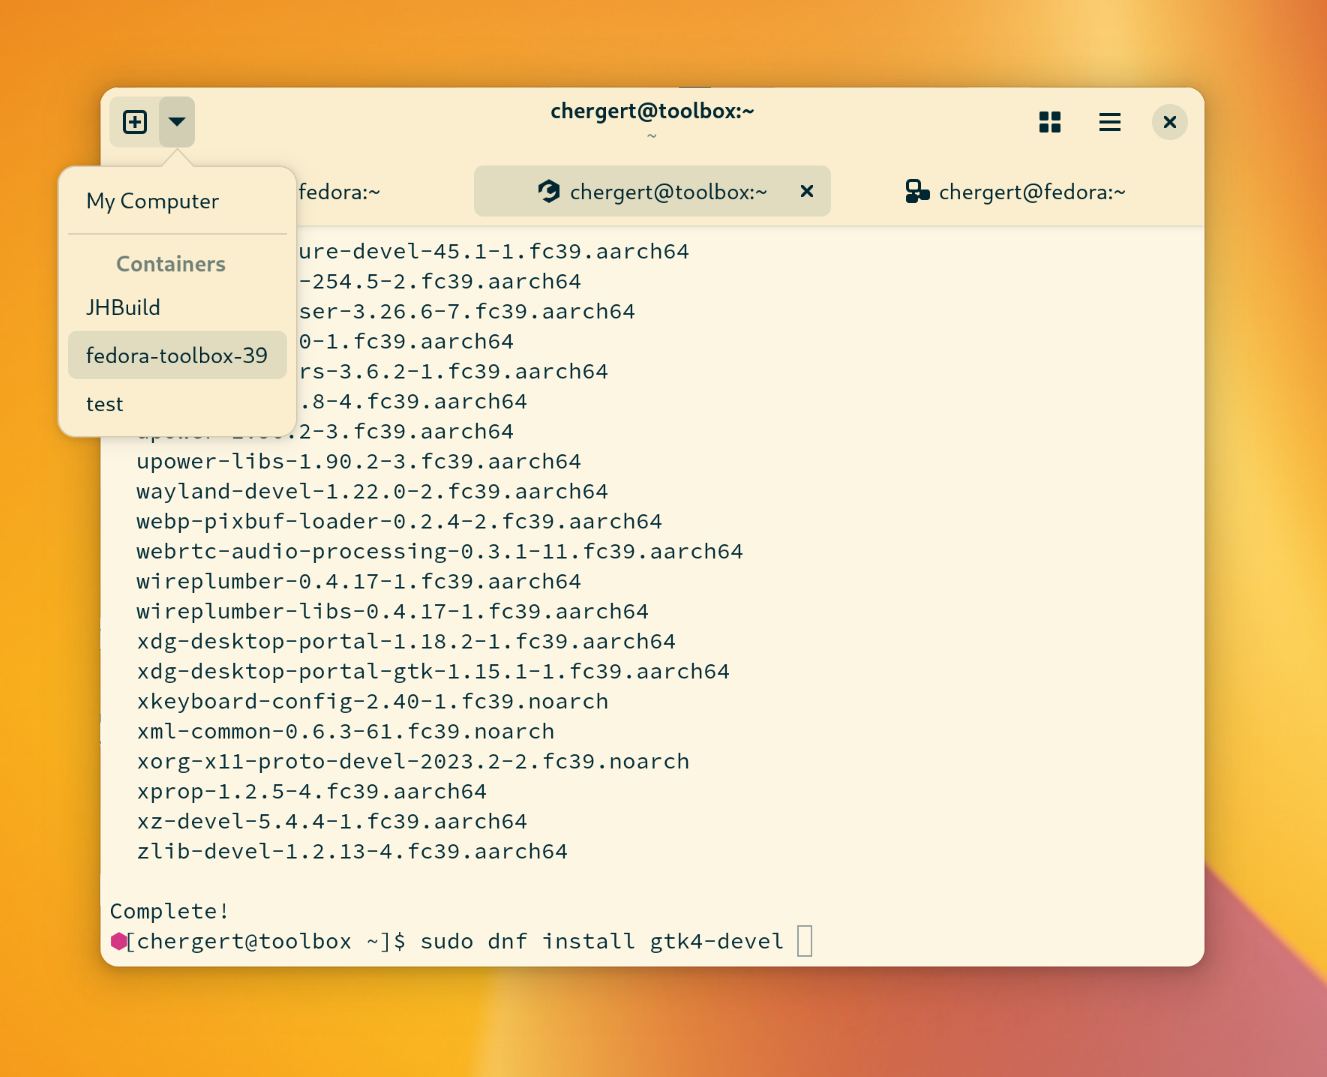
This came out of a prototype I made for the GNOME Builder IDE nearly a decade ago. We already had all the container abstractions so why not expose them as a Terminal Workspace?

Prompt extracts the container portion of the code-foundry into a standalone program.

My prototype didn’t go anywhere in recent years because I was conflicted. I have a high performance bar for software I ship and VTE wasn’t there yet on Wayland-based compositors which I use. But if you frequent this blog you already know that I reached out to the meticulous VTE maintainers and helped them pick the right battles to nearly double performance this GNOME cycle. I also ported gnome-terminal to GTK 4 which provided me ample opportunity to see where and how containers would integrate from an application perspective.

I designed Prompt to be Flatpak-first. That has design implications if you want a robust feature-set. Typically an application is restricted to the PID and PTY namespace within the Flatpak sandbox even if you’re capable of executing processes on the host. That means using TTY API like tcgetpgrp() becomes utterly useless when the kernel ioctl() returns you a PID of 0 (as it’s in a different namespace). Notably, 0 is the one value tcgetpgrp() is not documented to return. How fun!

To give Prompt the best chance at tracking containers and foreground processes a prompt-agent runs from the host system. It is restricted to very old versions of GLib/GObject/GIO and JSON-GLib because we know that /usr/bin/flatpak will already require them. Using those libraries instead of certain GLibc API helps us in situations where GLibc is only backward-compatible and not forwards-compatible. Combined with point-to-point D-Bus serialization on top of a socketpair() we have a robust way to pass file-descriptors between the agent and the UI process and we’ll use that a bunch.

There are a lot of little tricks in here to keep things fast and avoid energy-drain. For example, process tracking is done with a combination of exponential-backoff and re-triggering based on either new content arriving or certain key-presses. It gives a very low-latency feeling to the sudo/ssh feature I love from Console, albeit with less overhead.

One thing I find helpful with Builder is that when I come back to it my project session is right there. So this has session support too. It will restore your tabs/containers how they were before. So if you have a similar workflow you might find that useful. If not? Just turn it off in Preferences.

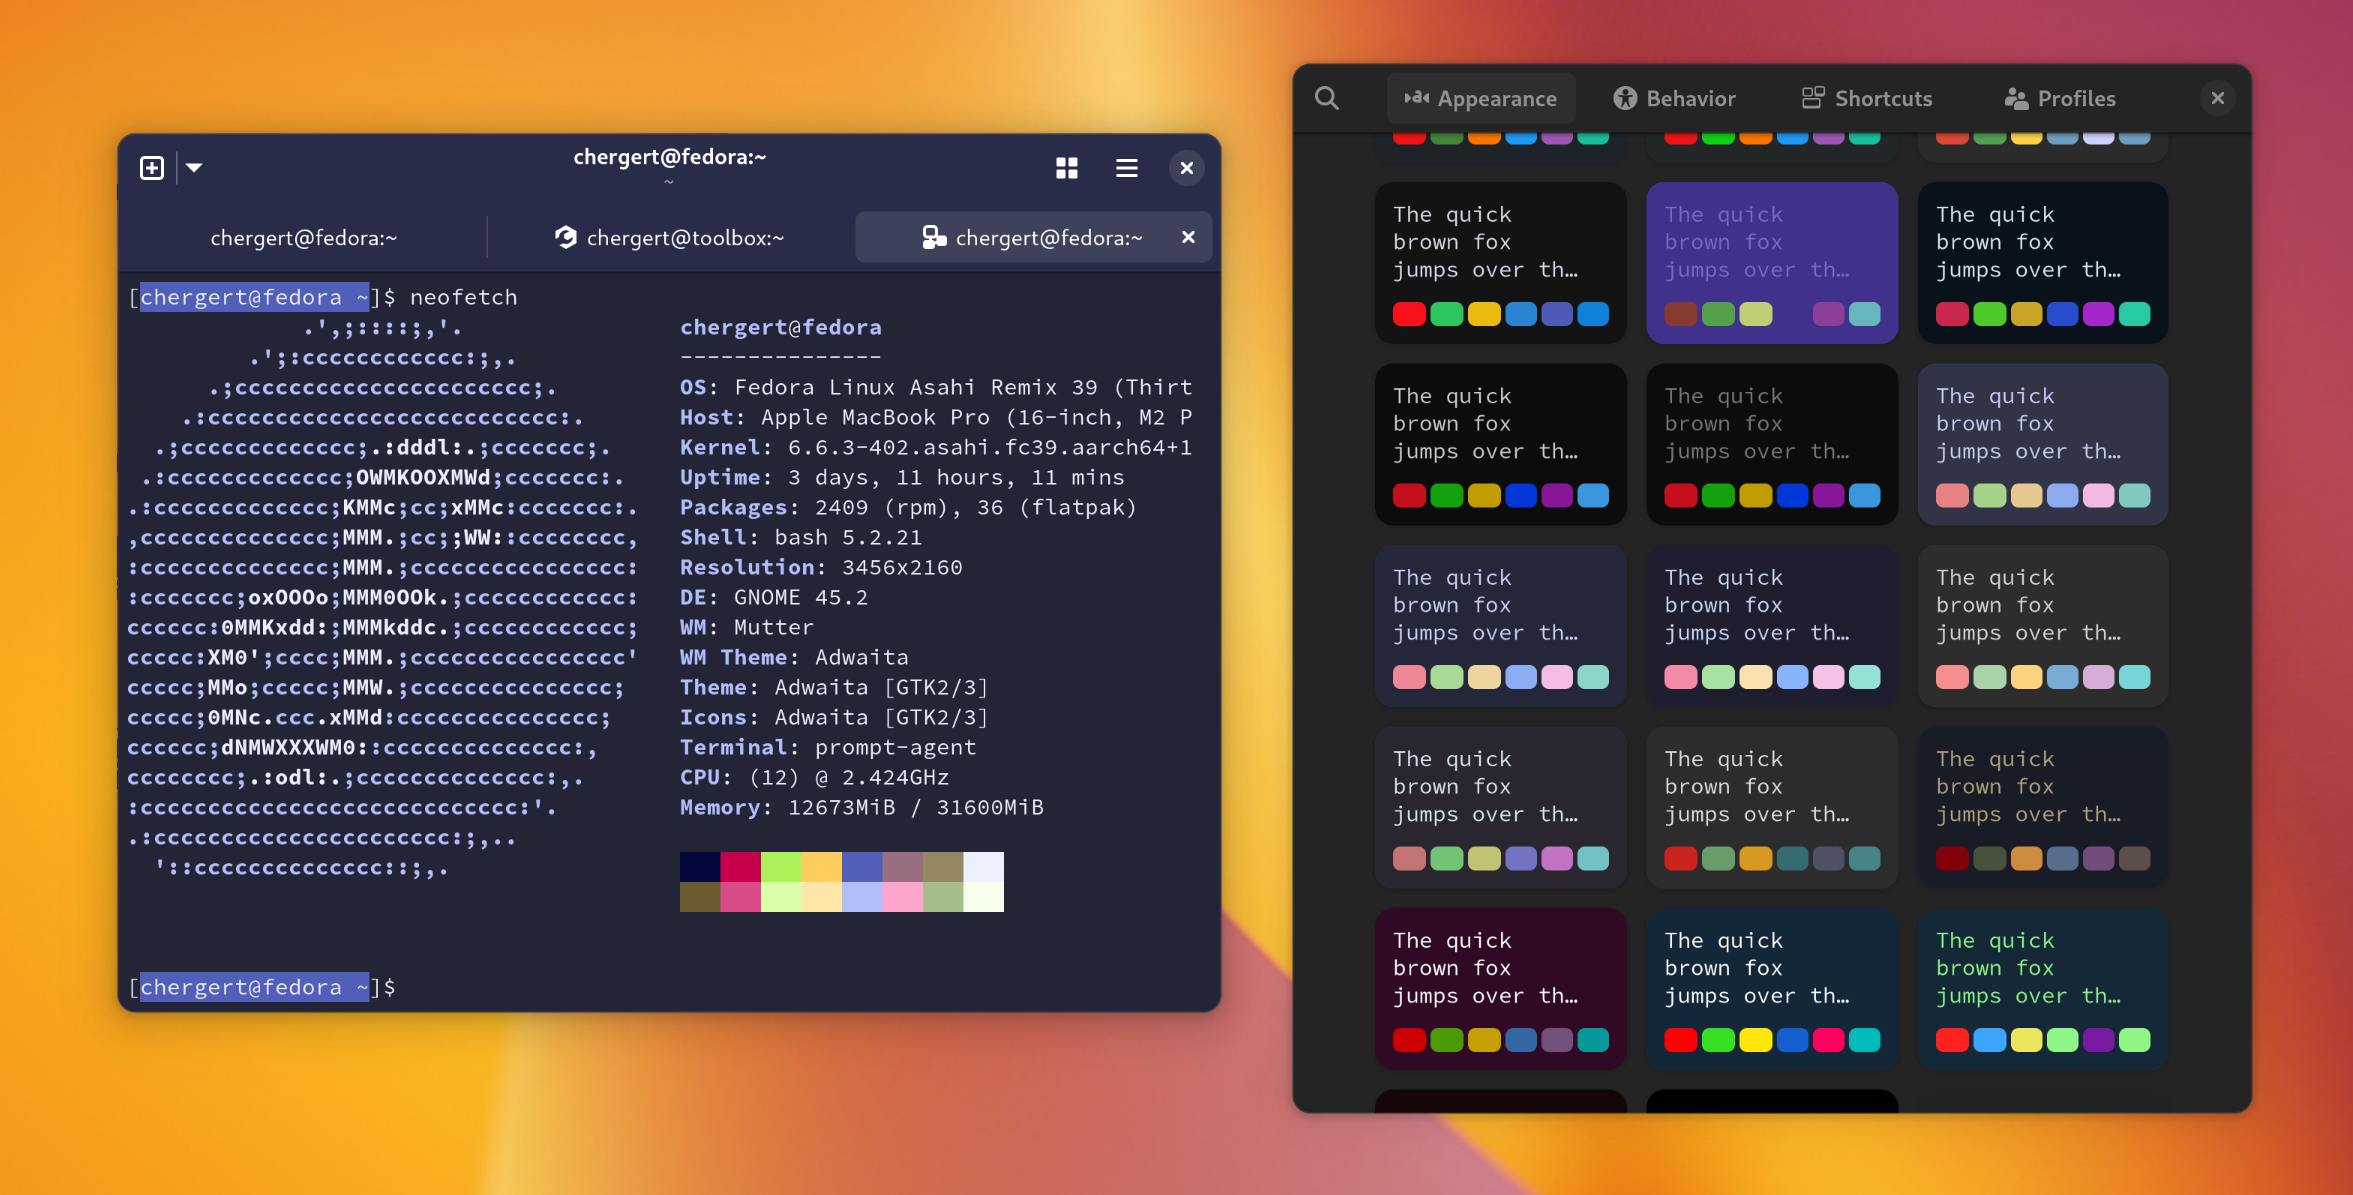
I want to have a bit of fun because right now I’m stuck indoors caring for my young, paraplegic dog. So it’s packed full of palettes you can play with. Who doesn’t like a little color!

A screenshot of Prompt with the preferences window open allowing the selection of numerous palettes with diverse color sets. The terminal window is recolored using colors from the palette.

There are some subtle performance choices that make for a better experience in Prompt. For example, I do like having a small amount of padding around the terminal so that rounded corners look nice and also avoids an extra framebuffer when rendering on the GPU. However, that looks odd with scrollback. So Prompt rewrites the snapshot from VTE to remove the background and extraneous clipping. We already have a background from window recoloring anyway. It’s a small detail that just feels good when using it.

Another subtle improvement is detecting when we are entering the tab overview. Currently, libadwaita uses a GtkWidgetPaintable to represent the tab contents. This works great for the likes of Epiphany where the contents are backed by GL textures. But for a terminal application we have a lot of text and we don’t want to redraw it scaled as would happen in this case. That puts a lot of pressure on the glyph cache. So instead, we create a single texture upfront and scale that texture. Much smoother.

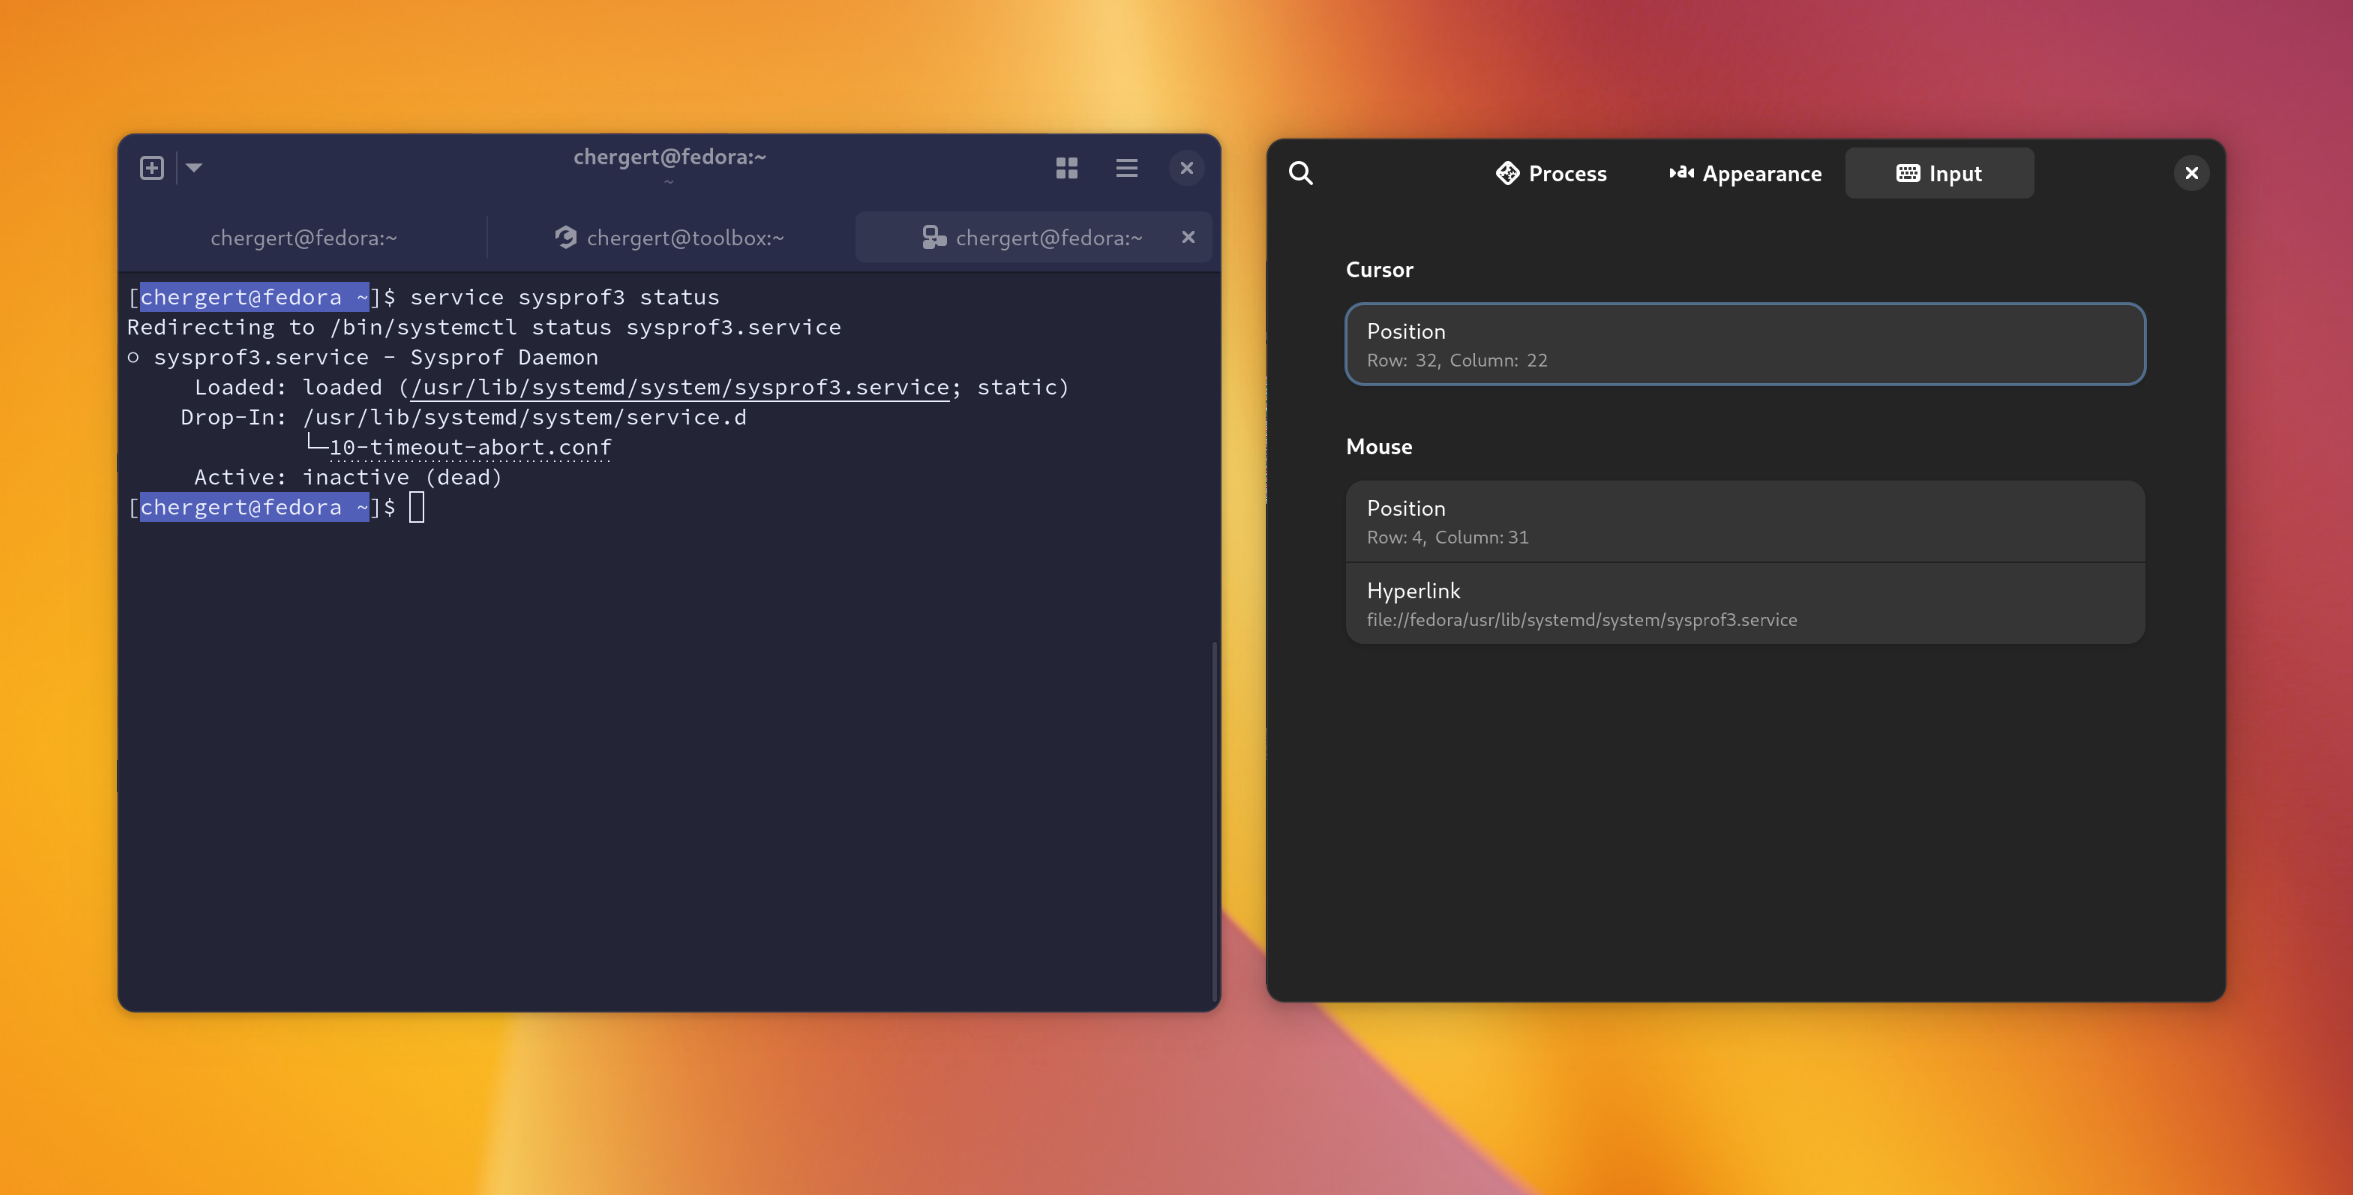
For people writing terminal applications there is a little inspector you can popup to help you out. It can be difficult to know if you’re doing the right thing or getting the right behavior so this might be something we can extend going forward to make that easier for you. GTK’s inspector already does so much so this is just an extension of what you could do there.

A terminal window open with a secondary "inspector" window open. The inspector shows what column and row the mouse is positioned as well as the cursor and what non-visible OSC hyperlink is under the pointer.

Creating Prompt has elevated problems we should fix.

  • Podman creates an additional PTY which sort of breaks the whole notion of foreground processes. Filed an issue upstream and it seems likely we can get that addressed for personal containers. That will improve what happens when you close your terminal tab with something running or if you SSH’d into another host from the container.
  • Container tracking is currently limited to Fedora hosts because toolbox only emits the container-tracking escape sequences when the host is Fedora. The current goal I’ve discussed with VTE maintainers is that we’ll use a new “termprop” feature in VTE that will be silently dropped on terminal applications not interested in it. That way toolbox and the likes can safely emit the escape sequence.
  • Currently podman will exit if you pass a --user or --workdir that does not exist in the container. That isn’t a problem with toolbox as it is always your user and fails gracefully for directories. So we need a good strategy to see if both of those are available to inherit when creating new tabs.
  • This does have transparency support, but it’s hidden in a GSetting for now. Once we have libadwaita with CSS variable support we can probably make this look better during transitions which is where it falls down now. We also need some work on how AdwTabOverview does snapshots of tabs and inserts a background.
  • I have a .bashrc snippet to treat jhbuild as a container which is helpful for those of us GNOME developers still using it.
  • Accessibility is an extremely important piece of our infrastructure in GNOME. So part of this work will inevitably tie into making sure the a11y portion of VTE works with the soon-to-land a11y improvements in GTK. That has always been missing on GTK 4-based VTE and therefore every terminal based upon it.
$ flatpak install --user --from https://nightly.gnome.org/repo/appstream/org.gnome.Prompt.Devel.flatpakref

If you like software that I write, consider donating to a pet shelter near you this holiday season. We’re so lucky to have great pet care in Oregon but not everywhere is so lucky.

Happy Holiday Hacking!

Toby is Recovering in ER ICU

Normally I’m posting about code here, but for the past two weeks most of my time has been spent taking care of our 4 year old Australian Shepherd. Toby is very special to me and we even share the same birthday!

Toby recently lost control of his hind legs, which was related to a herniated disk and likely IVDD. For the past two weeks my wife and I have been on full-time care duty. Diapers, sponge baths, the whole gamut.

Previously we had X-Rays done but that type of imaging is not all that conclusive for spinal injuries. So yesterday he had a doggy MRI then rushed into surgery for his L1/L2 discs and a spinal tap. The spinal tap is to make sure the situation wasn’t caused by meningitis. It seems to have gone well but this morning he still hasn’t regained control of his hind legs (and that’s to be expected so soon after surgery). He does have feeling in them though, so that’s a positive sign.

He’s still a very happy boy and we got to spend a half hour with him this morning in the ICU.

Thanks to everyone who has been supporting us through this, especially with watching our 5 month kitten June who can be a bit of a rascal during the day. We wouldn’t be able to get any sleep without y’all.

Toby, a 4 year old Australian Shepherd with a soft plushy toy laying on a microfoam bed to ease the pain on his back.

To keep his mind active, Tenzing started to teach him to sing. He’s already got part of La Bouche’s “Be My Lover” down which is just too adorable not to share with you.

VTE performance improvements

To celebrate every new GNOME release I try to do a little bit of work that would be intrusive to land at the end of the cycle. The 46 cycle is no different and this time I’m making our terminals faster.

The terminal is surely the most used desktop app for developers and things have changed in drawing models over the years. There might be some excellent energy savings to be had! So I made myself a little prototype to see how much faster we might be able to go without drastic design changes and use that as my guide to improving VTE performance.

VTE has been around since the early days of GNOME. It’s been touched in some manner by many programmers that I consider more talented than myself, but perhaps I can improve things yet!

So far I’ve landed a little over a dozen patches, none of which address drawing (yet). So that means these patches will make both the GTK 3 and GTK 4 versions of VTE faster. Once the last patch lands in this category we will have cut wall clock time down for a number of common scenarios by a solid 40%. That’s a pretty good win!

After these land I have a bunch of patches which introduce native GTK 4 drawing primitives instead of Cairo. Those patches will ultimately reduce draw latency on GTK 4 while not regressing GTK 3 performance. There are still a couple things to figure out around some “minifont” usage, but things are looking good.

I’d also like to find a way to get draw timing driven by the frame clock rather than some internal timeouts. Combining that with the GTK 4 native drawing will certainly make things feel faster on the “butt dyno”.

Anyway, I probably won’t go down the rabbit hole with this, I just want to get things inline with performance expectations.

And to nobodies surprise, this is the type of stuff that is much easier to do when armed with Sysprof and working frame-pointers.

What have frame-pointers given us anyway

I obsess over battery life. So having a working Sysprof in Fedora 39 with actually useful frame-pointers has been lovely. I heard it asked at an All Systems Go talk if having frame-pointers enabled has gained any large performance improvements and that probably deserves addressing.

The answer to that is quite simply yes. Sometimes it’s directly a side-effect of me and others sending performance patches (such as Shell search performance or systemd-oomd patches). Sometimes it just prevents the issues from showing up on peoples systems to begin with. Basically all the new code I write now is done in tandem with Sysprof to visualize how things ran. Misguided choices often stick out earlier.

I think it’s also important to recognize that in addition to gaining performance improvements we’ve not seen people complain about performance regressions. That means we can have visibility to improve things without a significant burden in exchange.

Here is a little gem that I would have been unlikely to find without system-wide frame-pointers. Basically API contract validation needs to do a couple lookups for flags on the TypeNode for GTypeInstance. I’ll remind the reader that GTypeInstance is what underlies GObject, GskRenderNode, and is likely to be our “performance escape hatch” from GObject.

Those checks, in particular for G_TYPE_IS_ABSTRACT() and G_TYPE_IS_DEPRECATED() were easily taking up nearly a percent of samples in some tight loop tests (like creating thousands of GTK render nodes). It turns out that both g_type_create_instance() and g_type_free_instance() were doing these checks. Additionally g_value_unset() on a GBoxed type can do this too (via g_boxed_free()). That gets used all the time for closure invocations such as through the g_signal_* API.

A quick peek with Sysprof, thanks to those frame-pointers, shows the common code paths which hit this. It looks like the flags for abstract and deprecated are stored on an accessory object for the TypeNode. This is a vestige of a day where we must have thought it prudent to be very tight about memory consumption in TypeNodes. But unfortunately, accessing that accessory data requires acquiring the read side of a GRWLock because the type system is mutable. As it were, there is space to cache these bits in the TypeNode directly and the patch linked above does just that.

Combining the above patch with this patch from Emmanuele does wonders for the g_type_create_instance() performance. It basically drops things down to the cost of your malloc() implementation, which is much more ideal.

All of this was only on my radar because I was fixing up a few performance issues in GTK’s OpenGL renderer. Getting extraneous TypeNode checks out of hot code paths and instead at consumer API boundaries instead is always a win for performance.

This is just one example of many. And thankfully, many more people are capable of casually improving performance rather than relying on someone like me thanks to Sysprof and frame-pointers on Fedora.

Flamegraphs for Sysprof

A long requested feature for Sysprof (and most profiler tools in general) is support for visualizing data as FlameGraphs. They are essentially a different view on the same callgraph data we already generate. So yesterday afternoon I spent a bit of time prototyping them to sneak into GNOME 45.

Many tools out there use the venerable flamegraphs.pl but since we already have all the data conveniently in memory, we just draw it with GtkSnapshot. Colorization comes from the same stacktrace categorization I wrote about previously.

A screenshot of flamegraph visualization of a callgraph in Sysprof.

If you select a new time range using the scrubber at the top, the flamegraph will update to stacktraces limited to that selection.

Selecting frames within the flamegraph will dive into those leaving enough breadcrumbs to work your way back out.

Visualizing Scheduler Details

One thing we’ve wanted for a while in Sysprof is the ability to look at what the process scheduler is doing. It can be handy to see what processes where switched and how they may be dependent on one-another. Previously, I’d fire up kernelshark for that as it’s a pretty invaluable tool. But having scheduler data inline with everything else you capture is too useful to pass up.

So here we have the sched:sched_switch tracepoint integrated into Sysprof marks so you can correlate that with the rest of your recording.

Scheduled processes displayed in a time series, segmented by CPU.

Profiling with medium-aged hardware

I like to keep myself honest by using slower computers regularly to do my job. When things become obnoxious, it reminds me to take a closer look at what’s going on.

Today, I did some more profiling of 45.beta with a not-too-old-but-still-a-bit-old laptop. It’s the first laptop I received at Red Hat in 2015. X1 Carbon gen3 (5th gen i7), with 8gb RAM. Not amazing by today’s standards, but still pretty good! Surely things will be fine.

Okay, so first up, after boot, I ssh in from my workstation so I can run sysprof-cli --session-bus --system-bus capture.syscap. Immediately afterwards, I type my login password and hit Enter.

Things are hanging for quite some time, what does Sysprof say?

A screenshot of Sysprof showing most of the time spent in decoding a JXL image.

Looks like we are spending most of our time decoding JXL images. Given that it took about 17 seconds to login, something is clearly going wrong here.

gdk-pixbuf-thumbnailer -s 256 adwaita-l.jxl test.png only takes about 3 seconds. So clearly there is more.

But first, we file an issue because we want to be logged in in about 500 milliseconds, not 15 seconds.

Up next we seem to be spending a lot of time in subdivide_infos() in … GTK CSS parsing. But more specifically, GTK 3 CSS parsing. Hrmm strange, what is GTK 3 that is loading at login? Apparently it’s all the gsd-* tools. And they’re GTK 3 still presumably from libcanberra-gtk or some other requirement. Cool.

Now here is the kicker, I remember putting in code years ago to avoid CSS parsing in these to specifically avoid this issue by creating a fake (and empty) GTK theme. I wonder why it’s not working. Maybe the transition from autotools to meson broke it.

After a bit of re-familiarizing myself with the code it looks like GTK will fallback to internal theme parsing if it can’t find the specified them from $GTK_THEME. Next we pop open gresources list gsd-media-keys to check that the theme resources are there, and indeed they are not. Quick patch to ensure linkage across static libraries and we’re off to the races. A bunch of time wasted in login shaved off and a couple dozen MB of memory reclaimed.

More Sysprof’ing

GWeather

Last time I wrote we talked about a new search index for libgweather. In the end I decided to take another route so that we can improve application performance without any changes. Instead, I added a kdtree to do nearest neighbor search when deserializing GWeatherLocation. That code path was looking for the nearest city from a latitude/longitude in degrees.

The merge request indexes some 10,000 lat/lon points in radians at startup into a kd-tree. When deserializing it can find nearest city without the need for a linear scan. Maybe this is enough to allow significantly more data into the database someday so my small hometown can be represented.

Nautilus

I found a peculiarity in that I was seeing a lot of gtk_init() calls while profiling search. That means processes are being spawned. Since I have D-Bus session capture in Sysprof now, I was able to find this being caused by Nautilus sending an org.freedesktop.DBus.Peer.Ping() RPC to kgx and gnome-disks.

Seems like a reasonable way to find out if a program exists, but it does result in those applications being spawned. gtk_init() can take about 2% CPU alone and combined this is now 4-5% that is unnecessary. Nautilus itself needing to initialize GTK on startup plus these two as a casualty puts us combined over 6%.

D-Bus has an org.freedesktop.DBus.ListActivatableNames() RPC which will tell you what names are activatable. Same outcome, less work.

Corey, like a great maintainer, has already jumped into action.

Photos

I was hesitant to look at gnome-photos because I think it’s falling out of core this next cycle. But since it’s on my system now, I want to take a look.

First off, I was seeing about 10 instances of gnome-photos in a single Sysprof capture. That means that the process was spawned 10 times in response to search queries. In other words, it either must have crashed or exited after each search request I typed into GNOME Shell. Thankfully, it was the later. But since we know gtk_init() alone is about 2%, and combined this looks like it’s in the 30-40% range there must be more to it.

So, easy fix. Call g_application_set_inactivity_timeout() with something reasonable. The search provider was already doing the right thing in calling g_application_hold() and g_application_release() to extend the process lifetime. But without inactivity-timeout set, it doesn’t help much.

After that, we’re down to just one instance. Cool.

Next capture we see we’re still at a few percent, which means something beyond just gtk_init() is getting called. Looks like it’s spending a bunch of time in gegl_init(). Surely we don’t need GEGL to provide search results (which come from tracker anyway), so make a quick patch to defer that until the first window is created. That generally won’t happen when just doing Shell queries, so it disappears from profiles now.

Calculator

Rarely do I have gnome-calculator actually running when performing a Shell search despite using it a lot. That means it too needs to be spawned to perform the search.

It’s already doing the right thing in having a dedicated gnome-calculator-search-provider binary that is separate from the application (so you can reduce start-up time and memory usage) so why is it showing up on profiles? Looks like it’s initializing GTK even though that isn’t used at all in providing search results. Probably a vestige of yesteryear.

Easy fix by just removing gtk_init(). Save time connecting to the display server, setting up seats, icon themes, and most importantly, parsing unused CSS.

Another couple percent saved.

Measure, Measure, Measure

Anyway, in conclusion, I might leave you with this tidbit. Nobody gets code right on the first try, especially me. If you don’t take a look and observe it, my guess is that it looks a lot different at run-time than it does in your head.

Sysprof is my attempt to make that a painless process.

Writing Fast Search

The problem we encountered in my last writing was that gnome-clocks was taking about 300 milliseconds to complete a basic search query. I guess the idea is that if you type “paris” into GNOME Shell you’ll get the time in either Paris, France or one of the Paris’ in the United States. I guess 300 milliseconds wouldn’t be so bad if it didn’t also consume 100% of the CPU during that time.

Thankfully in my career I’ve had plenty of opportunity to work with database search indexes. So I have some practical experience in making that stuff fast(er).

So this morning I put together a small search index which can be generated from the Locations.bin using the libgweather API. That search index contains the serialized document form and a series of trigrams for the GWeatherLocation textual representation. That search index is meant to be static and installed along side Locations.bin.

Then for search, you take your term list and generate another series of trigrams. The SearchIndex provides iterators for each of those trigrams to find documents which contain it. So if you line those up with a sorted document list you can create an O(n*m) worst case iterator across potentially matching documents. In practice you look at a very small subset of the corpus.

As you iterate through those, you do your full termlist matching as you would have previously. Except instead of looking at thousands of entries, you look at just a few.

Long story short, you can go from 100% CPU for 300 milliseconds repeatedly to about 10 milliseconds and it keeps getting faster the more you type.

Once again, without tools like Sysprof and distributions with courage to enable frame-pointers like GNOME OS and Fedora, finding this stuff can be quite nebulous.

How to use Sysprof (again)

Every once in a while I take a moment to test GNOME OS on physical hardware.

The experience today was quite a bit underwhelming. Fresh install, type a few characters into the search box, and things grind to a halt.

Being the system profiler author I am, where would I consider spending time to make this better? Here ya go, and please do help because I can make the tools but I need people like you to help go resolve them.

I had to build Sysprof from source quick on GNOME OS until new GNOME OS builds are out (soon).

$ sysprof-cli --session-bus --gnome-shell capture.syscap 
$ sysprof ./capture.syscap

An overview of time spent in various processes

Interesting, a couple systemd-coredump processes busy doing ztsd compression on Nautilus crashes (in search providers). Issue filed.

Next up, gnome-software clocking in at 23% CPU (and remember, we’re competing against multiple zstd compressors for CPU time) which is busy doing appstream search for Flatpaks. Seems a bit high for something which is pre-compiled into a binary format and mmap()d at runtime to reduce CPU and memory overhead. Issue filed.

A screenshot of gnome-clocks search provider busyin libgweather deserialization.

Next is gnome-clocks at a whopping 15% to show me the time in cities near to whatever I type which is obviously “Riga” given GUADEC. Again, that’s 15% while competing with multiple zstd so in reality it’d be even more. Appears to be busy in libgweather doing deserialization, but specifically in finding the nearest city to a lat/lon position. A quick look at the code shows that this is probably one of the most expensive operations you can do and it’s done for every object deserialized. Probably could use some flags to avoid that from a search provider. Issue filed.

A screenshot of gnome-characters search provider taking 10% of system time in filter_keywords

Lastly in our top-offenders list is gnome-characters search provider. It’s clocking in at roughly 10% of system time (again, would be more if not for zstd) filtering keywords and getting character names. Considering we’re only showing up to maybe 3 of these results that seems significantly high. Issue filed.

So I implore my readers to go and make things fast.

Additionally, to be a good citizen myself, I put together an MR that makes search in Characters much, much faster.

And some fixes to make libxmlb faster (Software) here and here.