After about 5 months of keeping myself very busy, GNOME Builder 43 is out!
This is the truly the largest release of Builder yet, with nearly every aspect of the application improved. It’s pretty neat to see all this come together after having spent the past couple years doing a lot more things outside of Builder like modernizing GTKs OpenGL renderer, writing the new macOS GDK backend, shipping a new Text Editor for GNOME, and somehow getting married during all that.
Modern and Expressive Theming
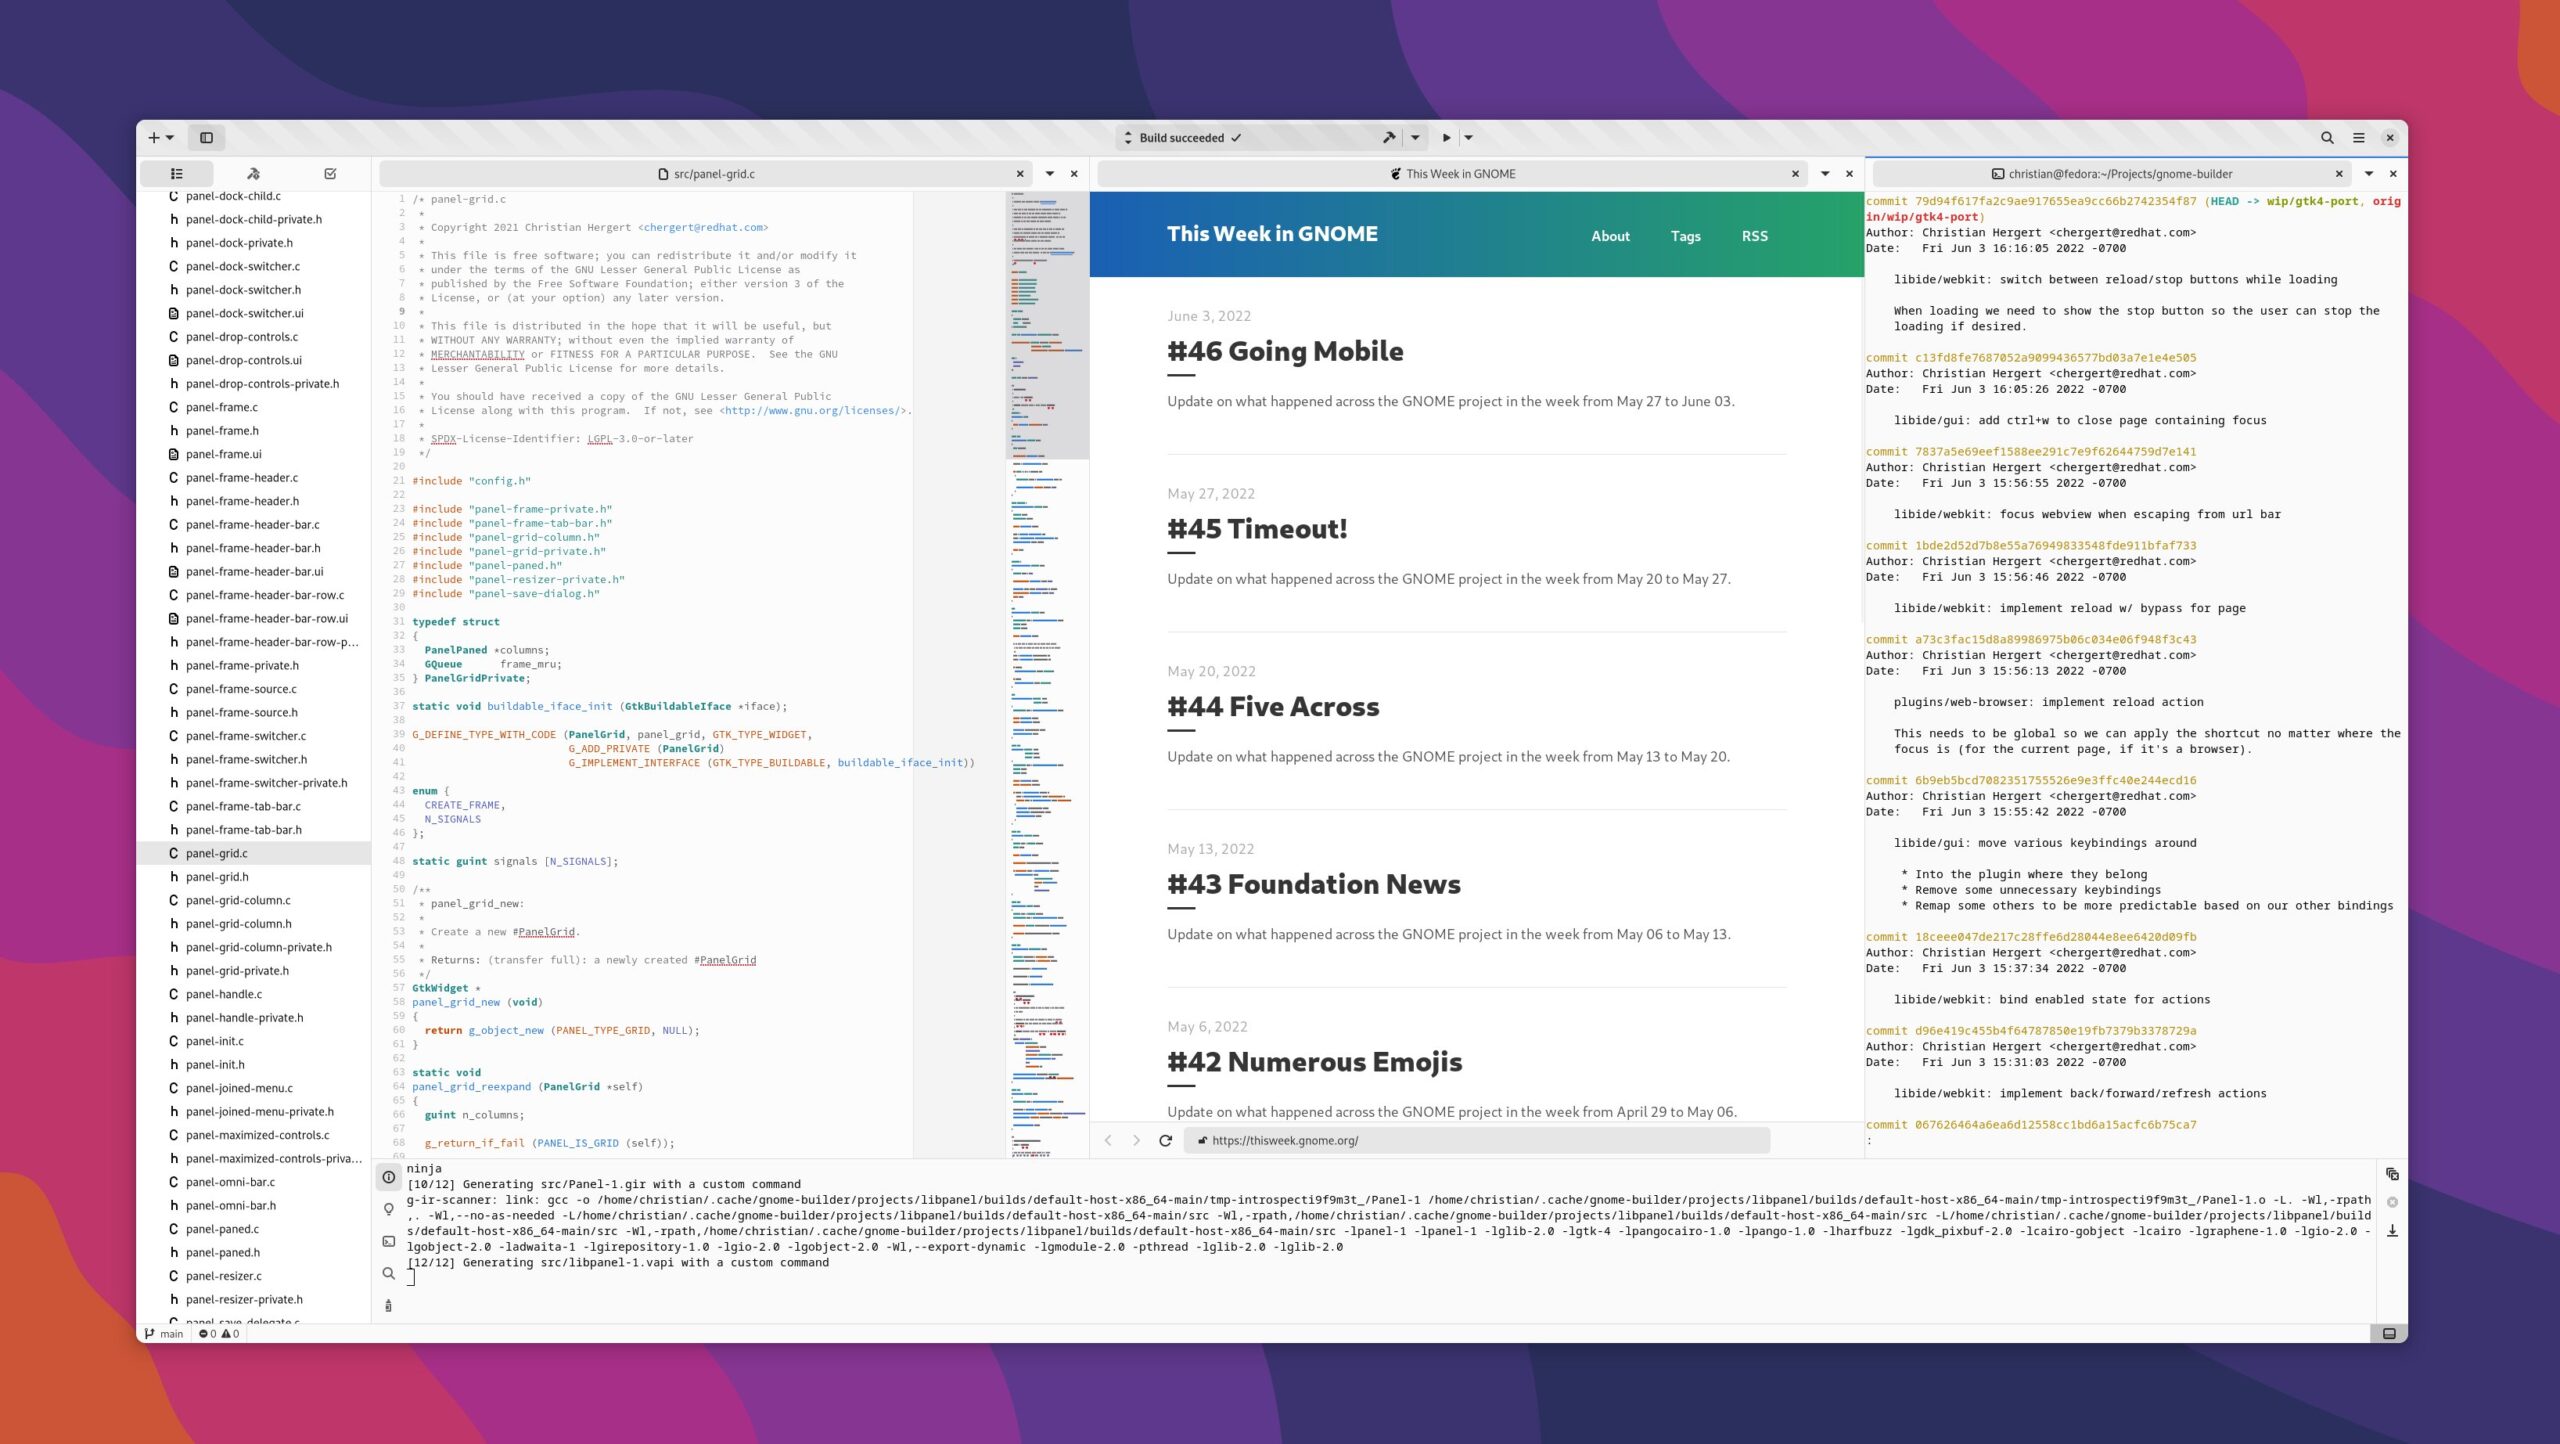
The most noticeable change, of course, is the port to GTK 4. Builder now uses WebKit, VTE, libadwaita, libpanel, GtkSourceView, and many other libraries recently updated to support GTK 4.
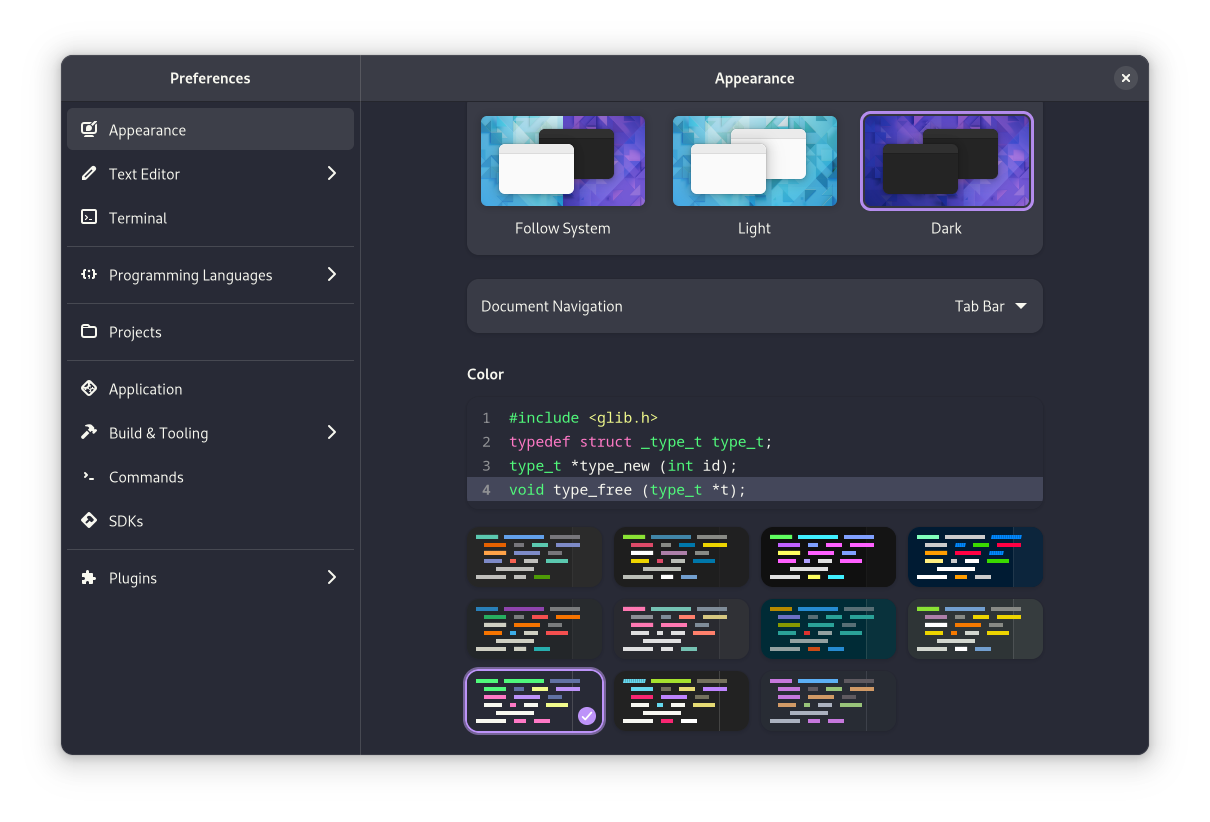
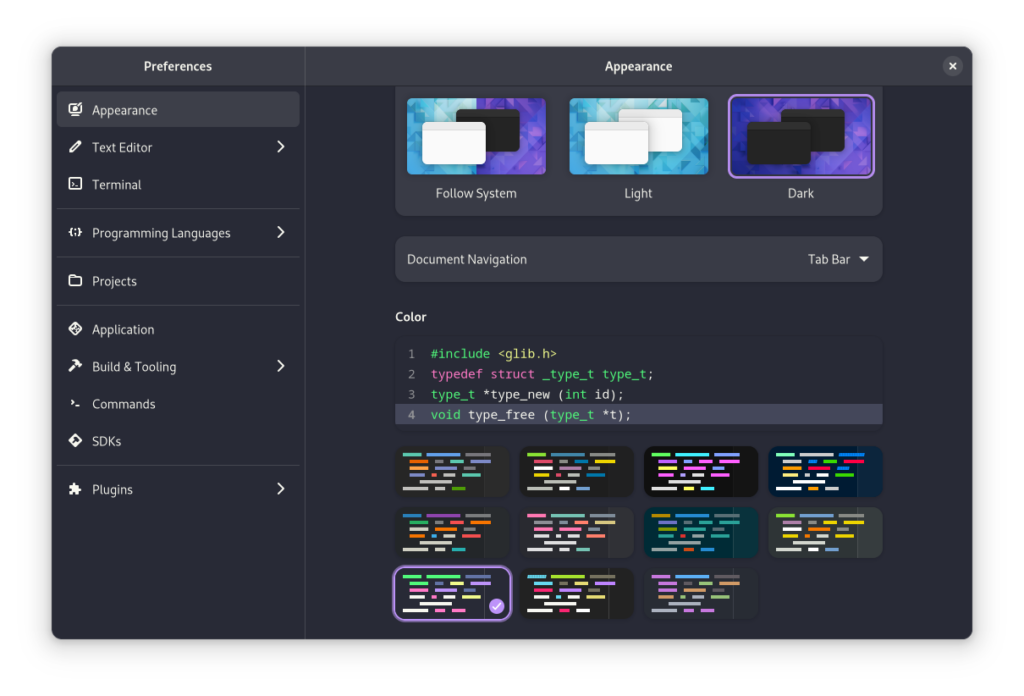
Like we did for GNOME Text Editor, Builder will restyle the application window based on the syntax highlighting scheme. In practice this feels much less jarring as you use the application for hours.
The Foundry
Behind the scenes, the “Foundry” behind Builder has been completely revamped to make better use of SDKs and runtimes. This gives precise control over how processes are created and run. Such control is important when doing development inside container technologies.
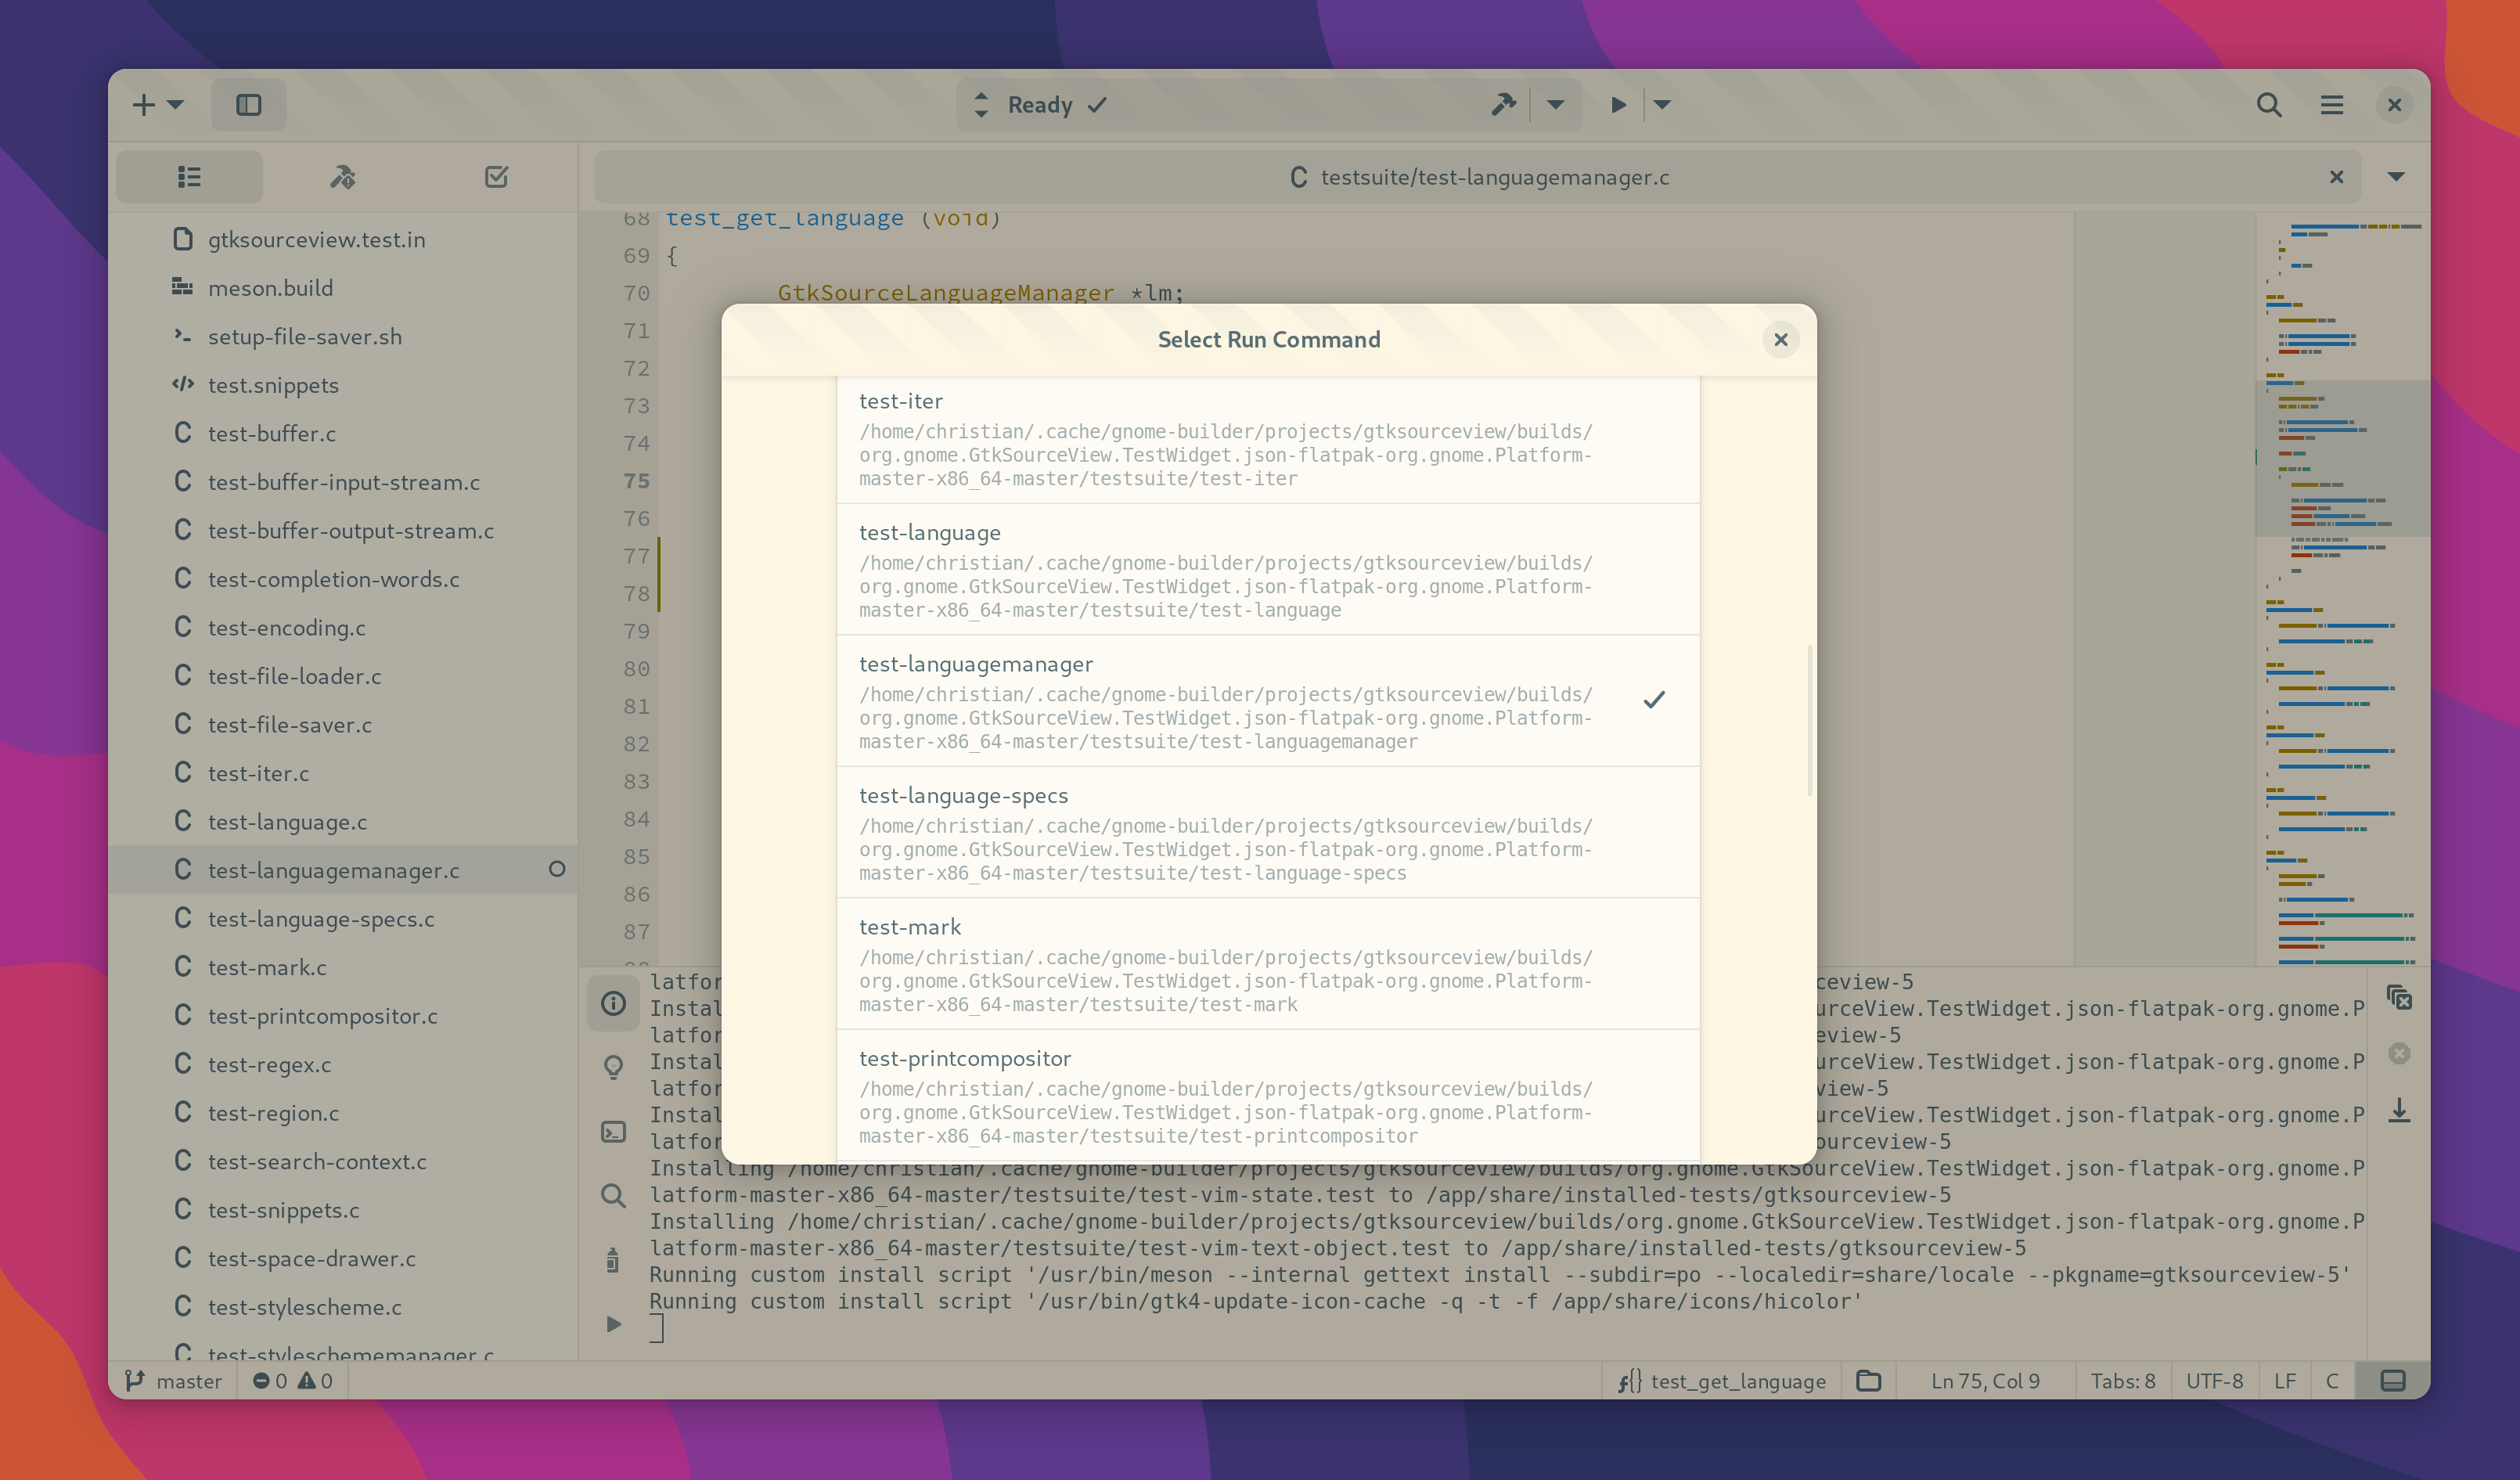
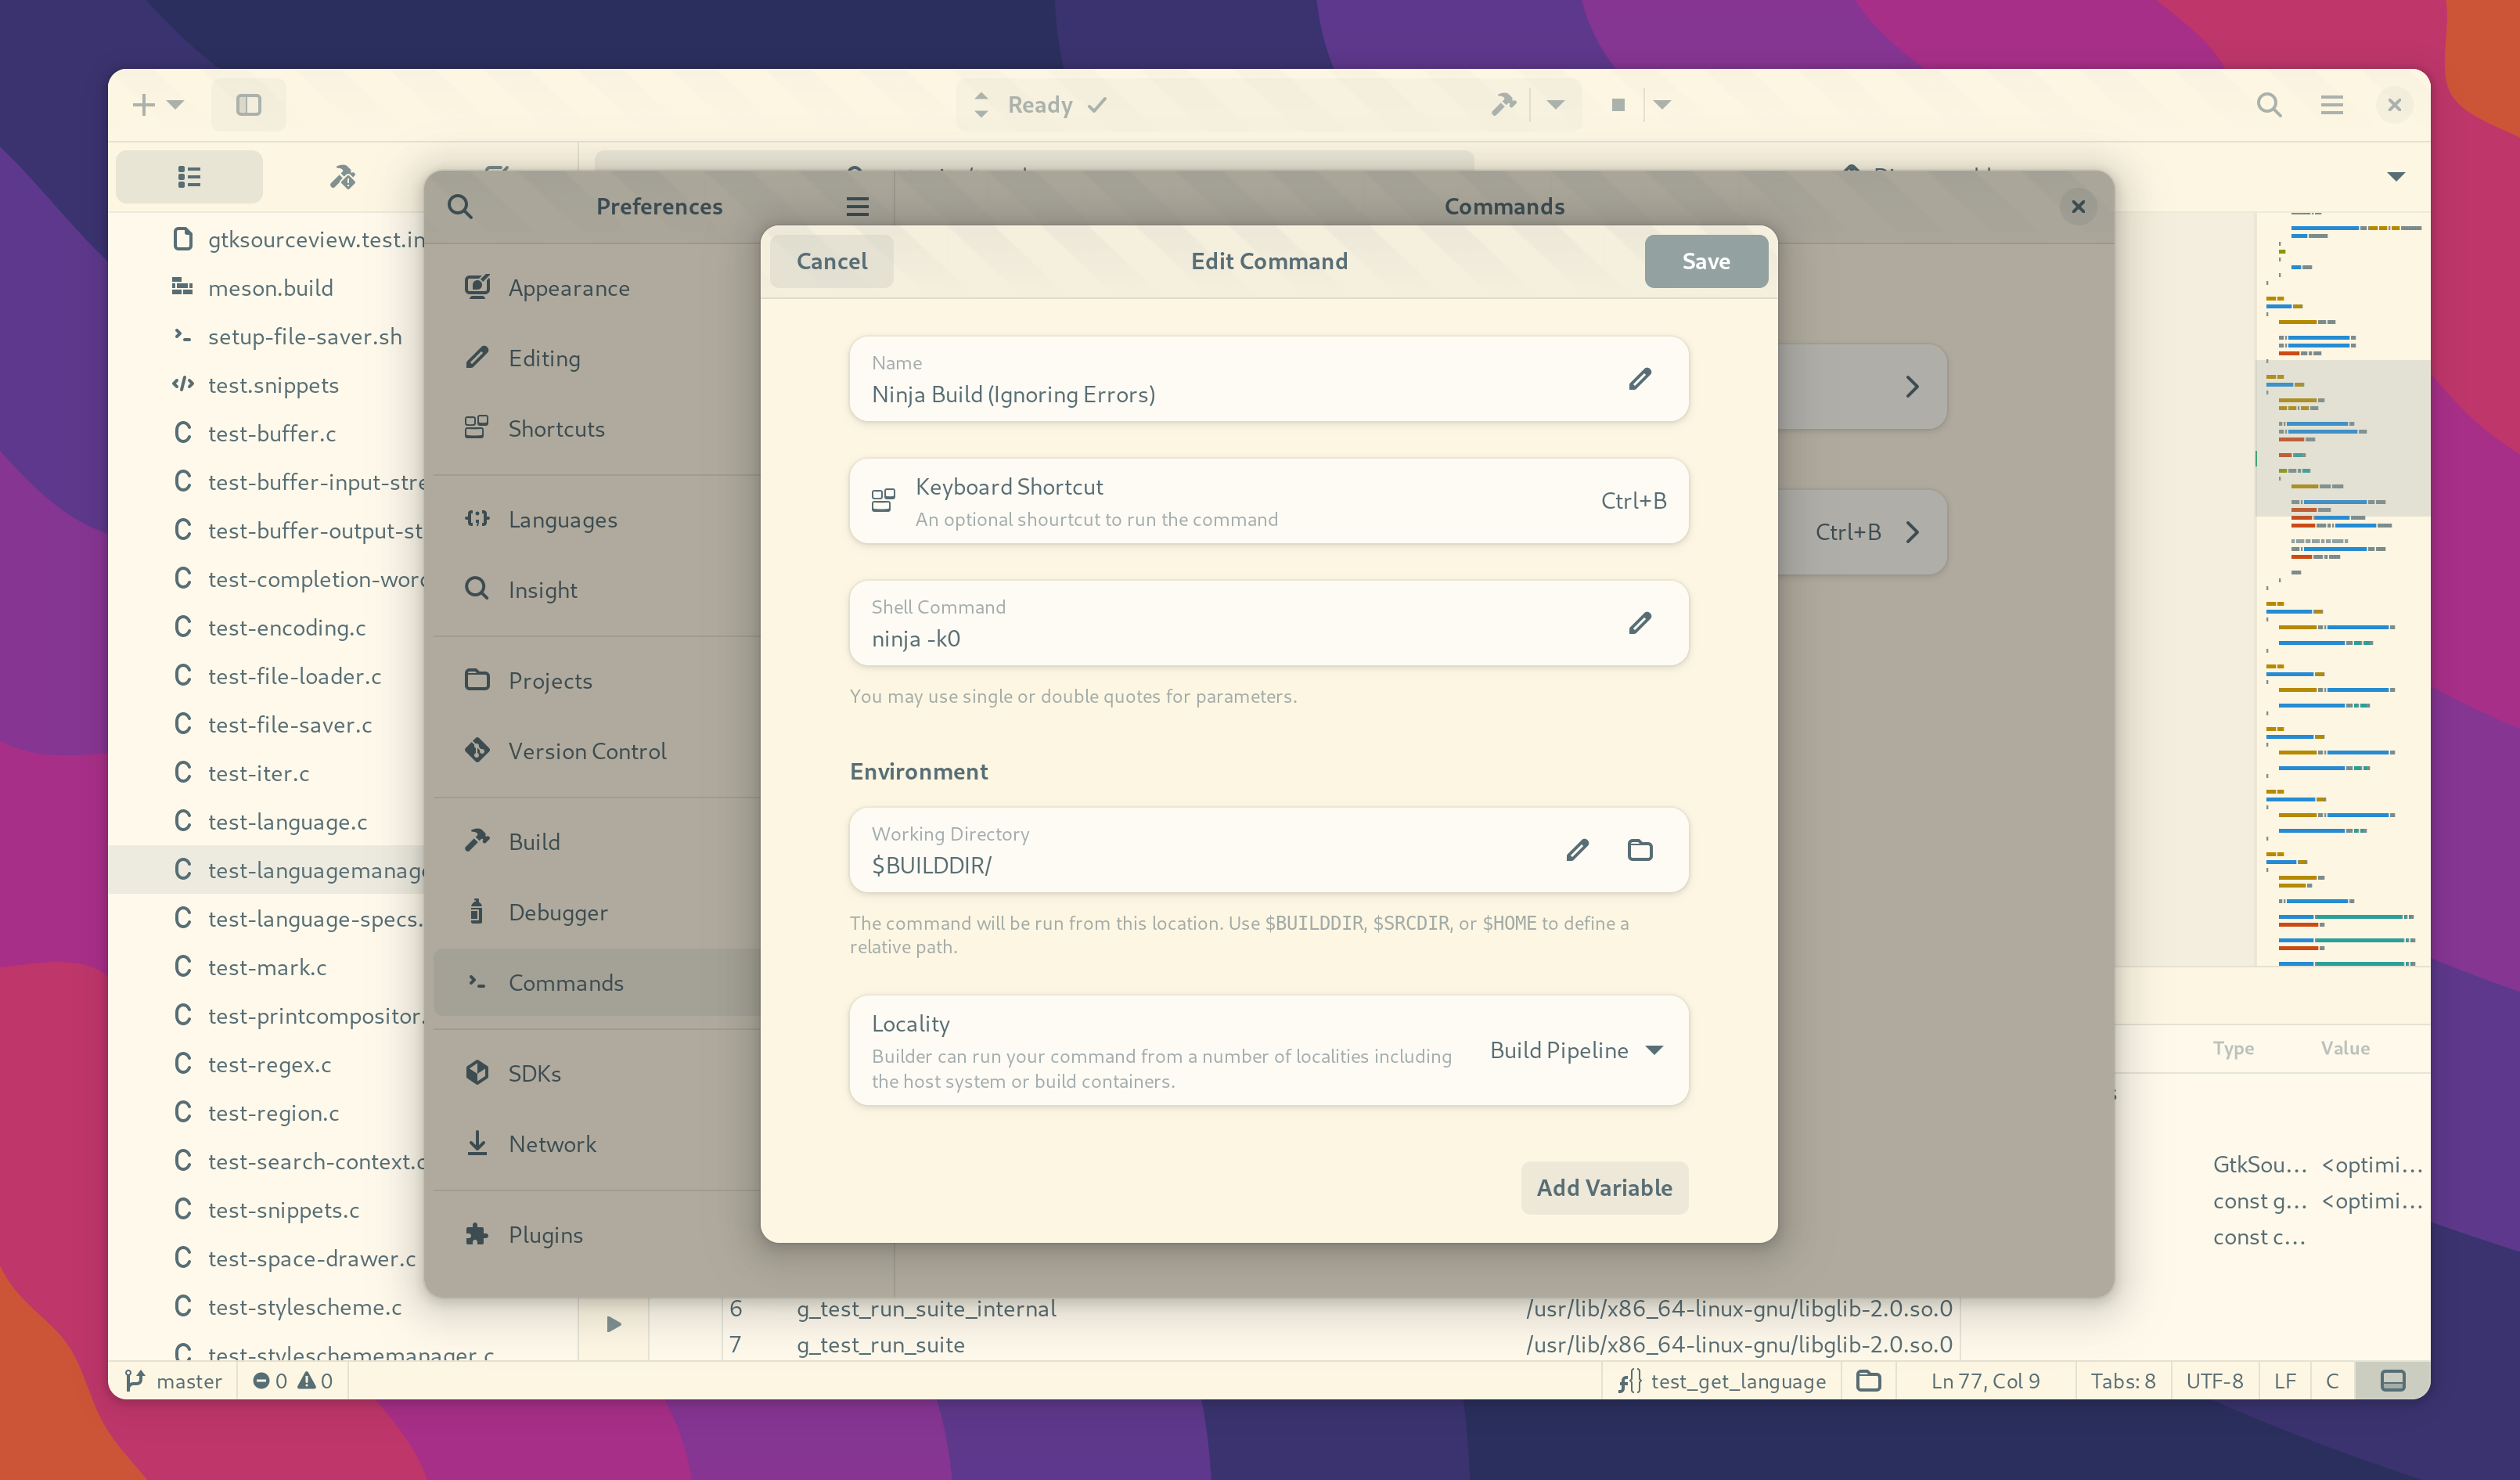
Users can now define custom “Commands” which are used to run your project and can be mapped to keyboard shortcuts. This allows for the use of Builder in situations where it traditionally fell short. For example, you can open a project without a build system and use commands to emulate a build system.
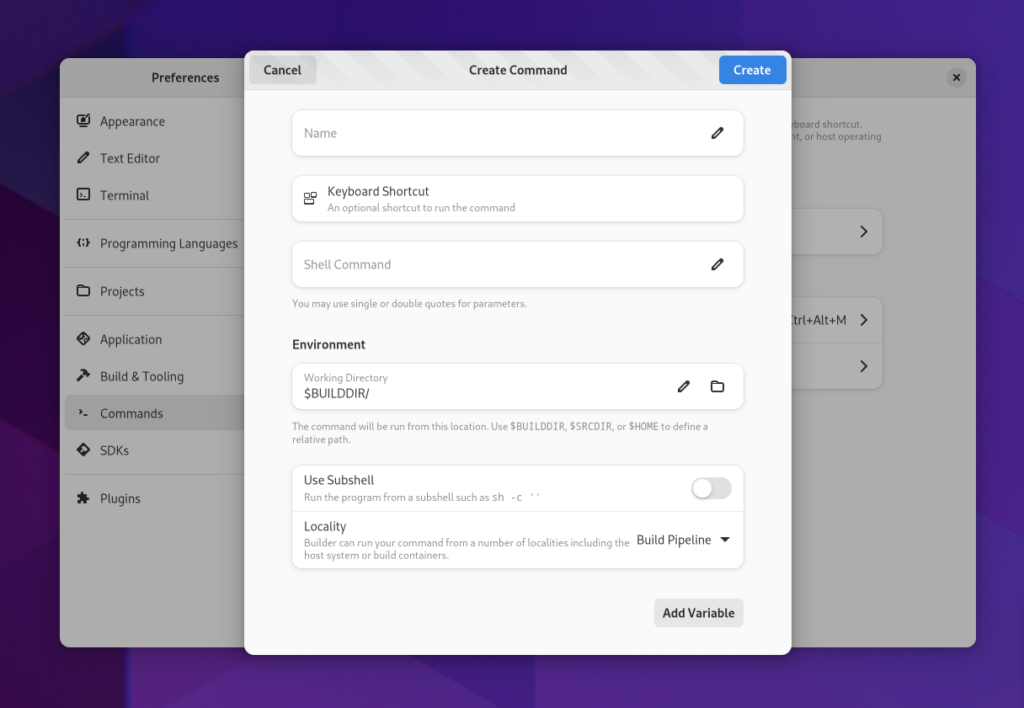
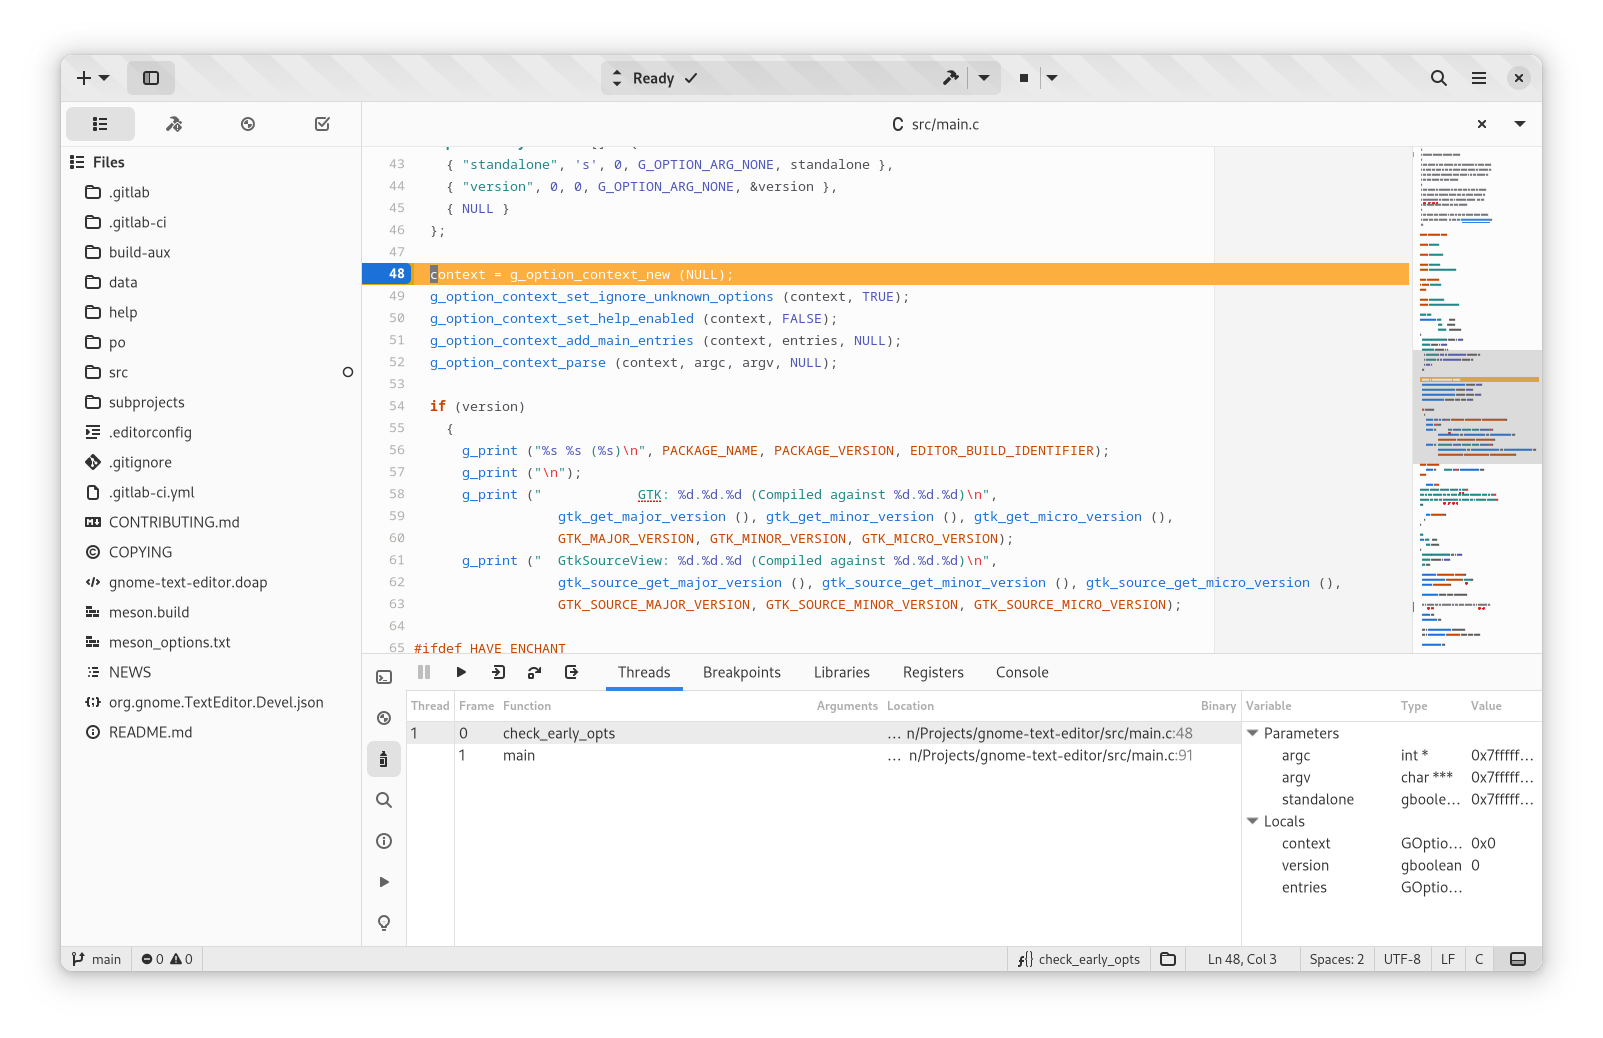
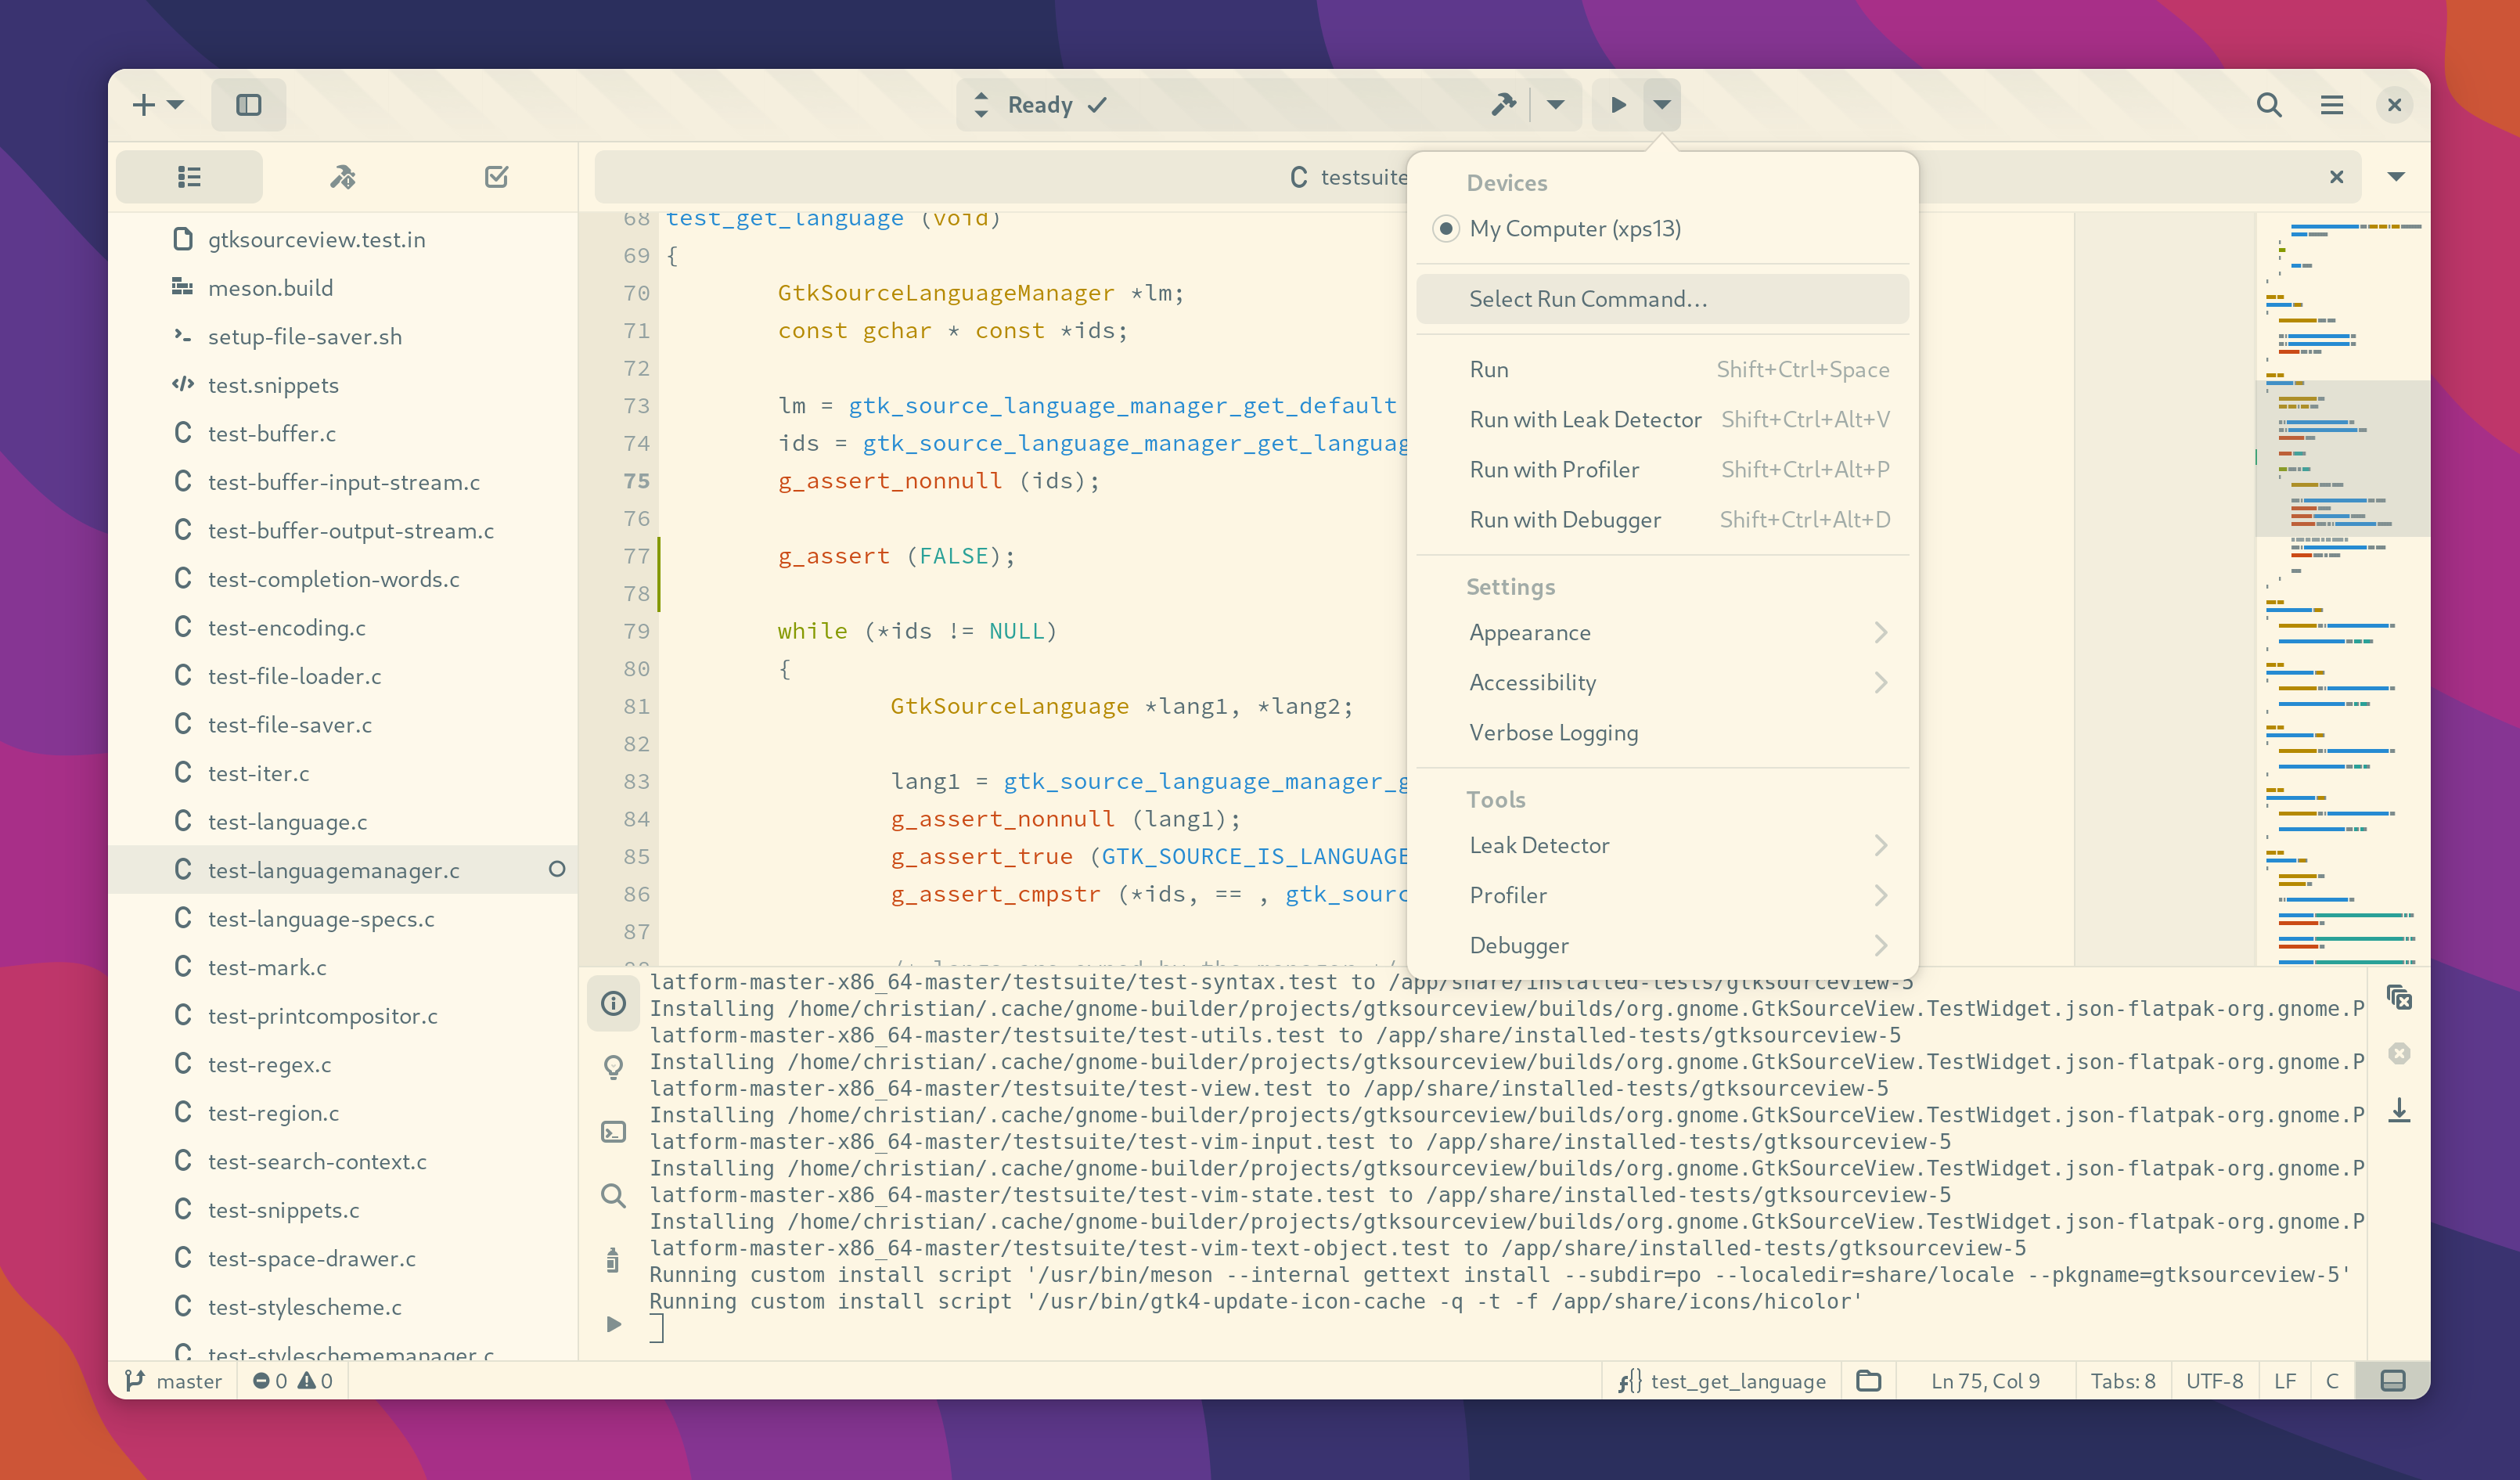
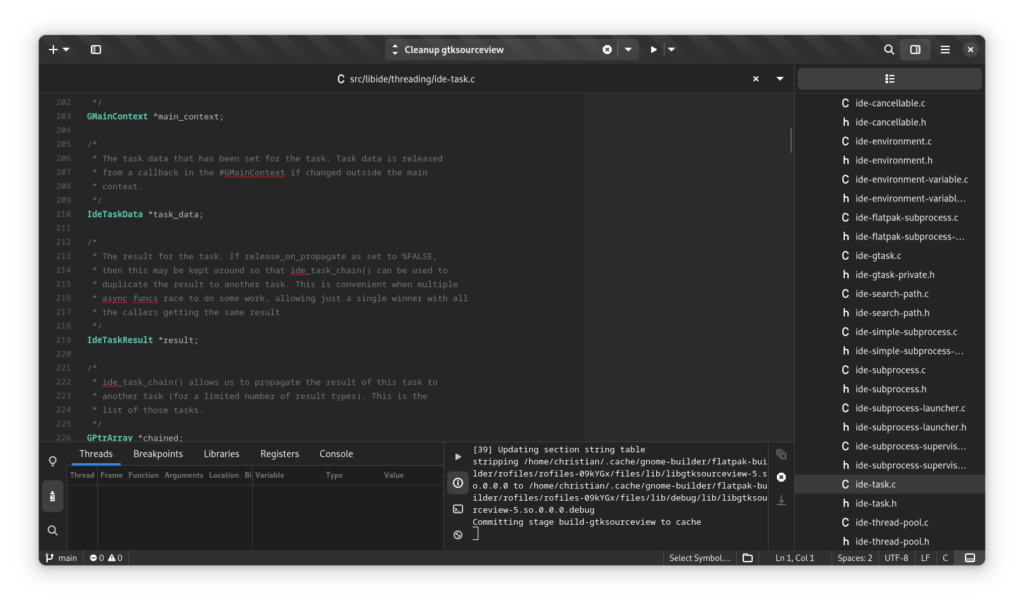
Furthermore, those commands can be used to run your application and integrate with tooling such as the GNU debugger, Valgrind, Sysprof, and more. Controlling how the debugger was spawned has been a long requested feature by users.

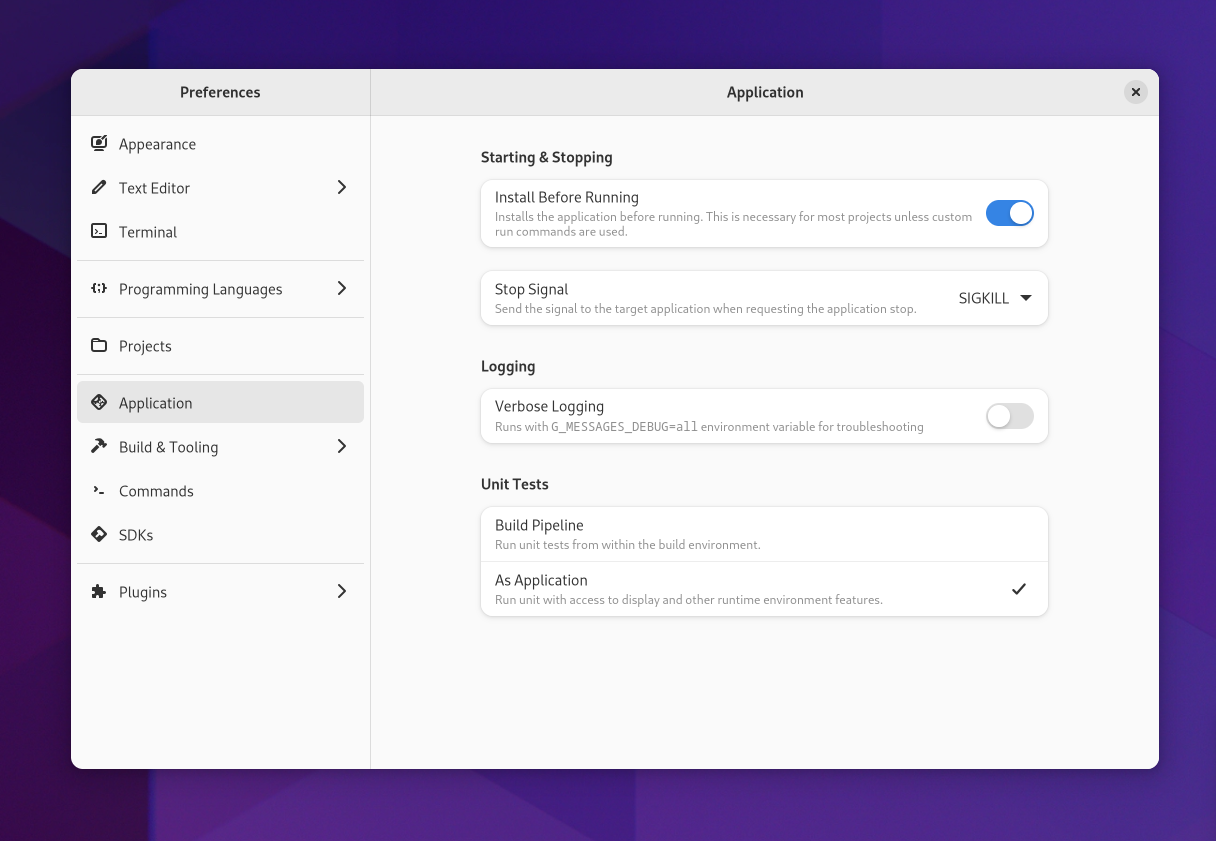
You can control what signal is sent to stop your application. I suspect that will be useful for tooling that does cleanup on signals like SIGHUP. It took some work but this is even plugged into “run tools” so things like Sysprof can deliver the signal to the right process.
If you’re using custom run commands to build your project you can now toggle-off installation-before-run and likely still get what you want out of the application. This can be useful for very large projects where you’re working on a small section and want to cheat a little bit.
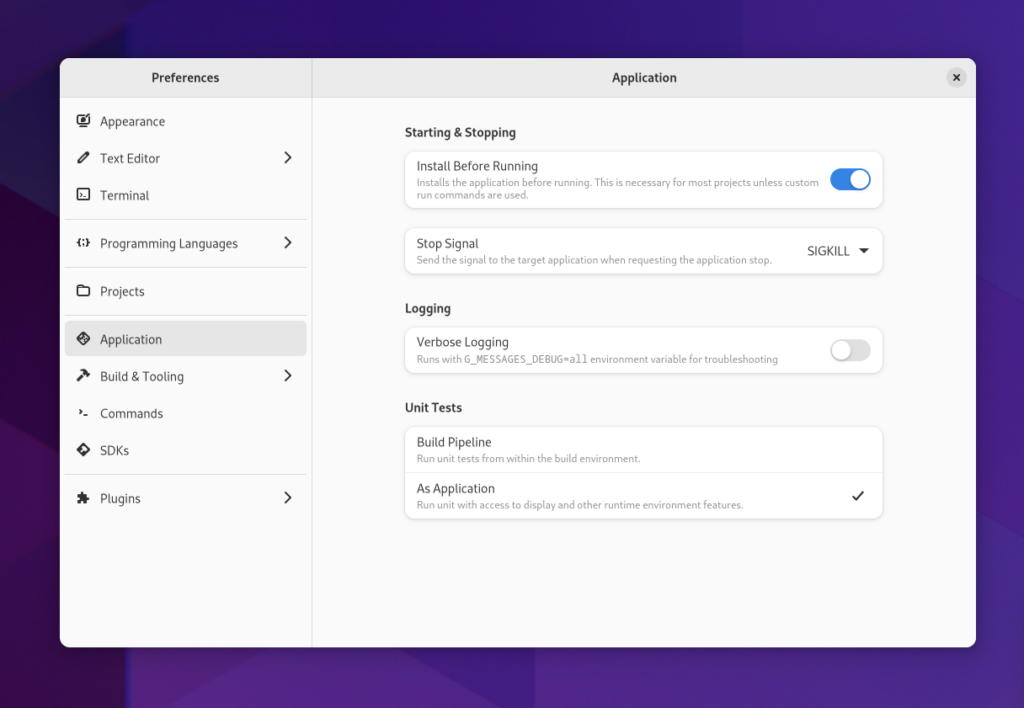
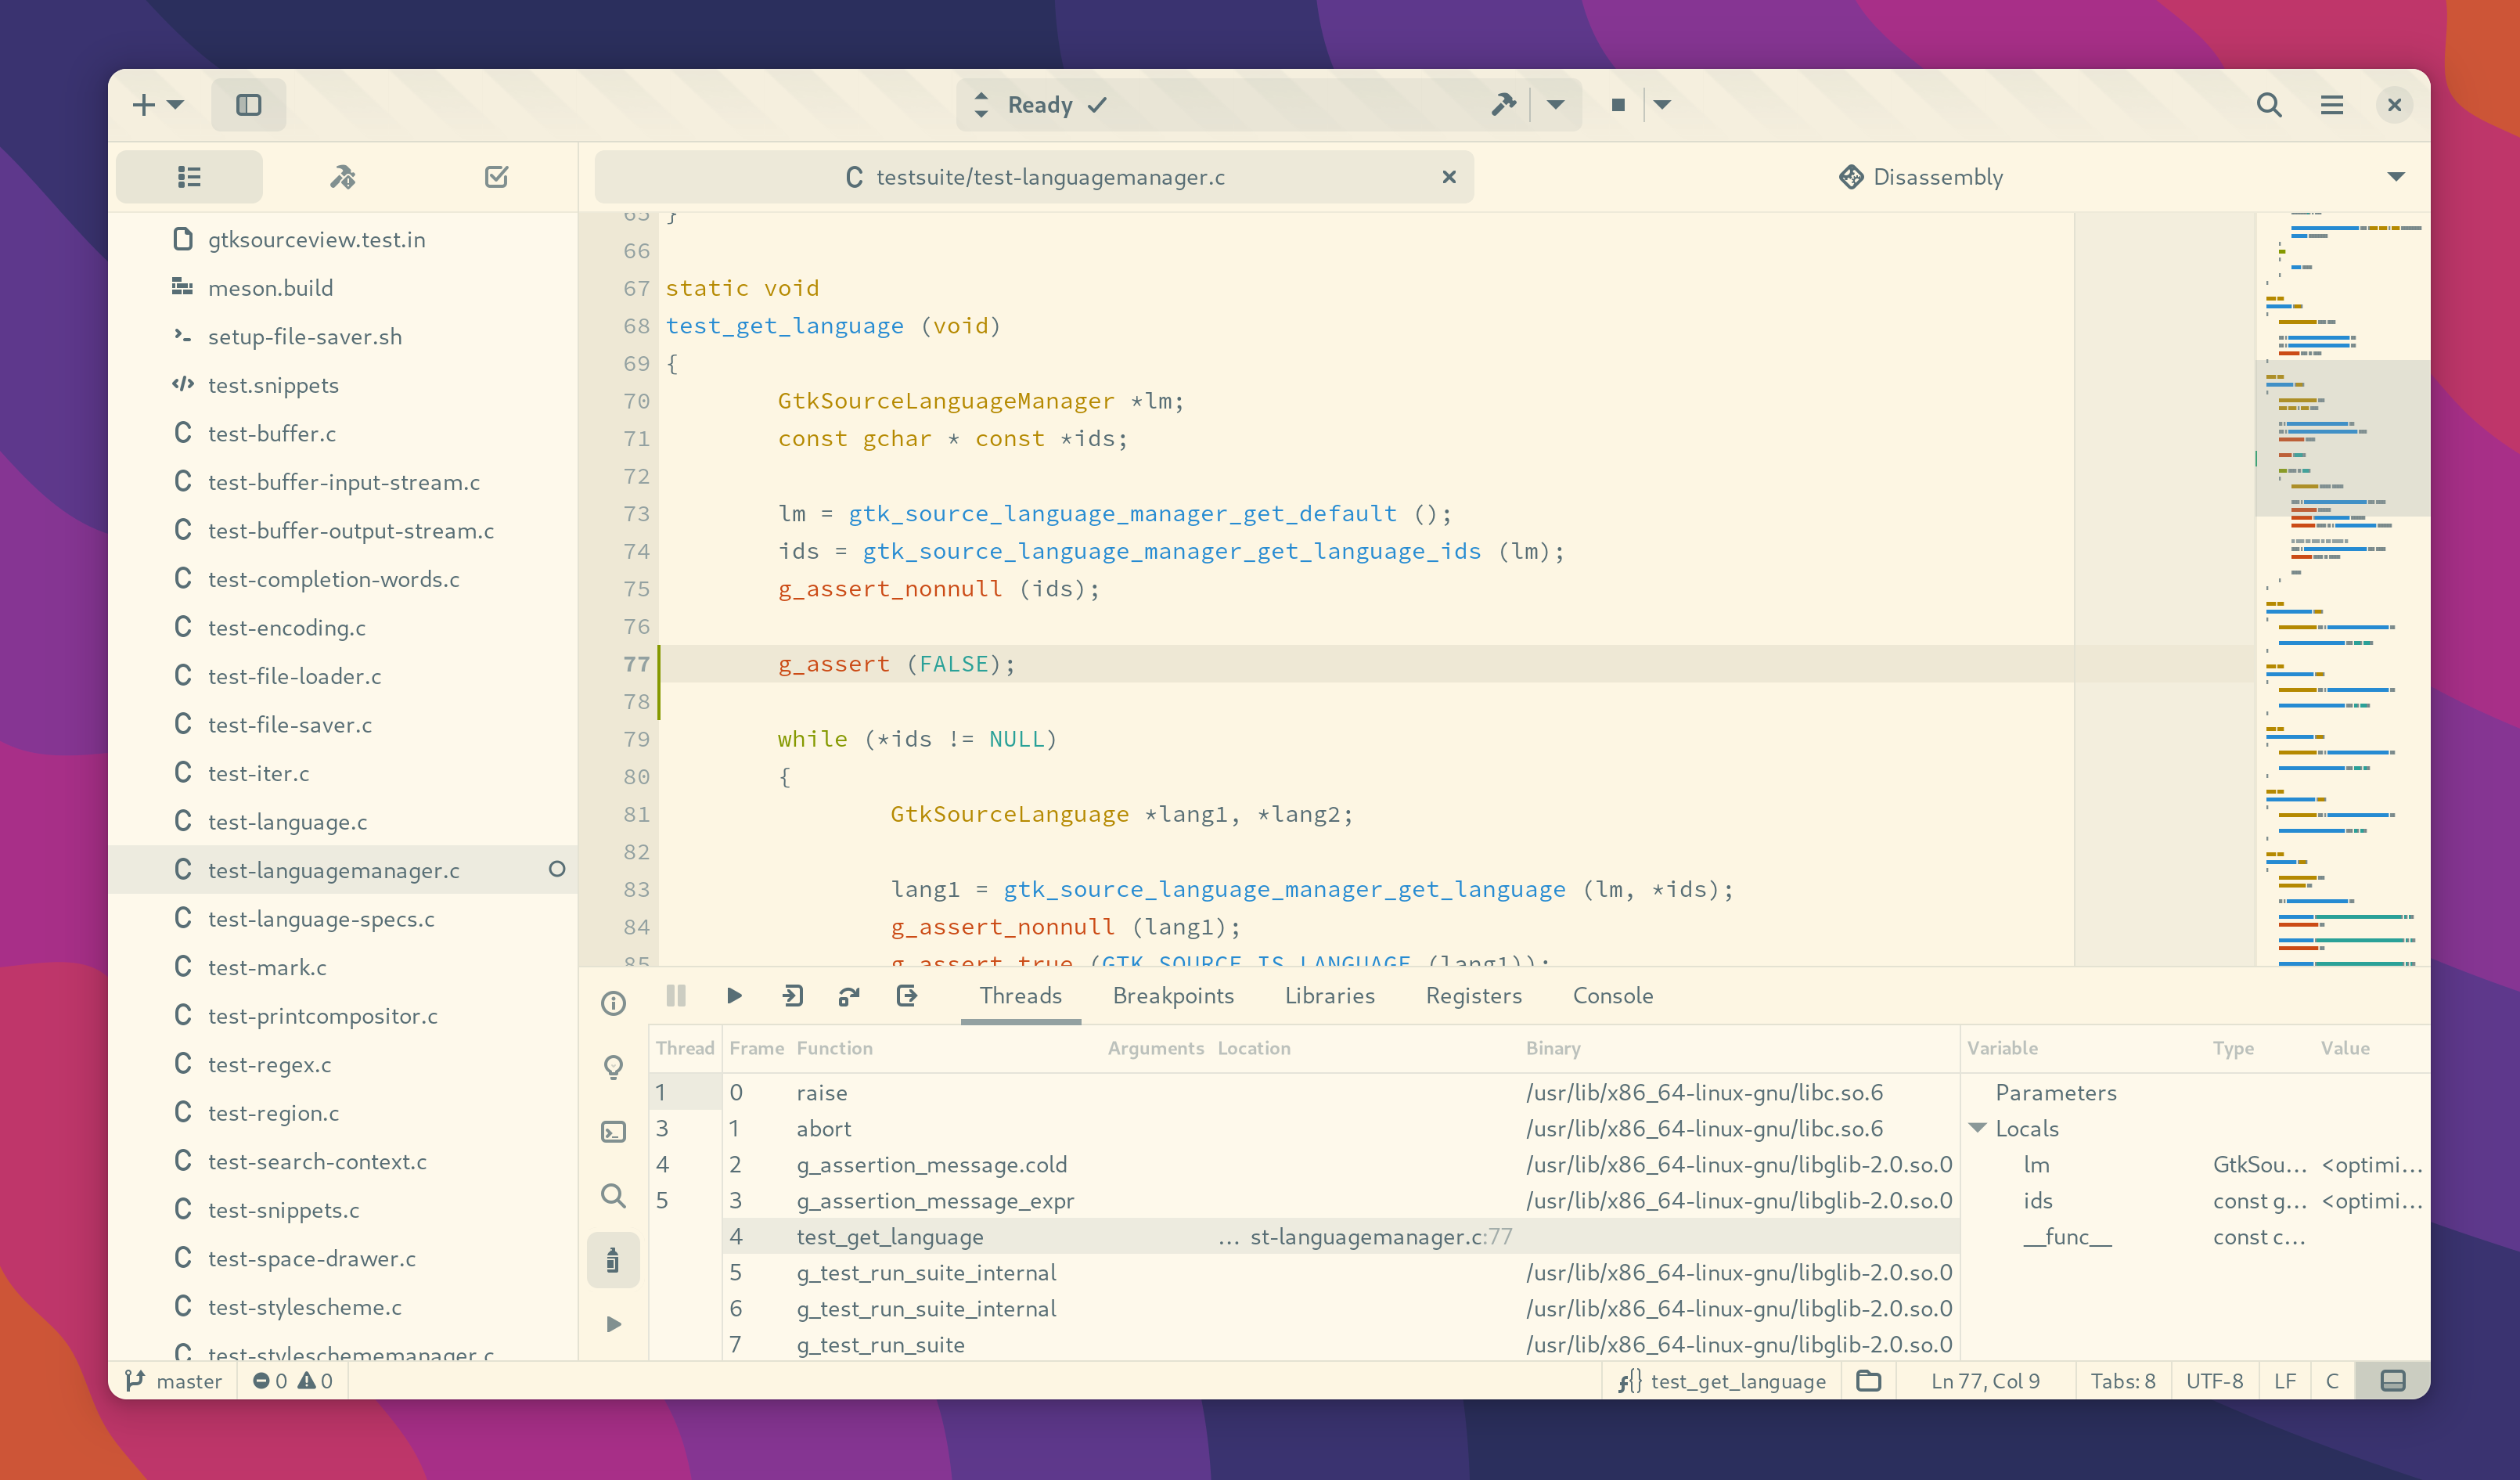
Unit Testing
In previous version of Builder, plugins were responsible for how Unit Tests were run. Now, they also use Run Commands which allows users to run their Unit Tests with the debugger or other tooling.
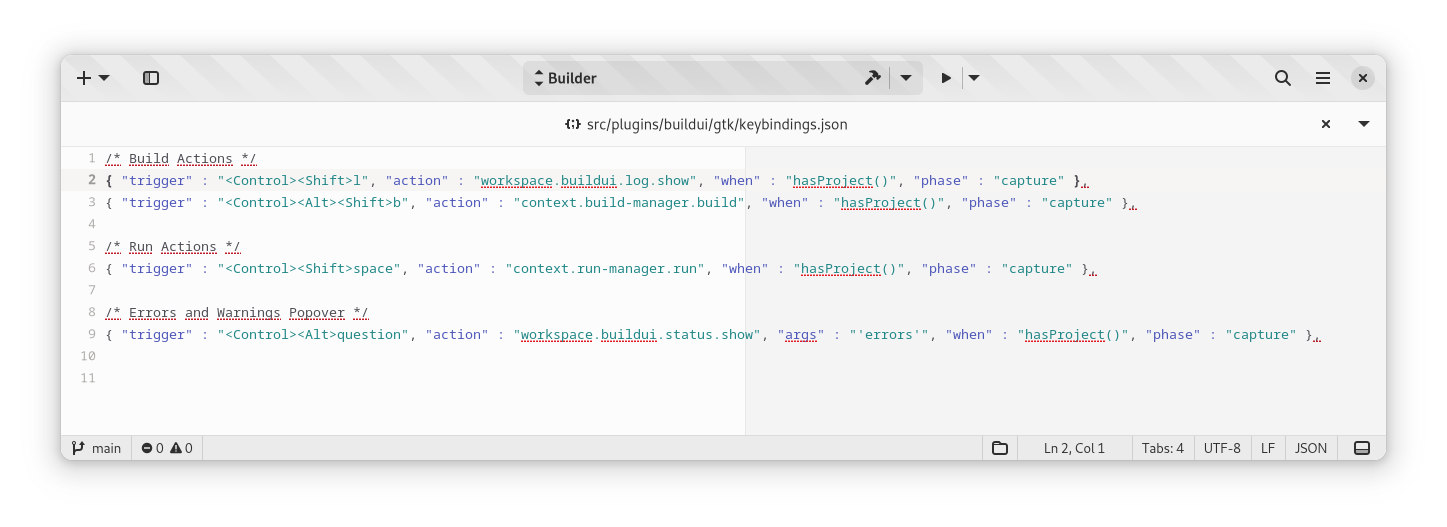
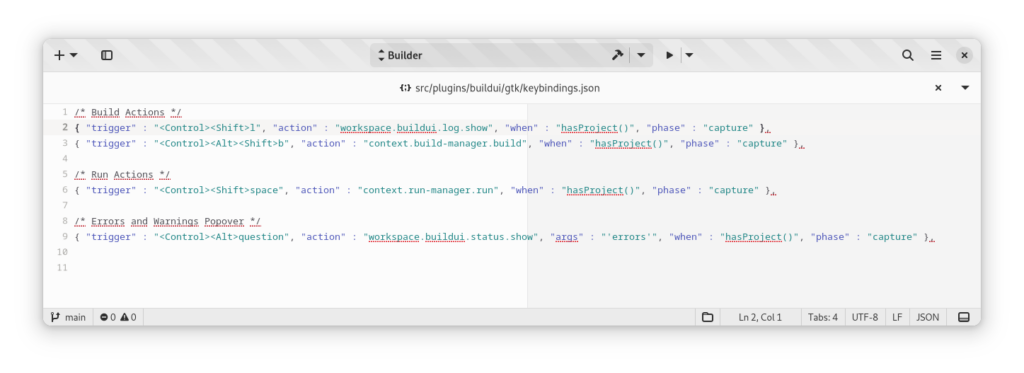
Keyboard Shortcuts
Keyboard shortcuts were always a sore spot in GTK 3. With the move to GTK 4 we redesigned the whole system to give incredible control to users and plugin authors. Similar to VS Code, Builder has gained support for a format similar to “keybindings.json” which allows for embedding GObject Introspection API scripting. The syntax matches the template engine in Builder which can also call into GObject Introspection.
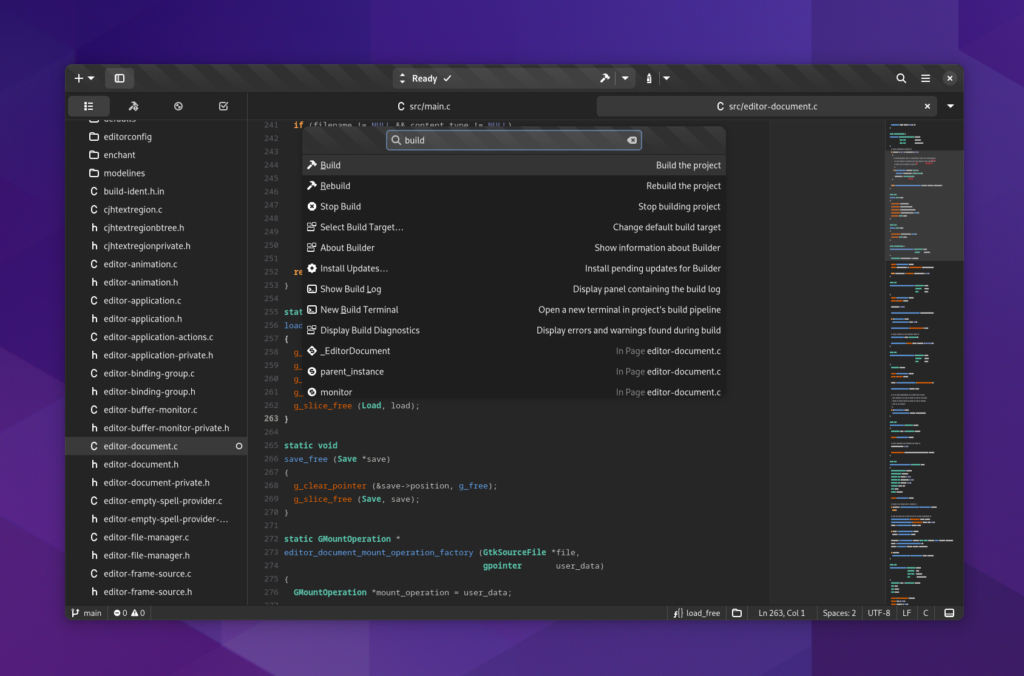
Command Bar and Project Search
We’ve unified the Command Bar and Project Search into one feature. Use Ctrl+Enter to display the new Global Search popover.
We do expect this feature to be improved and expanded upon in upcoming releases as some features necessary are still to land within a future GTK release.
Movable Panels and Sessions
Panels can be dragged around the workspace window and placed according to user desire. The panel position will persist across future openings of the project.
Additionally, Builder will try to save the state of various pages including editors, terminals, web browsers, directory listings, and more. When you re-open your project with Builder, you can expect to get back reasonably close to where you left off.
Closing the primary workspace will now close the project. That means that the state of secondary workspaces (such as those created for an additional monitor) will be automatically saved and restored the next time the project is launched.
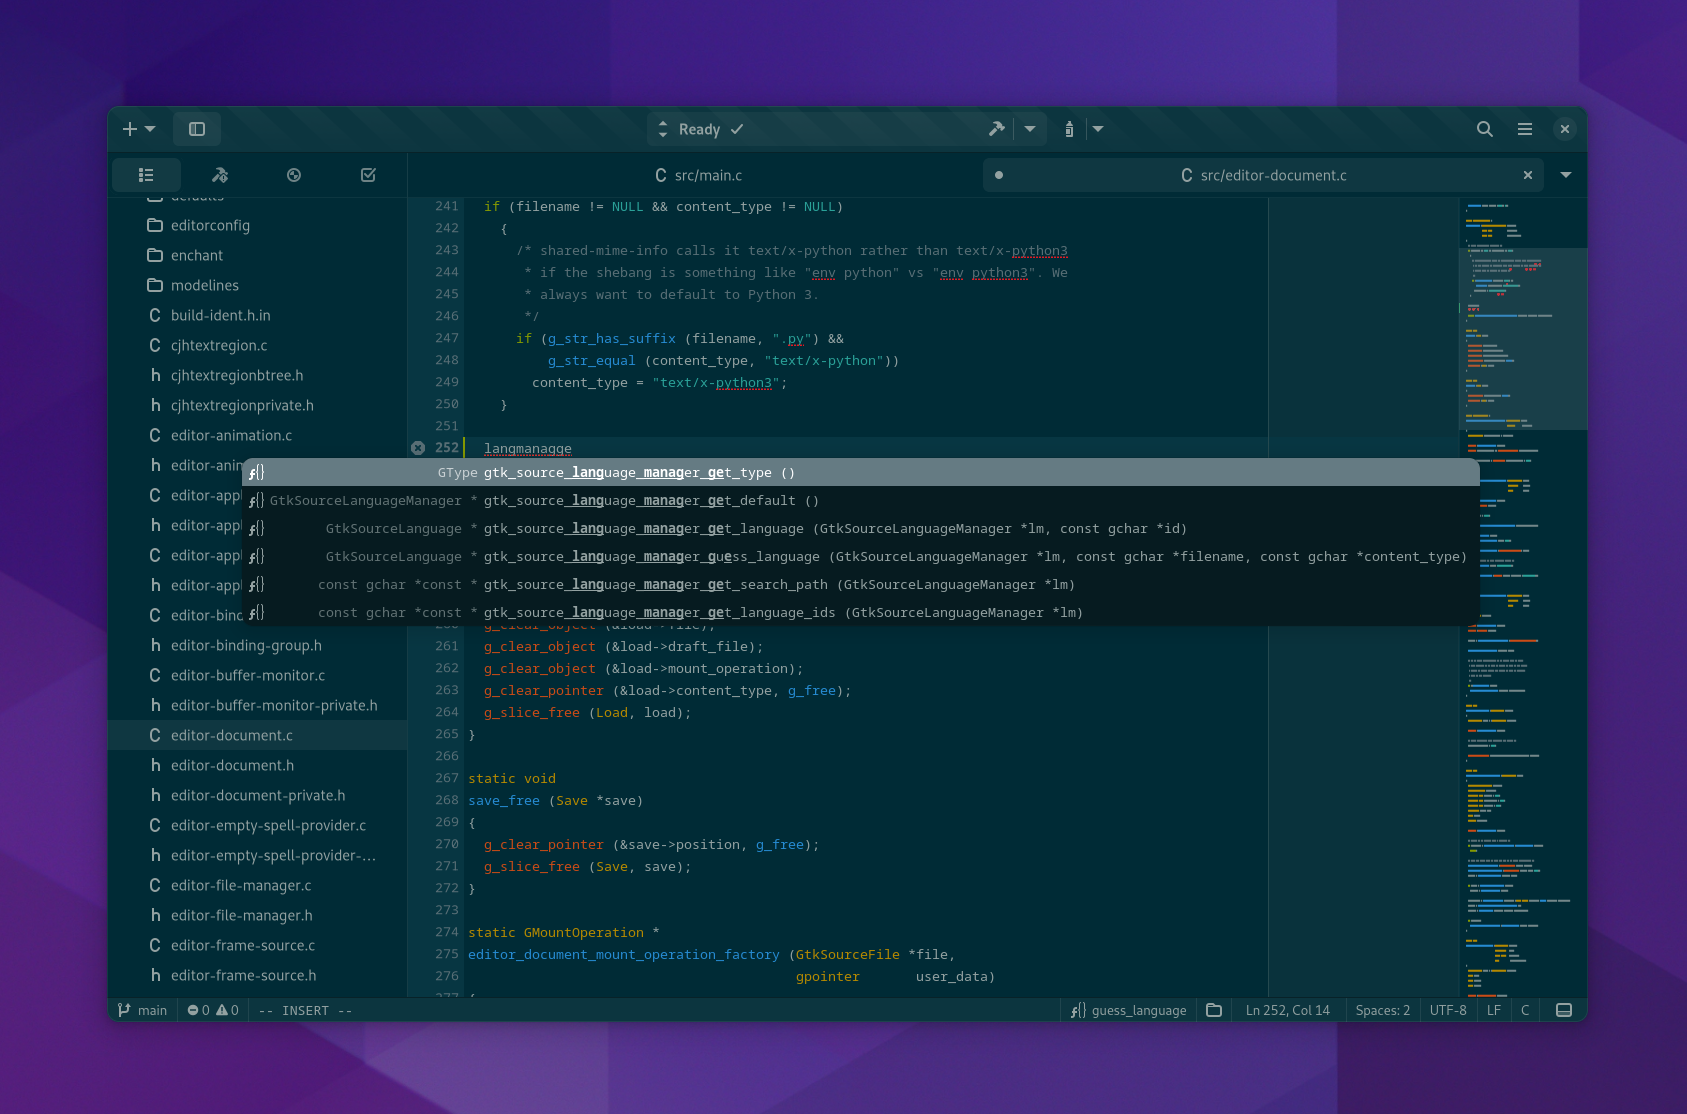
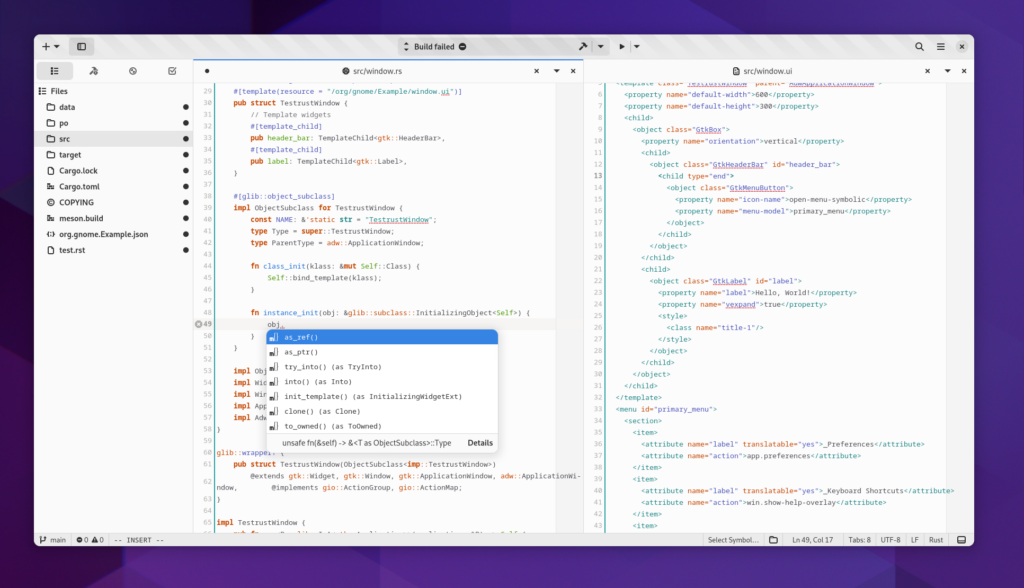
GtkSourceView
Core editing features have been polished considerably as part of my upstream work on maintaining GtkSourceView. Completion feels as smooth as ever. Interactive tooltips are polished and working nicely. Snippets too have been refined and performance improved greatly.
Not all of our semantic auto-indenters have been ported to GtkSourceIndenter, but we expect them (and more) to come back in time.
There is more work to be done here, particularly around hover providers and what can be placed in hover popovers with expectation that it will not break input/grabs.
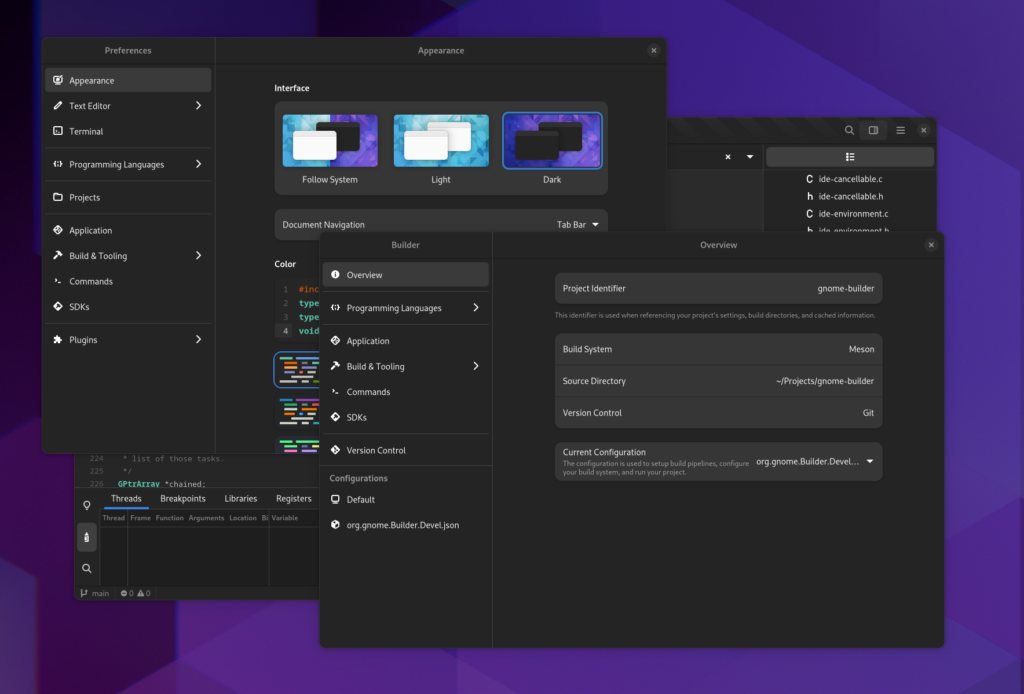
Redesigned Preferences
Preferences have been completely redesigned and integrated throughout Builder. Many settings can be tweaked at either the application-level as a default, or on a per-project basis. See “Configure Project” in the new “Build Menu” to see some of those settings. Many new settings were added to allow for more expressive control and others improved open.
Use Ctrl+, to open application preferences, and Alt+, to open your project’s preferences and configurations.
Document Navigation
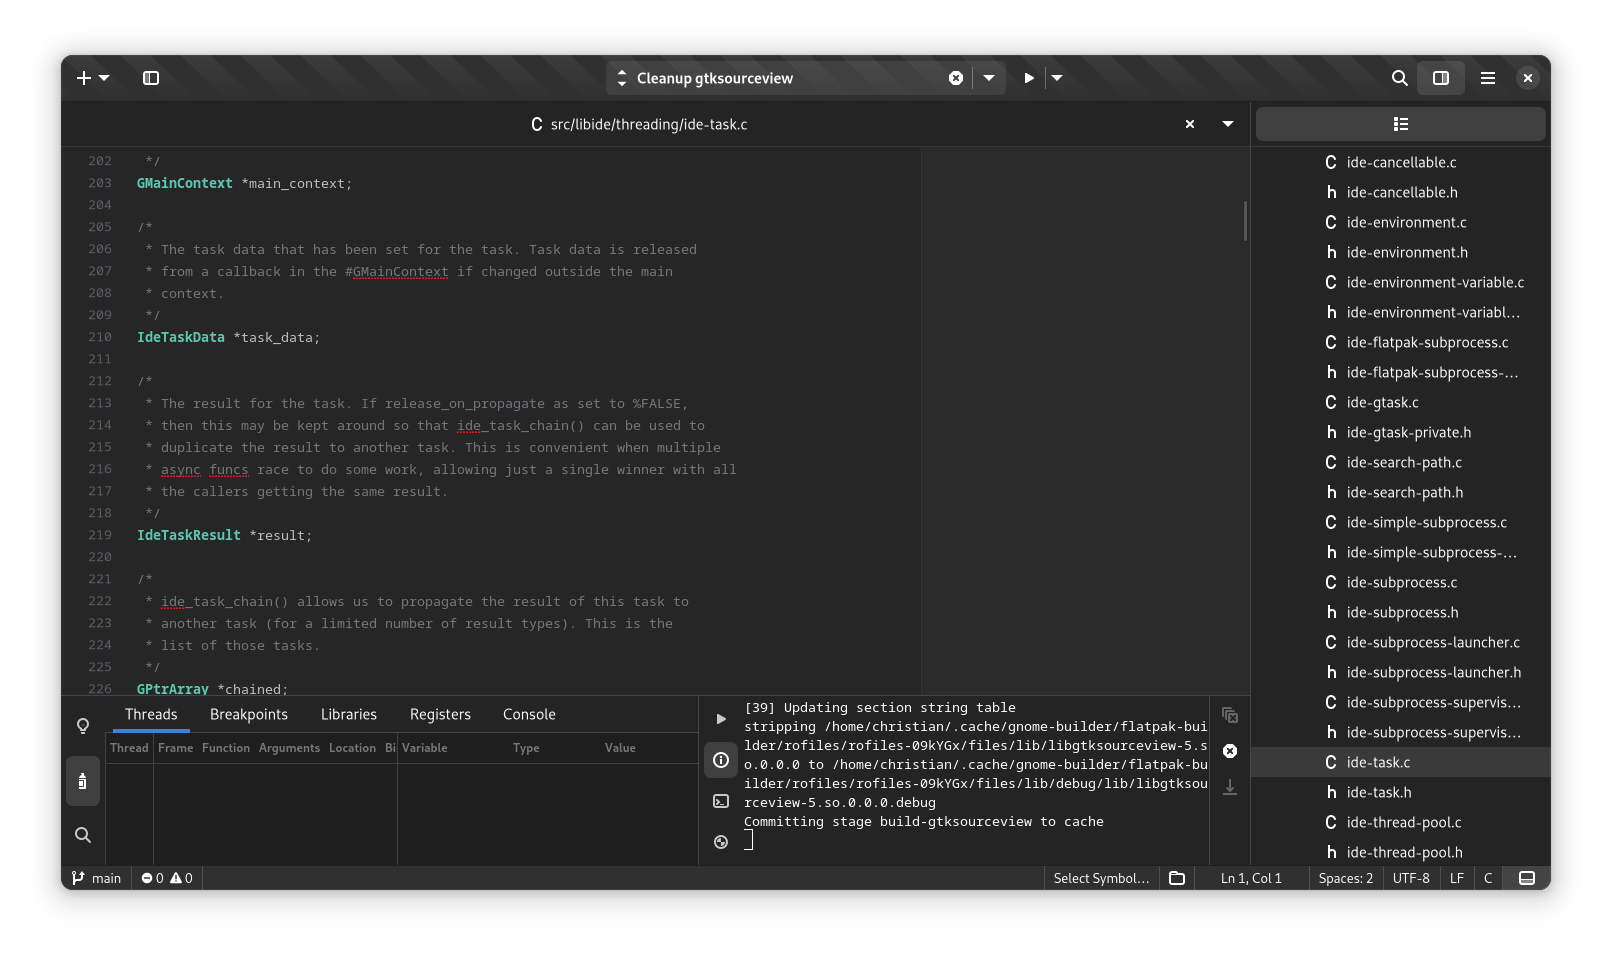
Since the early versions of Builder, users have requested tabs to navigate documents. Now that we’re on GTK 4 supporting that in a maintainable fashion is trivial and so you can choose between tabs or the legacy “drop down” selector. Navigation tabs are enabled by default.
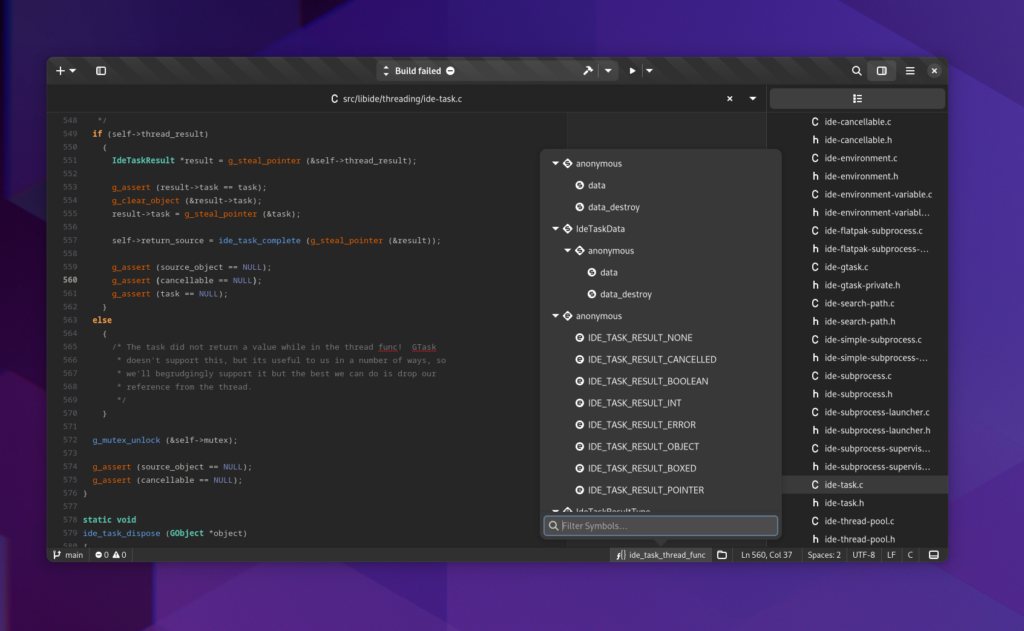
Some of the UI elements that were previously embedded in the document frame can be found in the new workspace statusbar on the bottom right. Additionally, controls for toggling indentation, syntax, and encoding have been added.
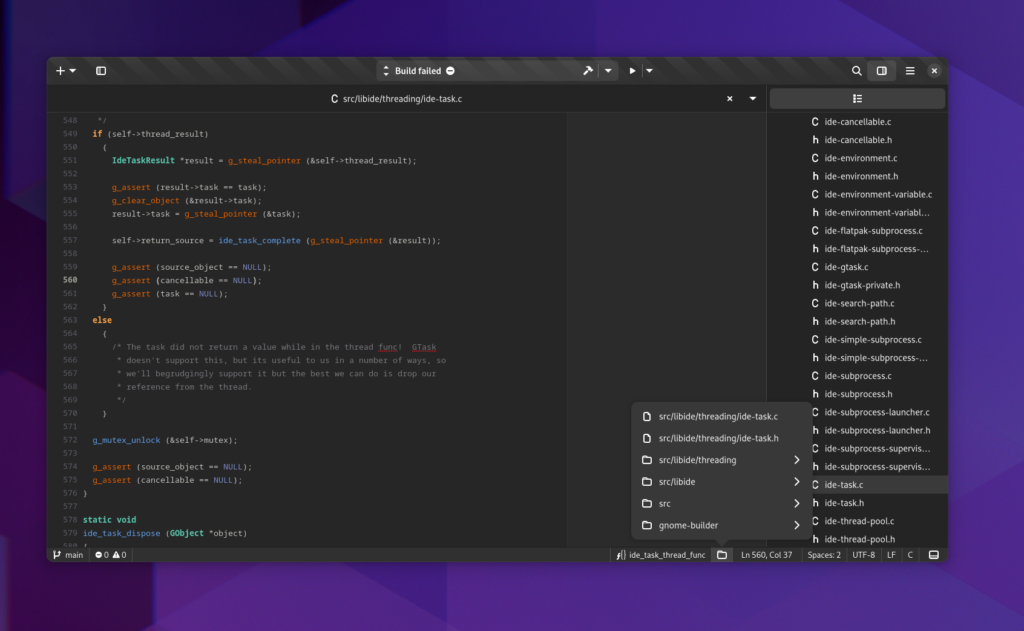
Switching between similar files is easy with Ctrl+Shift+O. You’ll be displayed a popover with similarly named files to the open document.
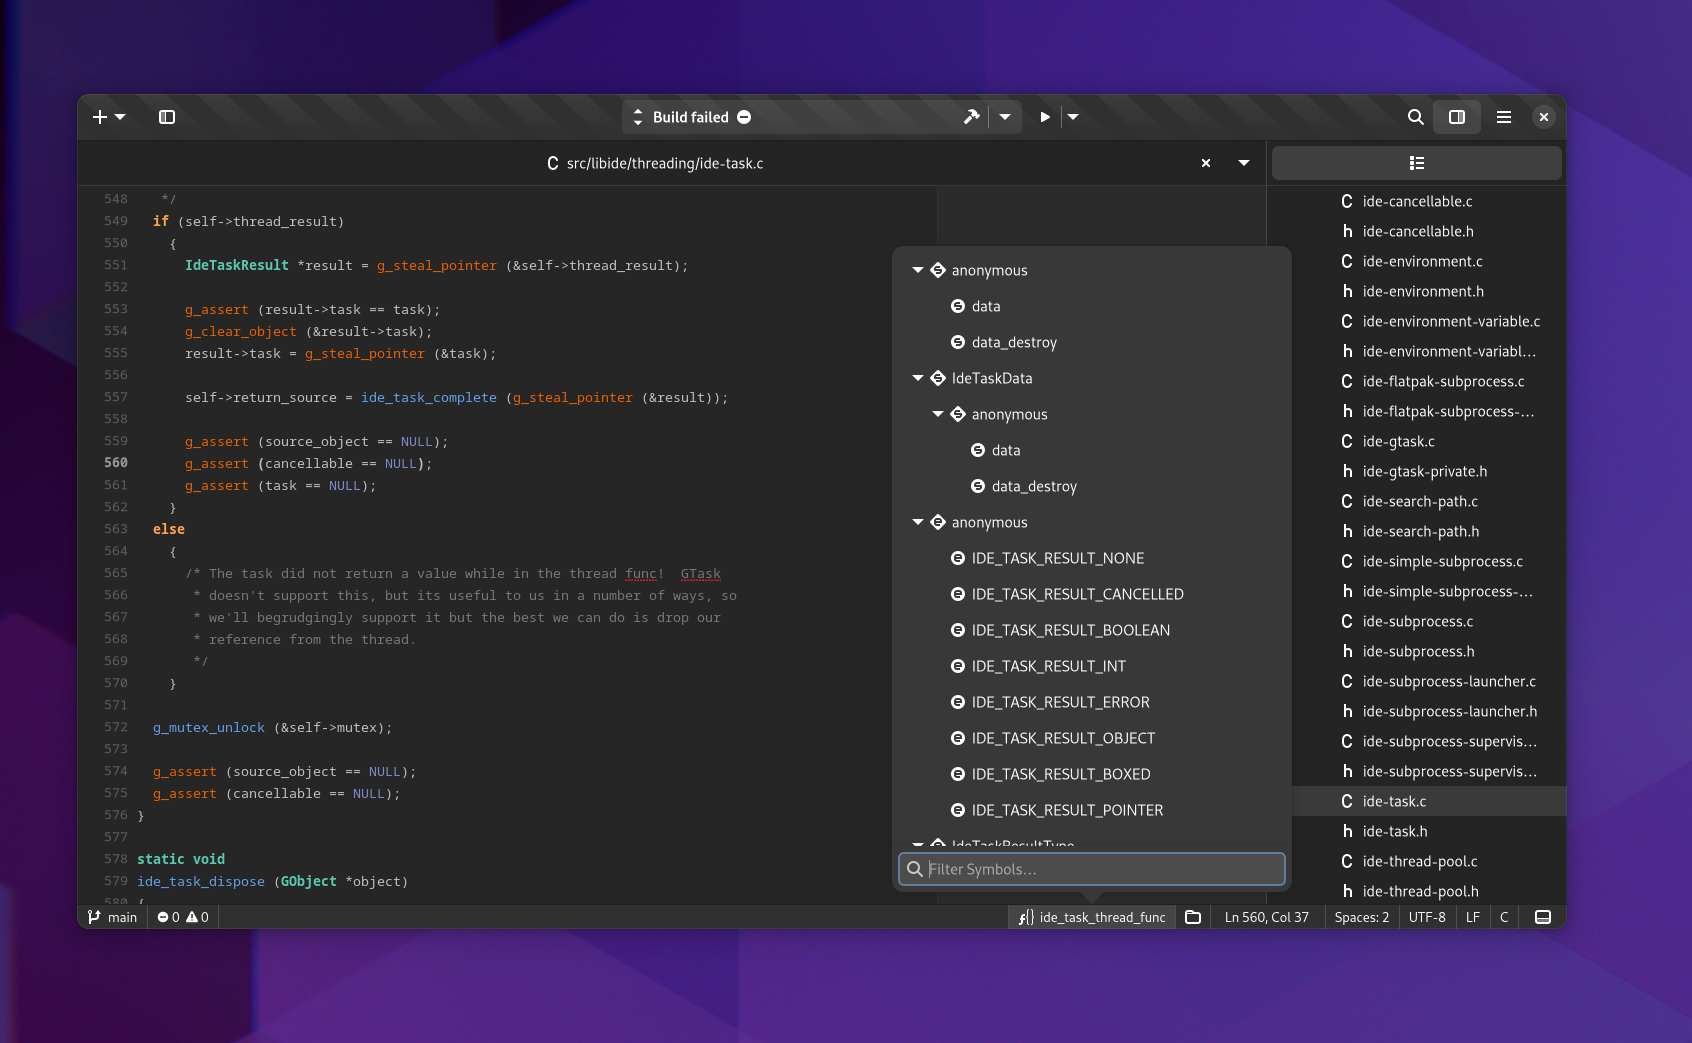
The symbol tree is also still available, but moved to the statusbar. Ctrl+Shift+K will bring it up and allow for quick searching.
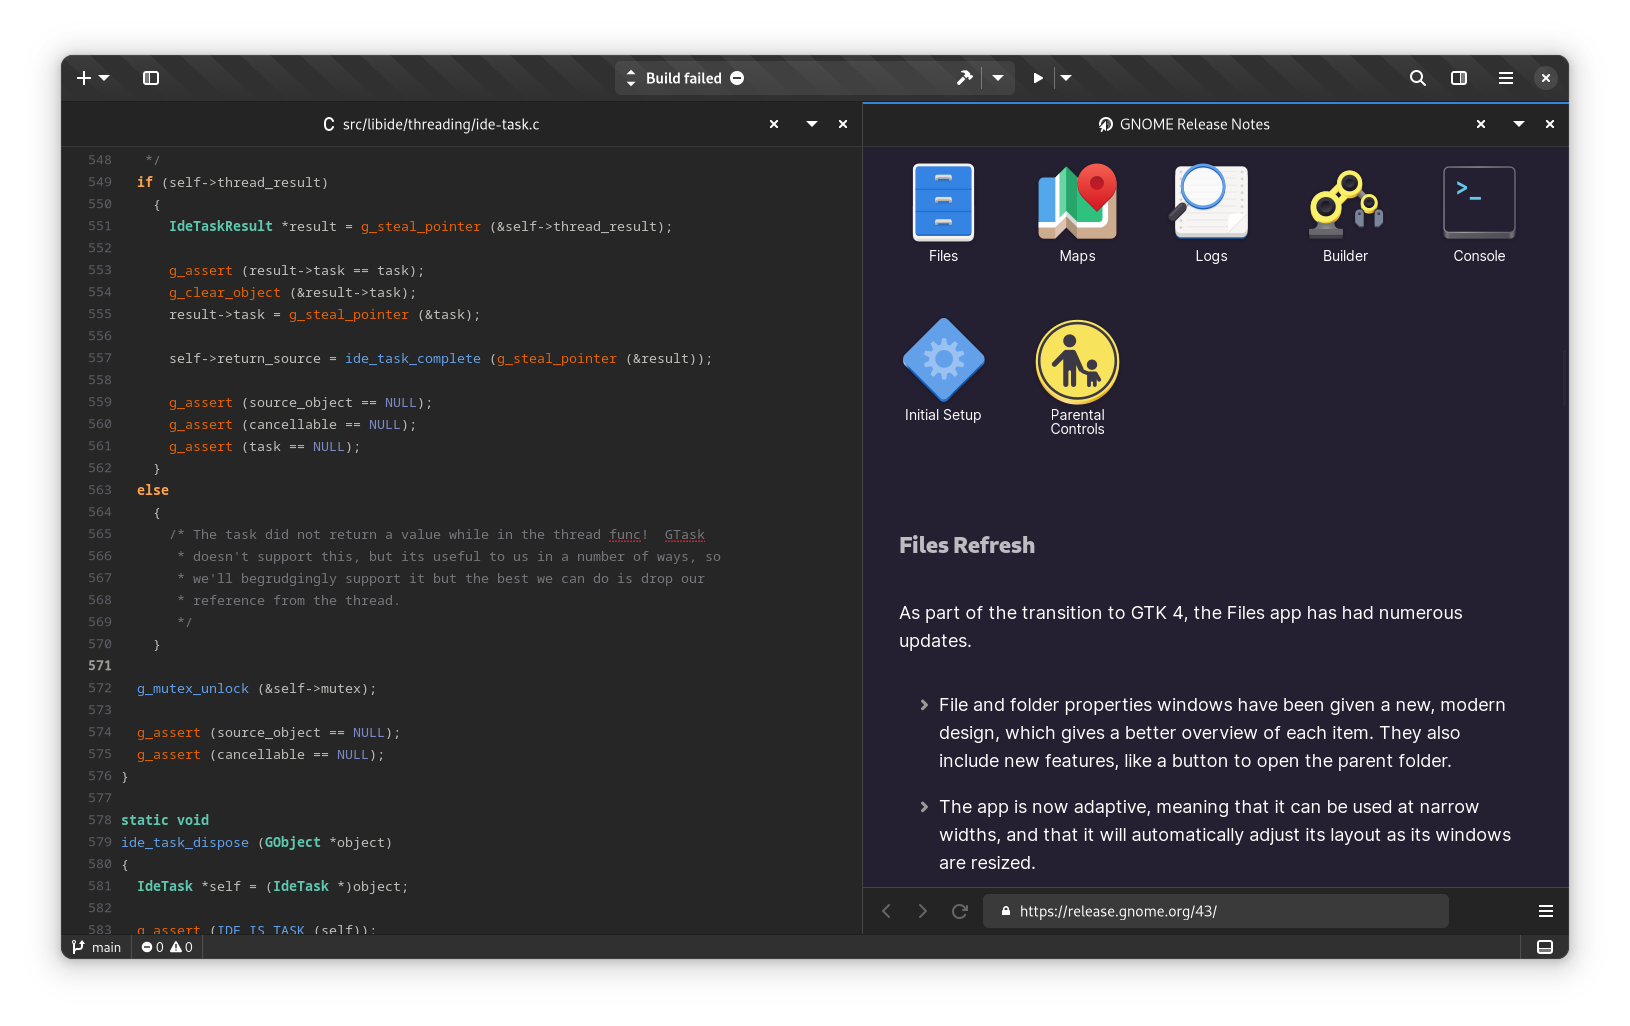
WebKit
A new web browser plugin was added allowing you to create new browser tabs using Ctrl+Shift+B. It is minimal in features but can be useful for quick viewing of information or documentation.
Additionally, the html-preview, markdown-preview, and sphinx-preview plugins have been rewritten to build upon this WebKit integration.

Plugin Removals
Some features have been removed from Builder due to the complexity and time necessary for a proper redesign or port. The Glade plugin (which targets GTK 3 only) has been removed for obvious reasons. A new designer will replace it and is expected as part of GNOME 44.
Devhelp has also been removed but may return after it moves to supporting GTK 4. Additionally, other tooling may supersede this plugin in time.
The code beautifier and color-picker were also removed and will likely return in a different form in future releases. However, language servers providing format capabilities can be enabled in preferences to format-on-save.
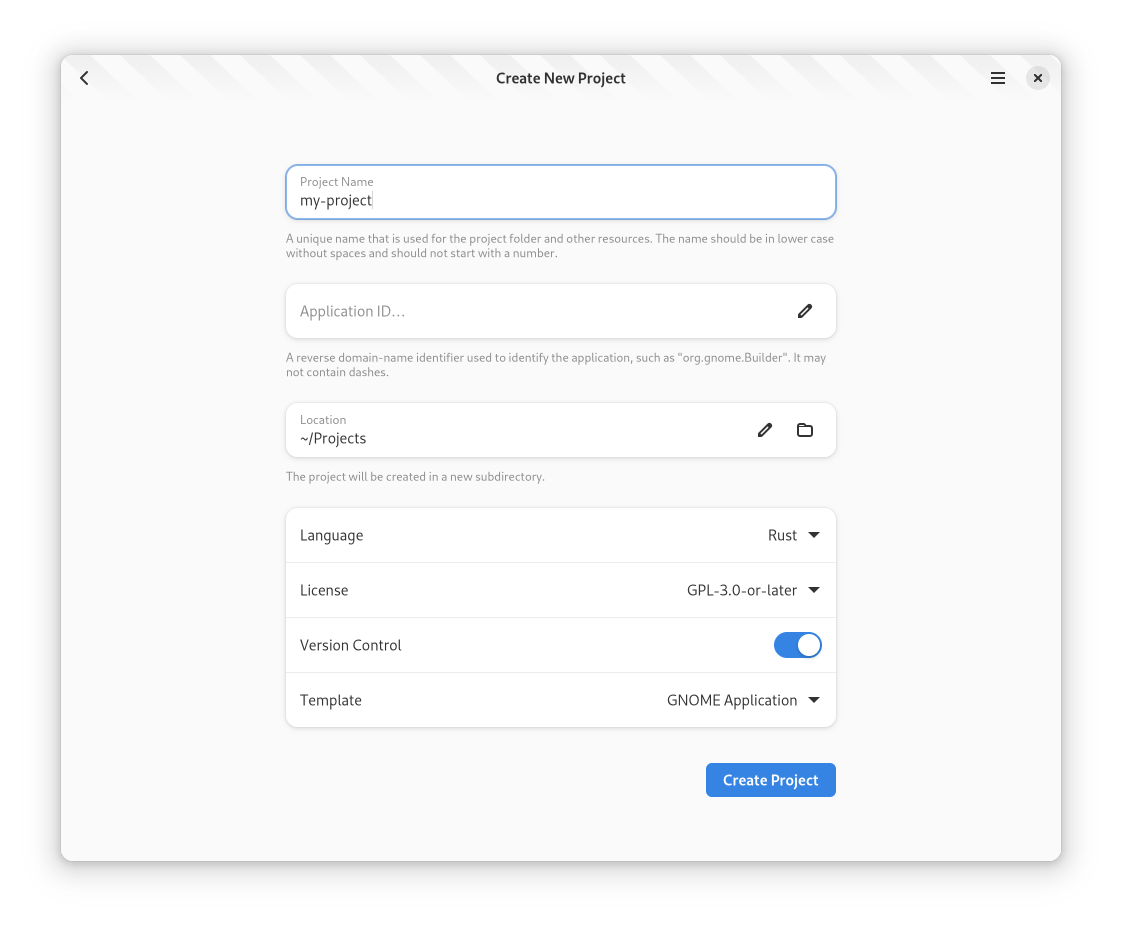
Project Templates
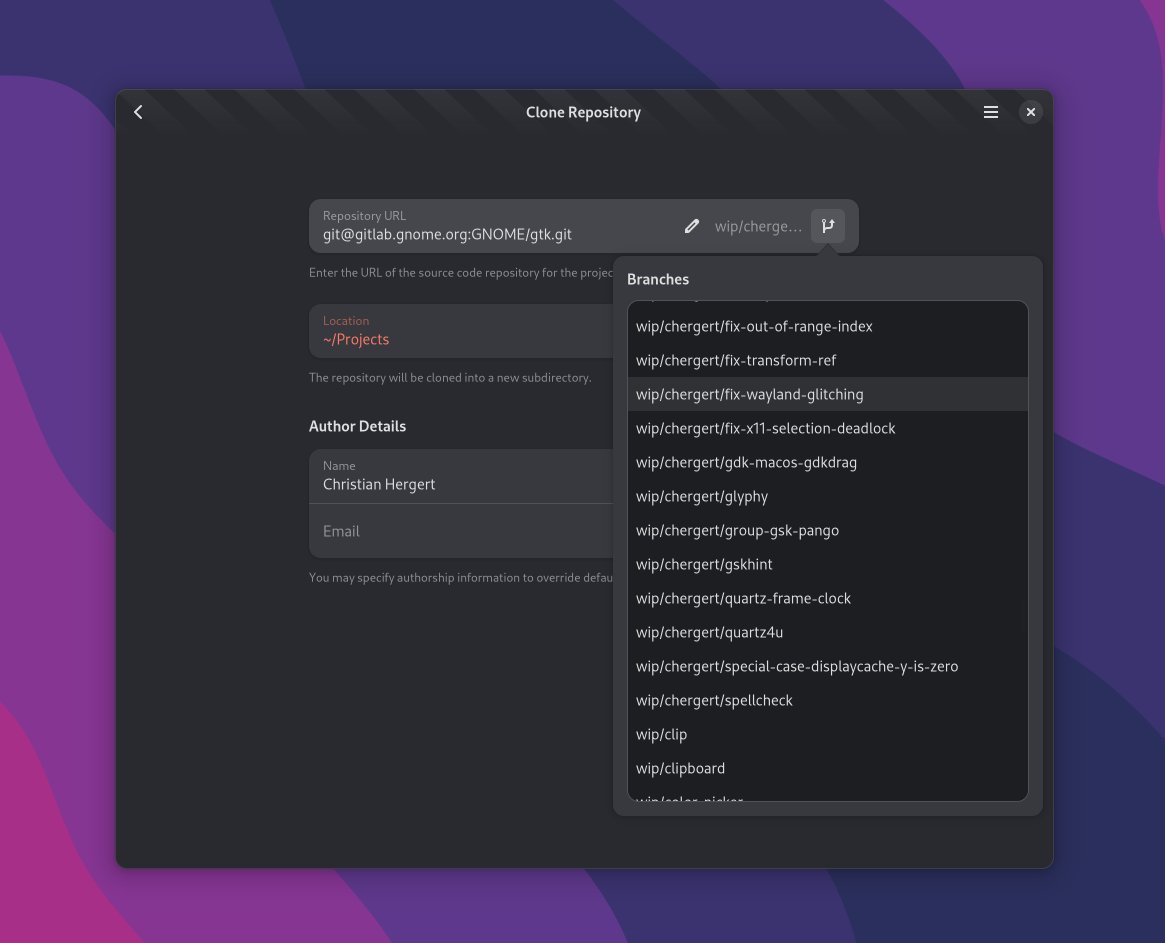
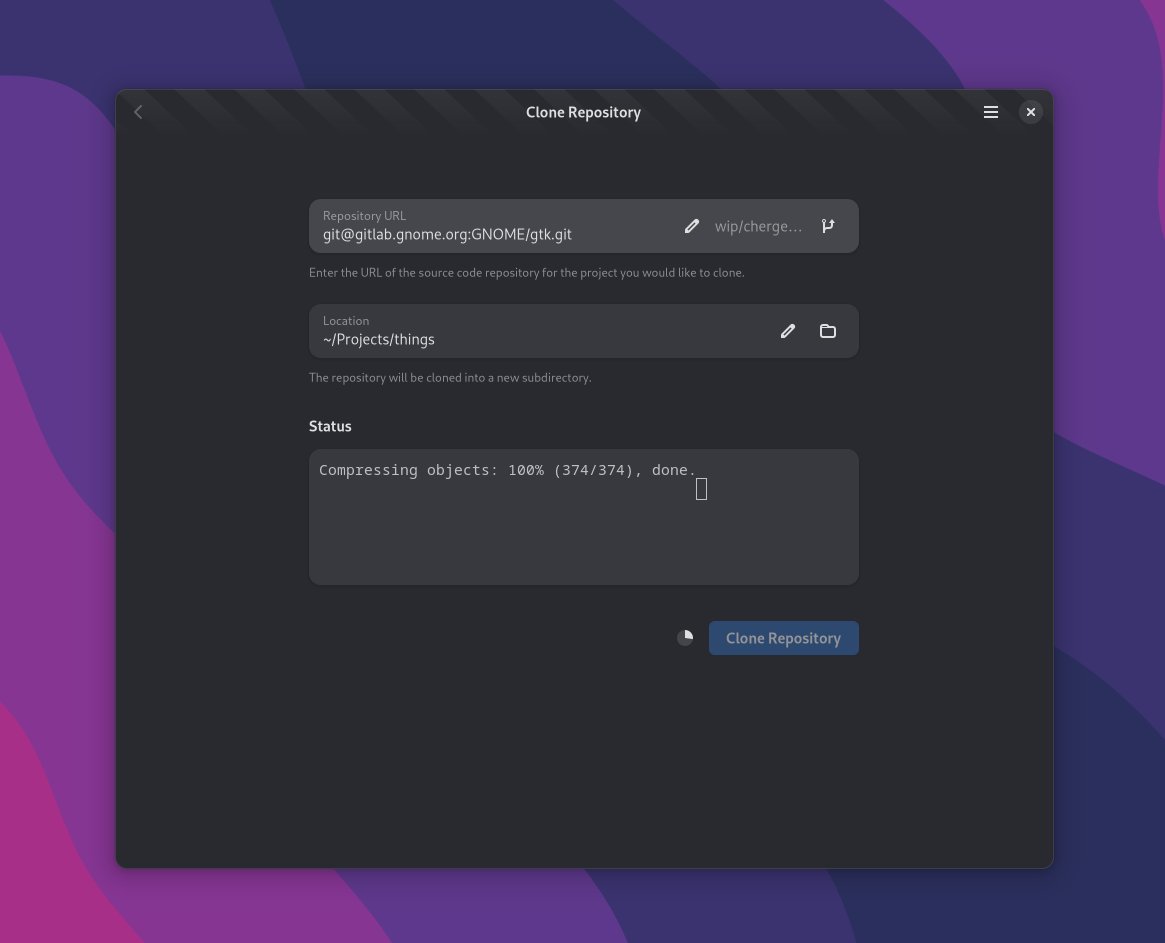
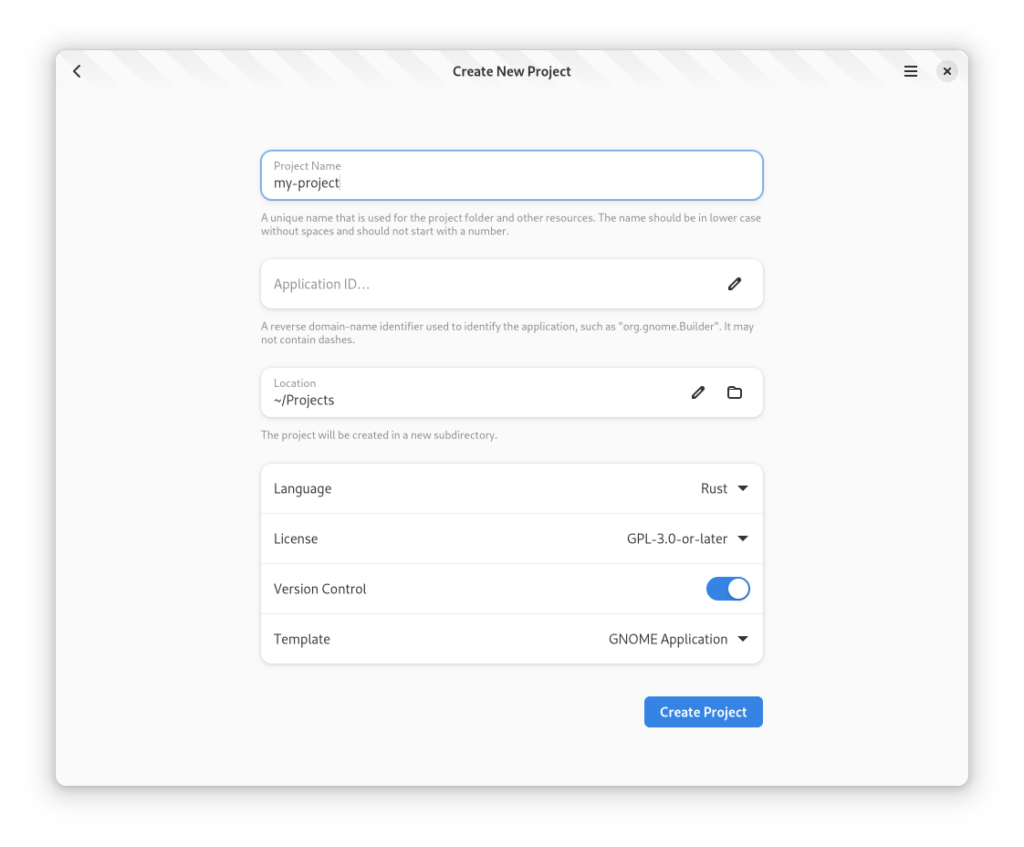
Project templates have been simplified and improved for GTK 4 along with a new look and feel for creating them. You’ll see the new project template workflow from the application greeter by clicking on “Create New Project”.
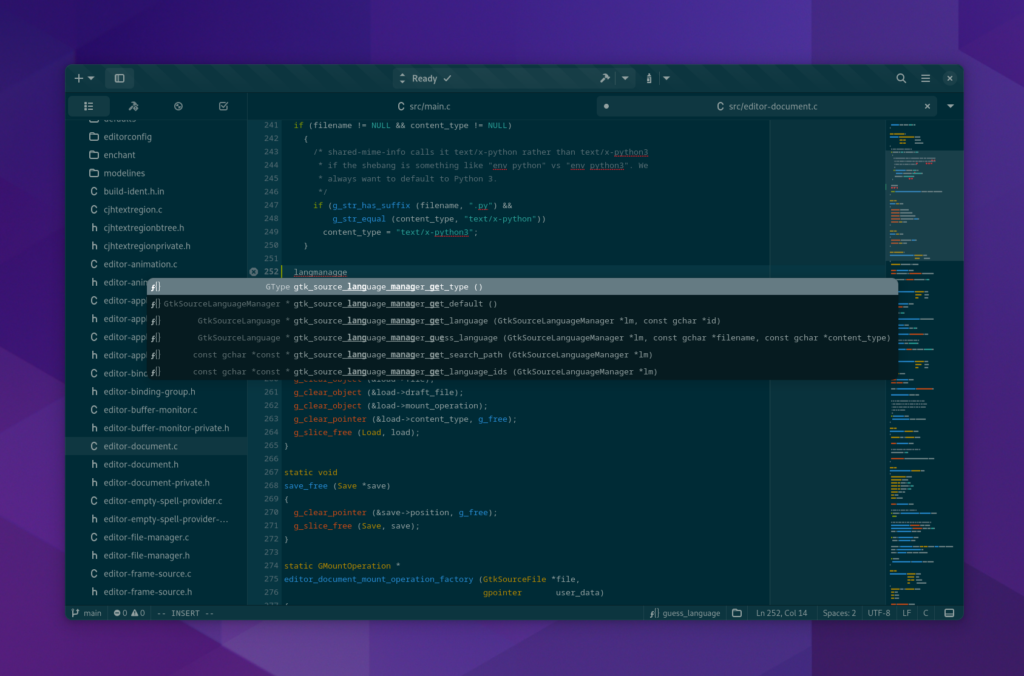
Top Matches
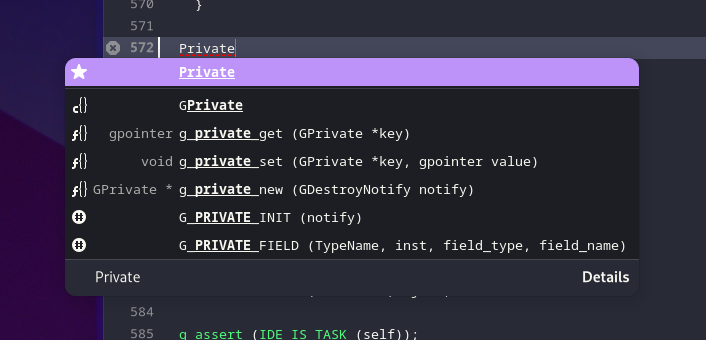
Heavy users of code completion will notice a new completion result which contains a large star (★) next to it. This indicates that the proposal is a very close match for the typed text and is getting resorted to the top of the completion results. This serves as an alternative to sorting among completion providers which is problematic due to lack of common scoring algorithms across different data sources.
Sysprof Integration
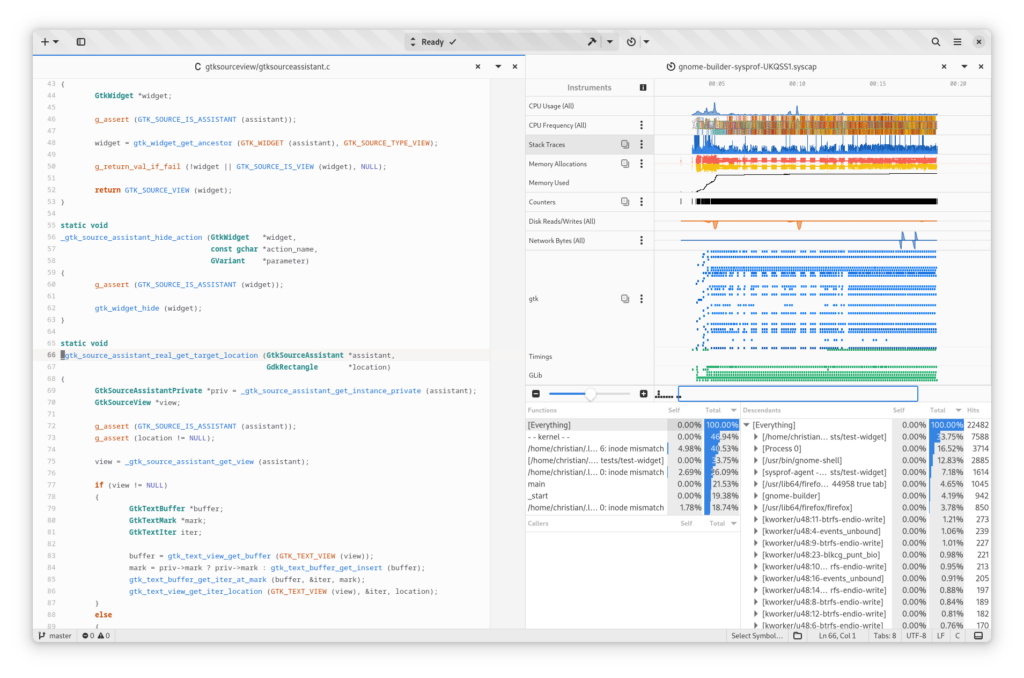
Tooling such as Sysprof went through a lot of revamp too. As part of this process I had to port Sysprof to GTK 4 which was no small task in it’s own right.
Additionally, I created new tooling in the form of sysprof-agent which allows us to have more control when profiling across container boundaries. Tools which need to inject LD_PRELOAD (such as memory profilers) now work when combined with an appropriate SDK.
Language Servers
Language servers have become a part of nearly everyone’s development toolbox at this point. Builder is no different. We’ve added support for a number of new language servers including jdtls (Java), bash-language-server (Bash), gopls (Golang) and improved many others such as clangd (C/C++), jedi-language-server (Python), ts-language-server (JavaScript/Typescript), vls (Vala), rust-analyzer (Rust), blueprint, and intelephense (PHP).
Many language servers are easier to install and run given the new design for how cross-container processes are spawned.
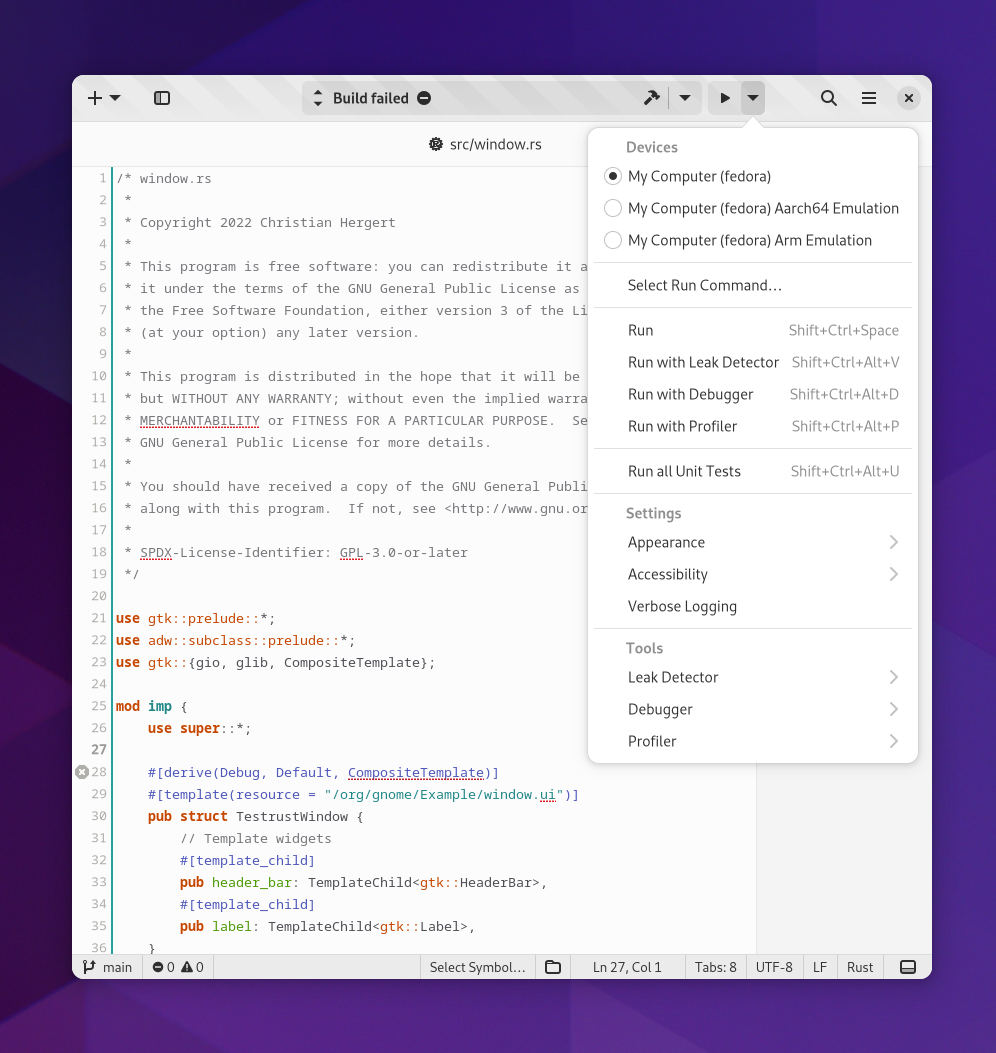
Quick Settings
From the Run Menu, many new quick settings are available to tweak how the application runs as well as well as configure tooling.
For example, you can now toggle various Valgrind options from the Leak Detector sub-menu. Sysprof integration also follows suit here by allowing you to toggle what instruments will be used when recording system state.
To make it easier for developers to ensure their software is inclusive, we’ve added options to toggle High Contrast themes, LTR vs RTL, and light vs dark styling.

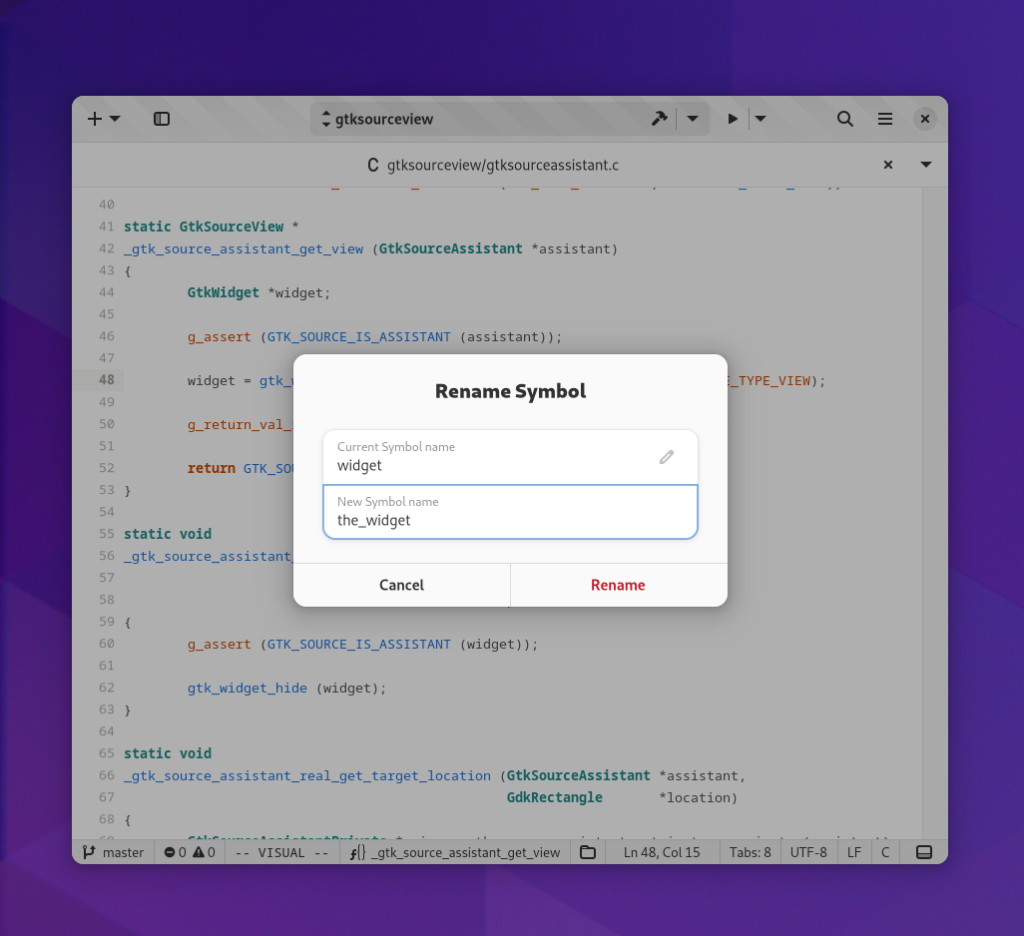
Refactory
For language tooling that supports it, you can do things like rename symbols. This has been in there for years, but few knew about it. We’ve elevated the visibility a bit now in the context menu.
Vim Emulation
In GTK 3, we were very much stuck with deep hacks to make something that looked like Vim work. Primarily because we wanted to share as much of the movements API with other keybinding systems.
That changed with GtkSourceView 5. Part of my upstream maintainer work on GtkSourceView included writing a new Vim emulator. It’s not perfect, by any means, but it does cover a majority of what I’ve used in more than two decades as a heavy Vim user. It handles registers, marks, and tries to follow some of the same pasteboard semantics as Vim (“+y for system clipboard, for example).
I made this available in GNOME Text Editor for GNOME 42 as well. Those that wonder why we didn’t an external engines to synchronize with, can read the code to find out.
Plugins
We have been struggling with our use of PyGObject for sometime. It’s a complex and difficult integration project and I felt like I spent more time debugging issues than I was comfortable with. So this port also included a rewrite of every Python-based plugin to C. We still enable the Python 3 plugin loader from libpeas (for third-party plugins), but in the future we may switch to another plugin language.
Maintainers Corner
So…
A special thanks to all those that sent me merge requests, modernized bits of software I maintain, fixed bugs, or sent words of encouragement.
I’m very proud of where we’ve gotten. However, it’s been an immense amount of work. Builder could be so much more than it is today with your help with triage of bugs, designing and writing features, project and product management, writing documentation, maintaining plugins, improving GNOME OS, and everything in-between.
The biggest lesson of this cycle is how a strong design language is transformative. I hope Builder’s transformation serves as an example for other GNOME applications and the ecosystem at large. We can make big leaps in short time if we have the right tooling and vision.