Earlier this year I started a branch to track GTK 4 development which is targeted for release by end-of-year. I just merged it which means that our recently released gtksourceview-4-8 branch is going to be our LTS for GTK 3. As you might remember from the previous maintainer, GtkSourceView 4.x is the continuation of the GtkSourceView 3.x API with all the deprecated API removed and a number of API improvements.
Currently, GtkSourceView.Next is 5.x targeting the GTK 4.x API. It’s a bit of an unfortunate number clash, but it’s been fine for WebKit so we’ll see how it goes.
It’s really important that we start getting solid testing because GtkSourceView is used all over the place and is one of those “must have” dependencies when moving to a new GTK major ABI.
Preparations in GTK 4
Since I also spend time contributing to GTK, I decided to help revamp GtkTextView for GTK 4. My goal was to move various moving parts into GtkTextView directly so that we could make them more resilient.
Undo Support
One feature was undo support. GTK 4 now has native support for undo by implementing text history in a compact form within GTK itself. You can now set the enable-undo properties to TRUE on GtkTextView, GtkEditable widgets like GtkText or GtkEntry, and others.
GPU Rendered Text (sort of)
Matthias Clasen and I sat down one afternoon last year and wrote a new PangoRenderer for GSK using render nodes and the texture atlas provided by the OpenGL and Vulkan renderers. Since then, GtkTextView gained a GtkTextLineDisplay cache so that we can keep these immutable render nodes around across multiple snapshots.
Text is still rendered on the CPU into a texture atlas, which is uploaded to the GPU and re-used when possible. Maybe someday things like pathfinder will provide a suitable future.
GtkTextView and Widgets
Previously, the gutters for GtkTextView were simply a GdkWindow which could be rendered to with Cairo. This didn’t fit well into the “everything should be a widget” direction for GTK 4. So now you can pack a widget into each of the 4 gutters around the edges of a GtkTextView. This means you can handle input better too using GtkGesture and GtkEventControllers. More importantly, though, it means you can improve performance of gutter rendering using snapshots and cached render nodes when it makes sense to do so.
Changes in GtkSourceView Next
Moving to a new major ABI is a great time to do cleanups too as it will cause the least amount of friction. So I took this opportunity to revamp much of the GtkSourceView code. We follow more modern GObject practices and have bumped our compiler requirements to closely match GTK 4 itself. This still means no g_autoptr() usage from within GtkSourceView sadly thanks to MSVC being … well the worse C compiler still in wide use.
GtkSourceGutterRenderer is now a GtkWidget
Now that we have margins which can contain widgets and contribute to the render node tree, both GtkSourceGutter and GtkSourceGutterRenderer are GtkWidget. This will mean you need to change custom gutter renderers a bit, but in practice it means a lot less code than they previously contained. It also makes supporting HiDPI much easier.
GtkSourceCompletion Revamp
I spent a lot of time making completion a pleasing experience in GNOME Builder and that work has finally made it upstream. To improve performance and simplicity of implementation, this has changed the GtkSourceCompletionProvider and GtkSourceCompletionProposal interfaces in significant ways.
GtkSourceCompletionProposal is now a mostly superfluous type used to denote a specialized GObject. It doesn’t have any functions in the vtable nor any properties currently and the goal is to avoid adding them. Simply G_IMPLEMENT_INTERFACE (GTK_SOURCE_TYPE_COMPLETION_PROPOSAL, NULL) when defining your proposal object GType.
This is because all of the completion provider implementation can now be performed from GtkSourceCompletionProvider. This interface focus on using interfaces like GListModel (like the rest of GTK 4) and how to asynchronously generate and refine the results with additional key-presses.
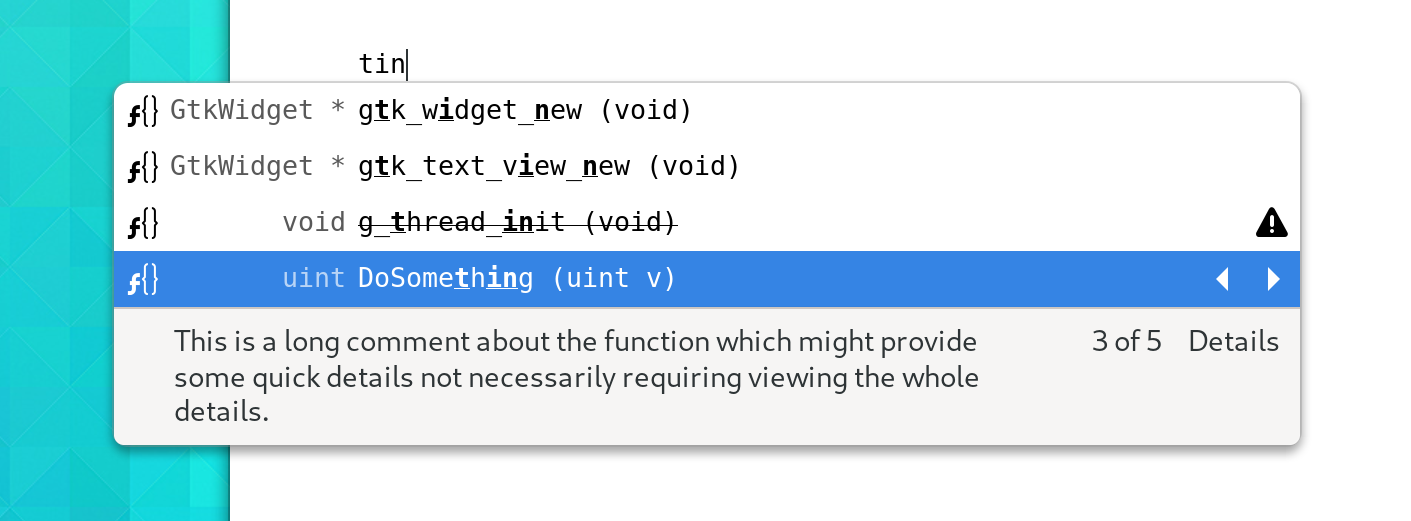
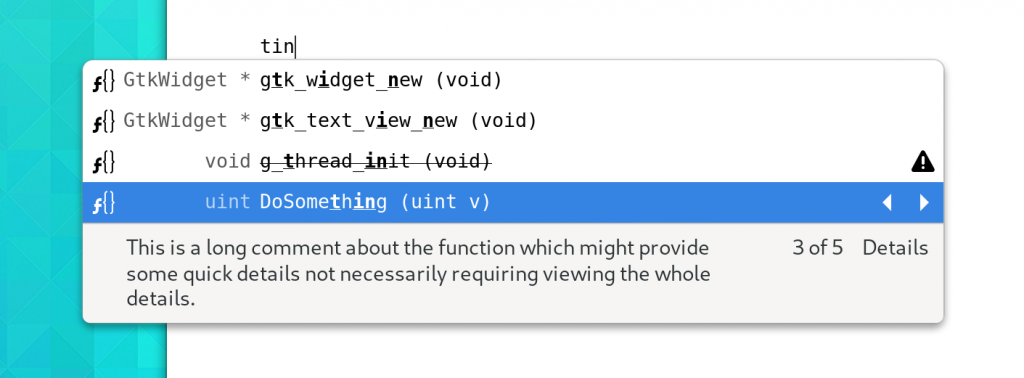
The completion window has been revamped and now allows proposals to fill a number of columns including an icon, return-type (Left Hand Side), Typed Text, and supplementary text. It resizes with content and ensures that we only inflate the number of GObjects necessary to view the current set. A fixed number of widgets are also created to reduce CSS and measurement costs.
Further, proposals may now have “alternates” which allows for providers to keep all of the DoSomething() proposals with 20 overloaded forms for each base type in whatever language of the day is being used from clogging up the suggestions.
The new GtkSourceCompletionCell widget is a generic container used throughout completion for everything from containing icons, text, or even custom widgetry for the completion details popover.
GtkSourceGutterLines
A new abstraction, GtkSourceGutterLines, was added to help reduce overhead in generation of content in the gutter. The design of gutters lead to an exorbitant amount of measurement work on every frame. This was actually the biggest hurdle in making GTK 3 applications scroll smoothly. The new design allows for all the renderers to collect information about lines in one pass (along with row height measurements) and then snapshot in their second pass. Combined with the ability to cache render nodes, gutter renderers should have what they need to remain fast even in HiDPI environments.
The implementation of this also has a few nice details to further reduce overhead, but I’ll leave that to those interested in reading the code.
GtkSourceBuffer::cursor-moved
GtkSourceBuffer now has a cursor-moved signal. This seemed to be something implemented all over the place so we might as well have it upstream.
Reduce signal emission overhead
A number of places have had signal emission overhead reduced. Especially in property notifications.
Spaces Drawing
The GtkSourceSpaceDrawer now caches render nodes for drawing spaces. This should improve the performance in the vast majority of cases. However, one case still could be improved upon: tabs when the tab width changes (generally when used after text or spaces).
New Features
Snippets
A new snippet engine has landed based on a much improved version from GNOME Builder. You can provide bundles using an XML snippets file. You can also create them dynamically from your application and insert them into the GtkSourceView. In fact, many completion providers are expected to do this.
The snippet language is robust and shares many features and implementation details from GNOME Builder.

Assistants
A new subsystem, GtkSourceAssistant is used to provide accessory information in a GtkSourceView. Currently this type is private and an implementation detail. However, GtkSourceCompletion and GtkSourceSnippet build upon it to provide some of their features. In the long term, we expect hover providers to also take advantage of this subsystem.
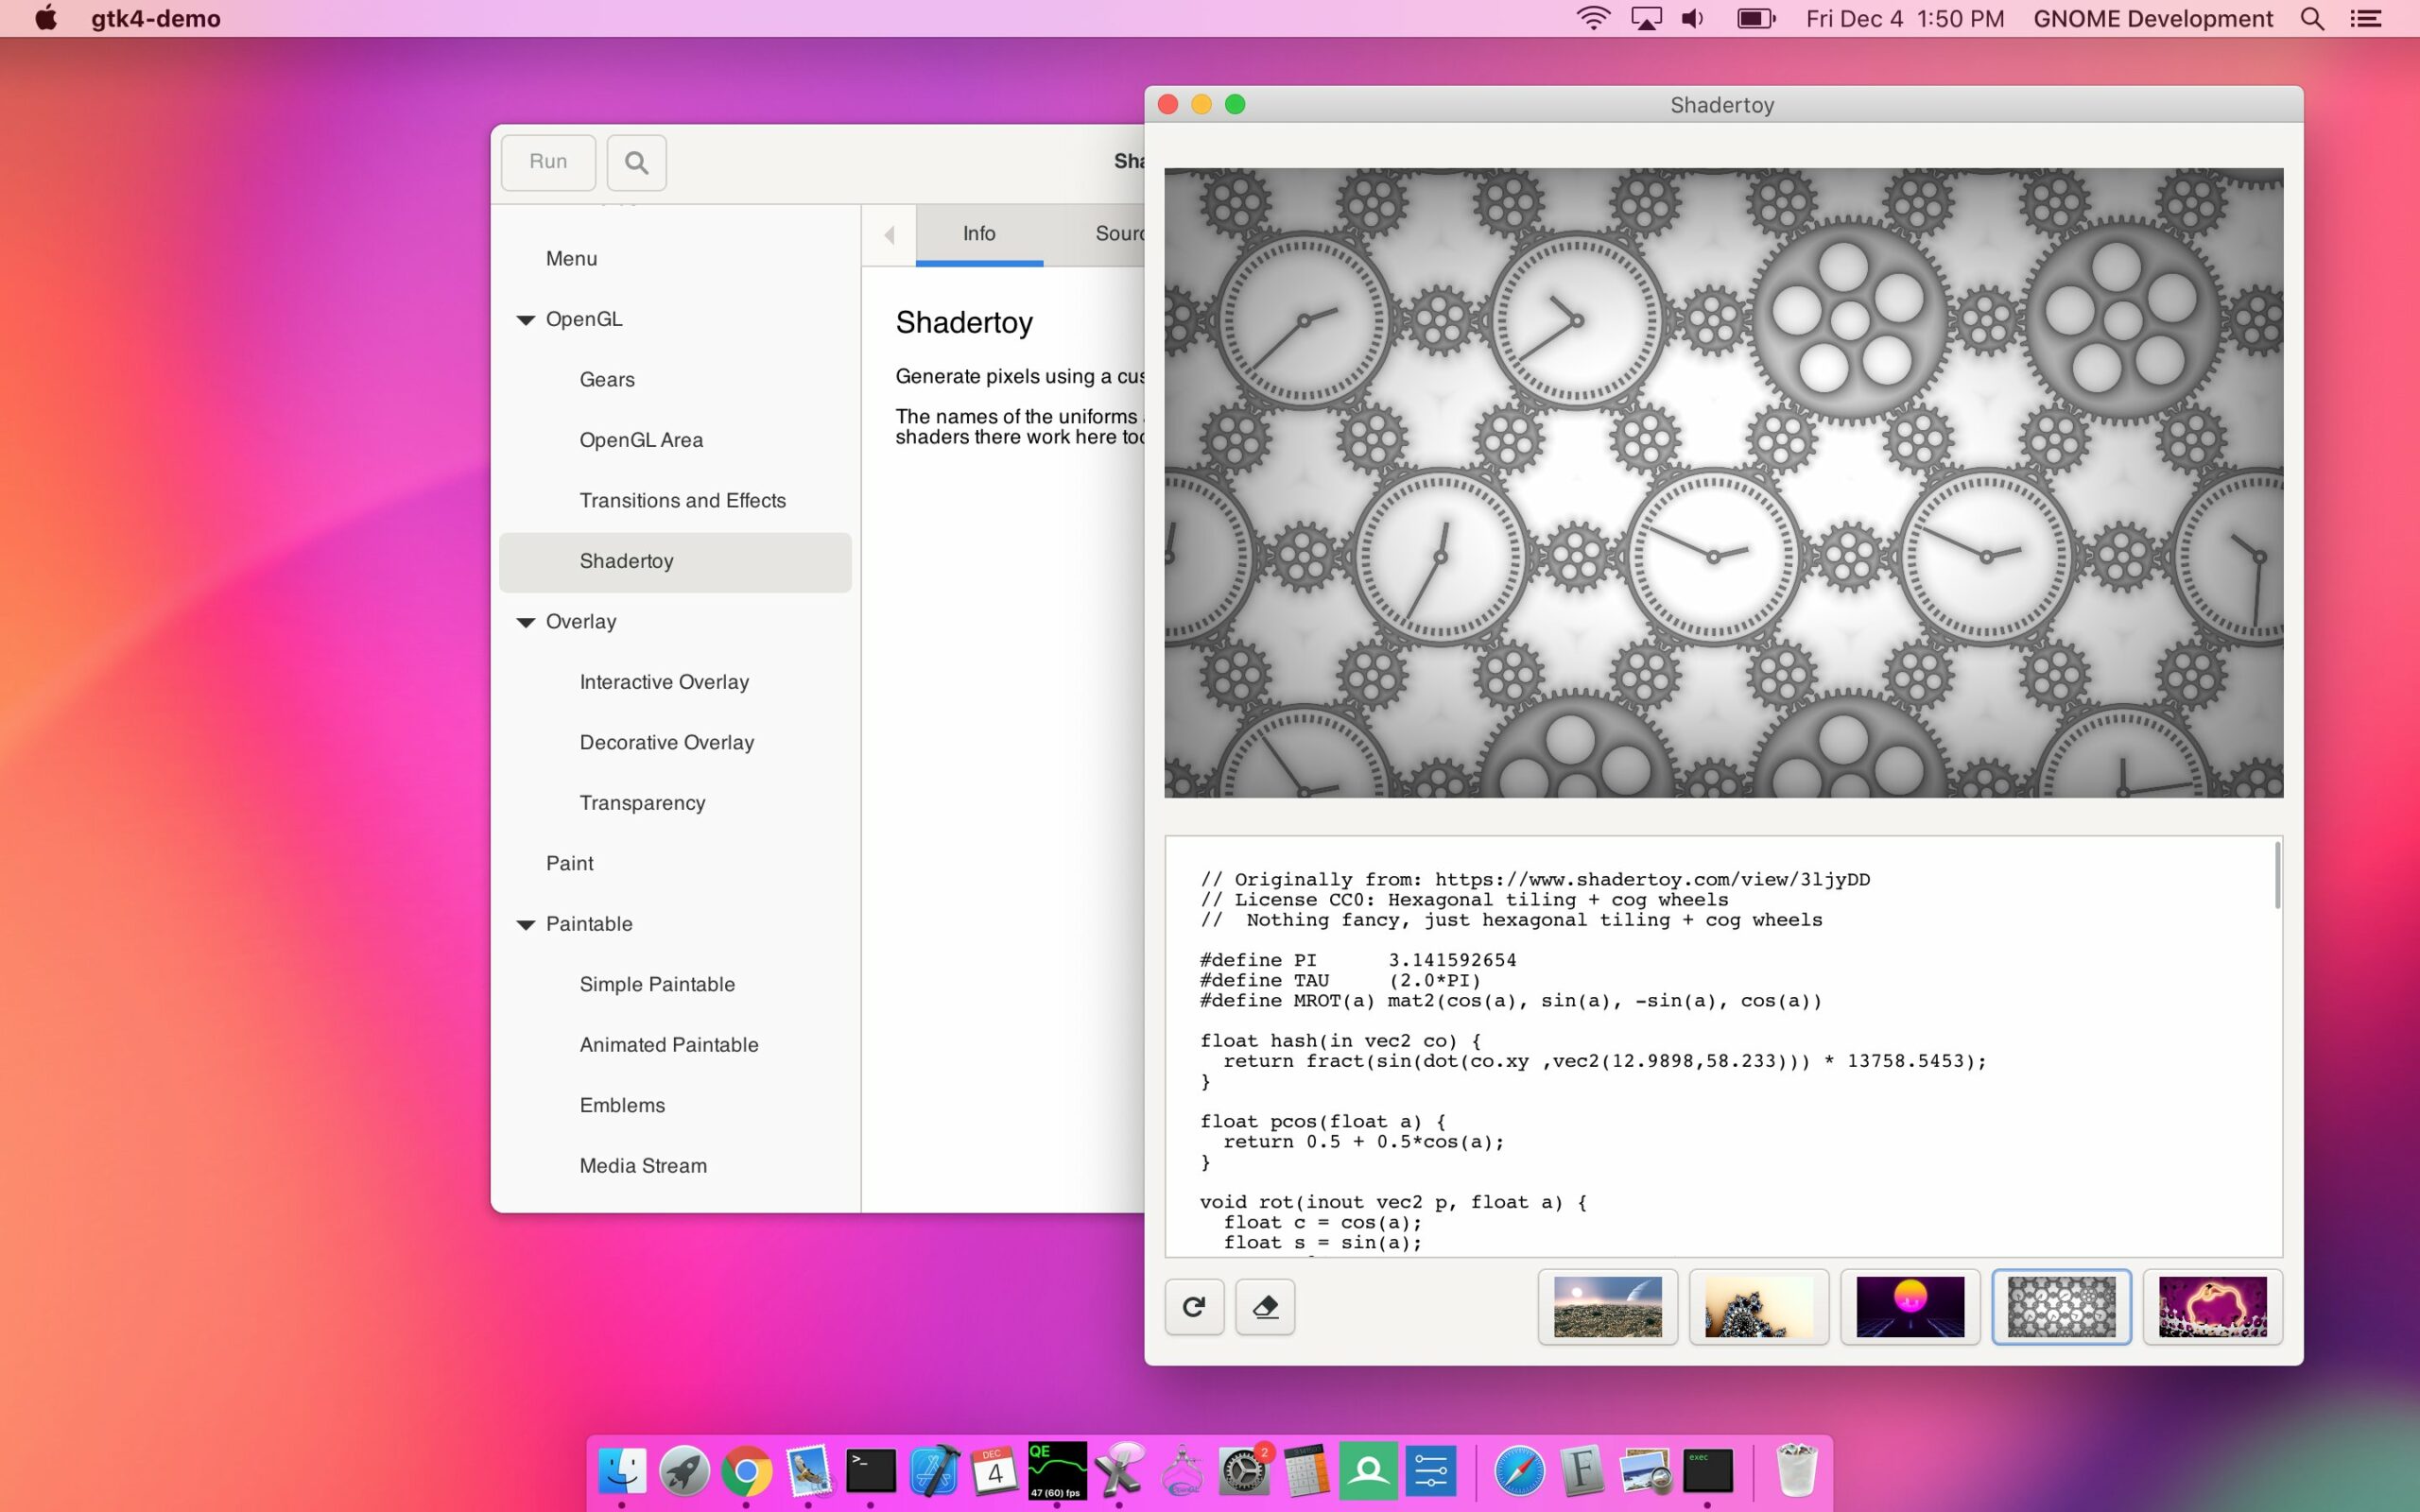
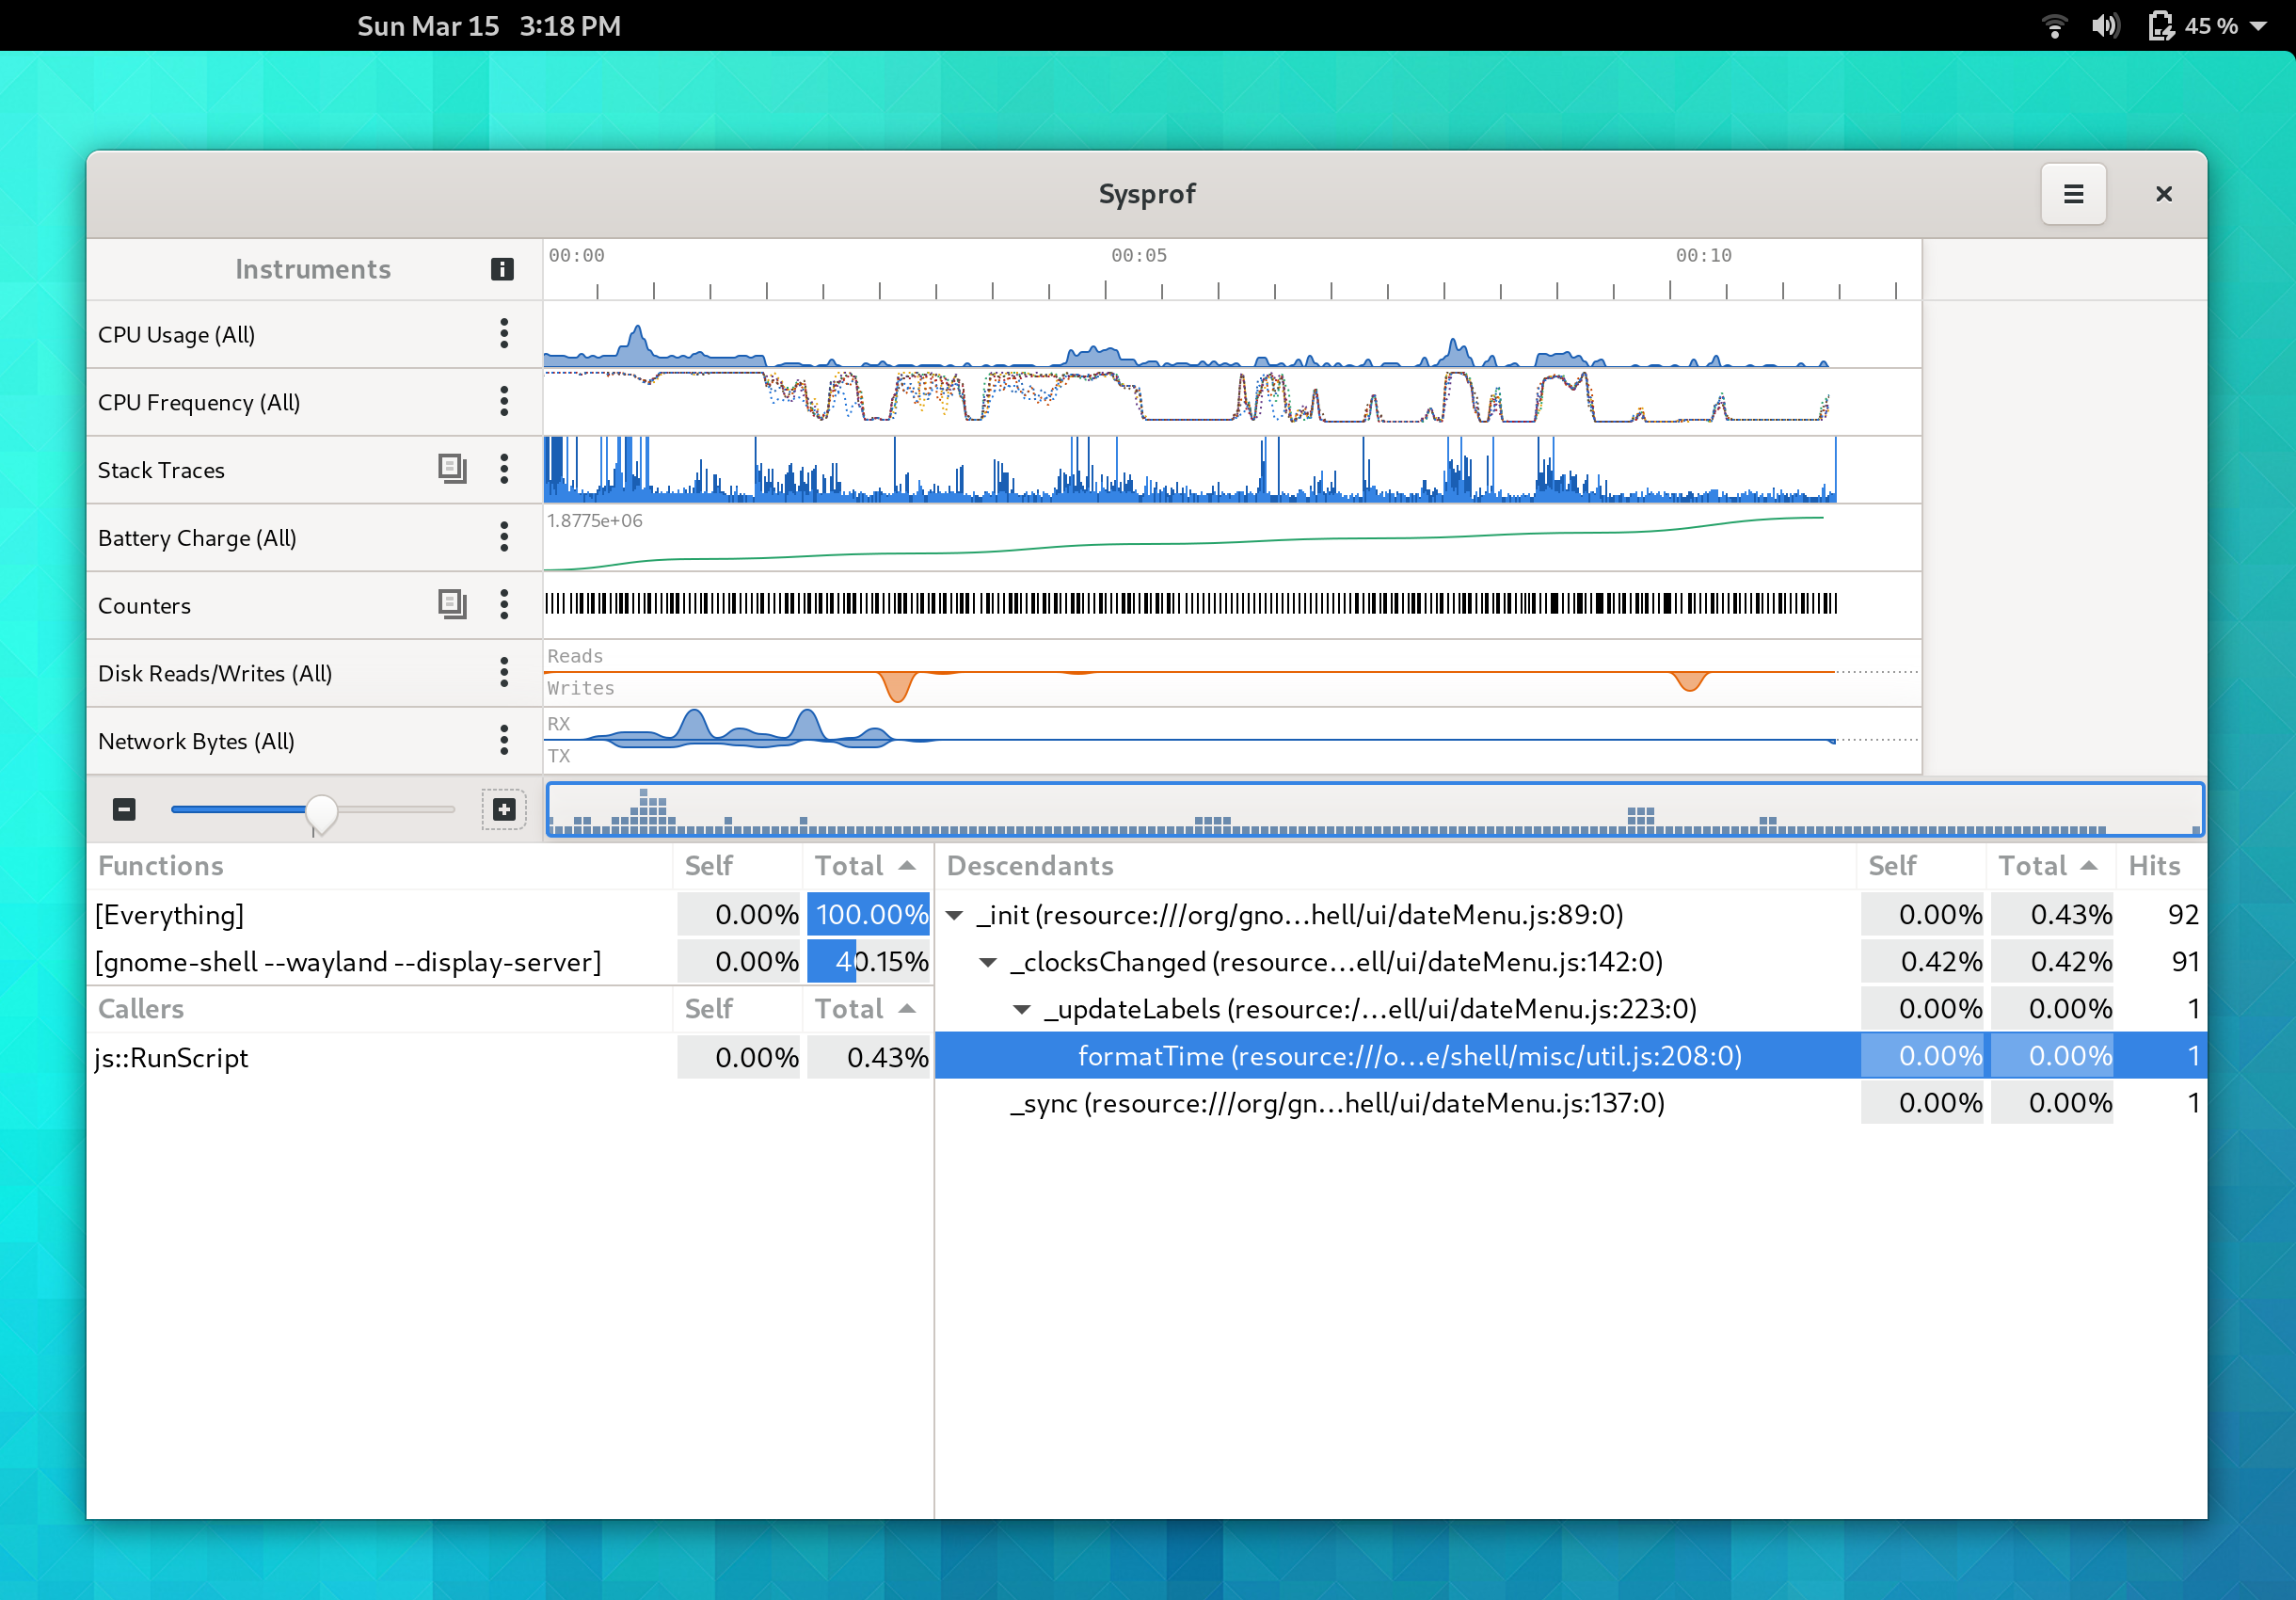
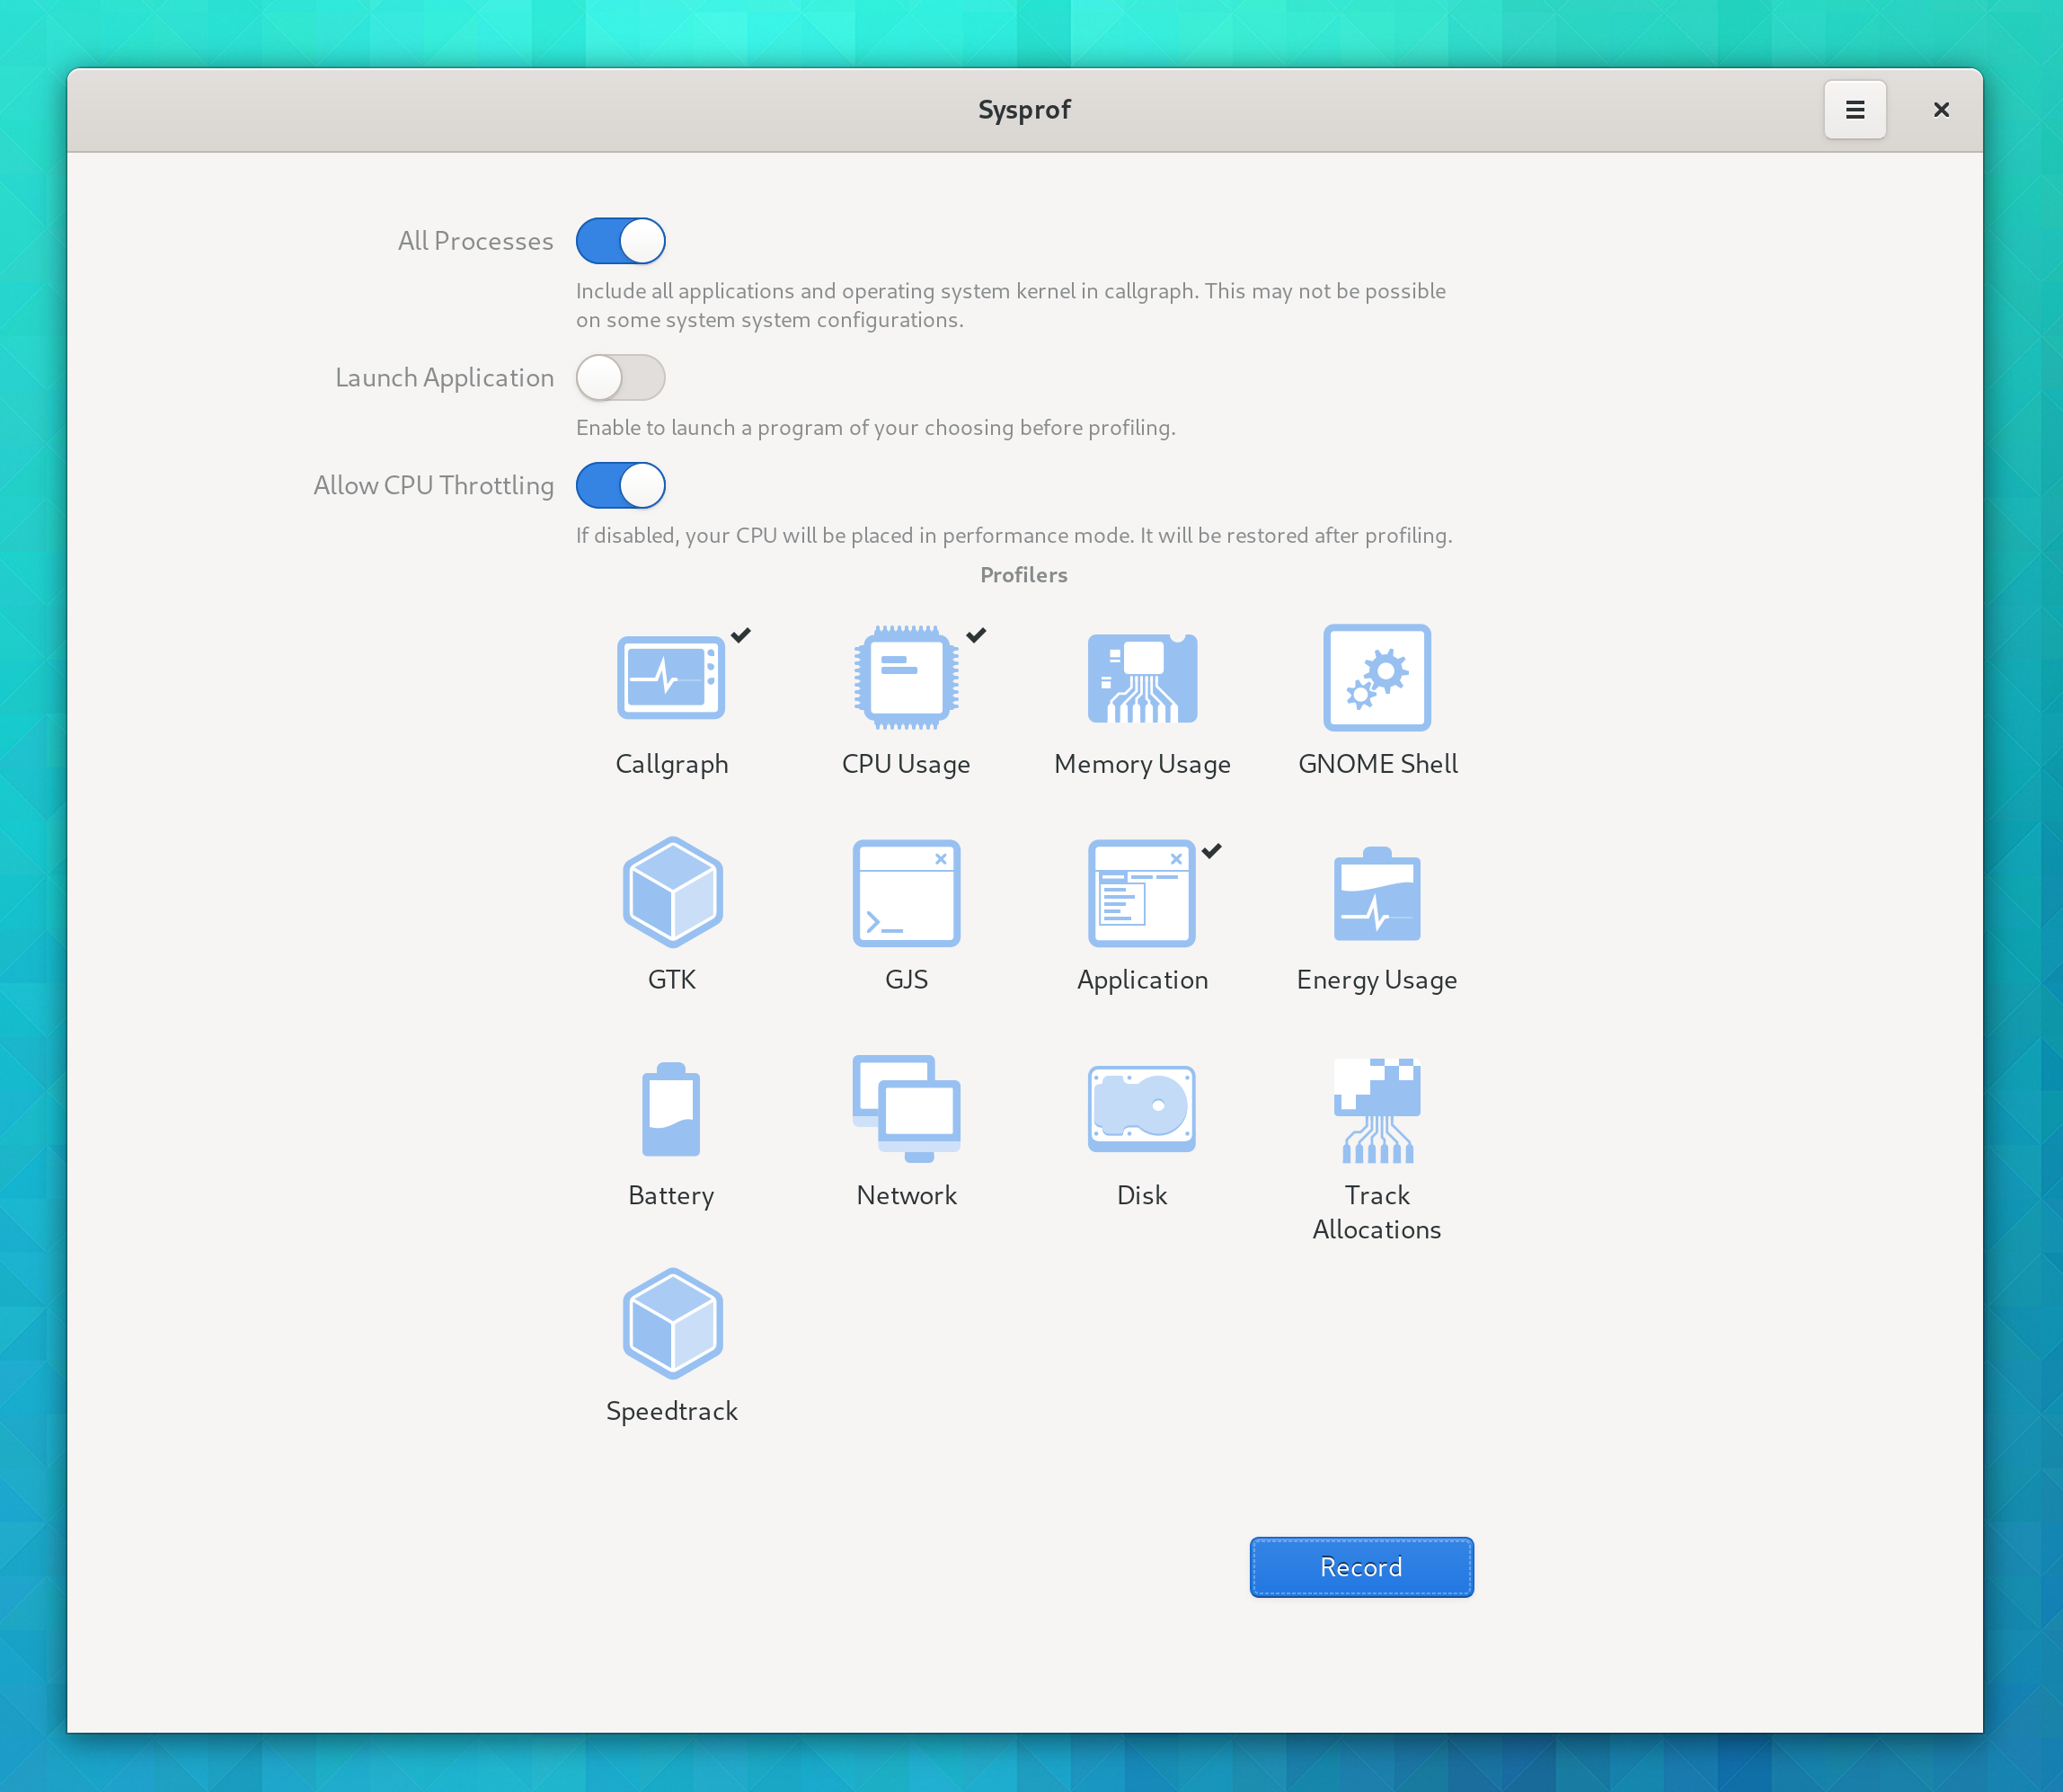
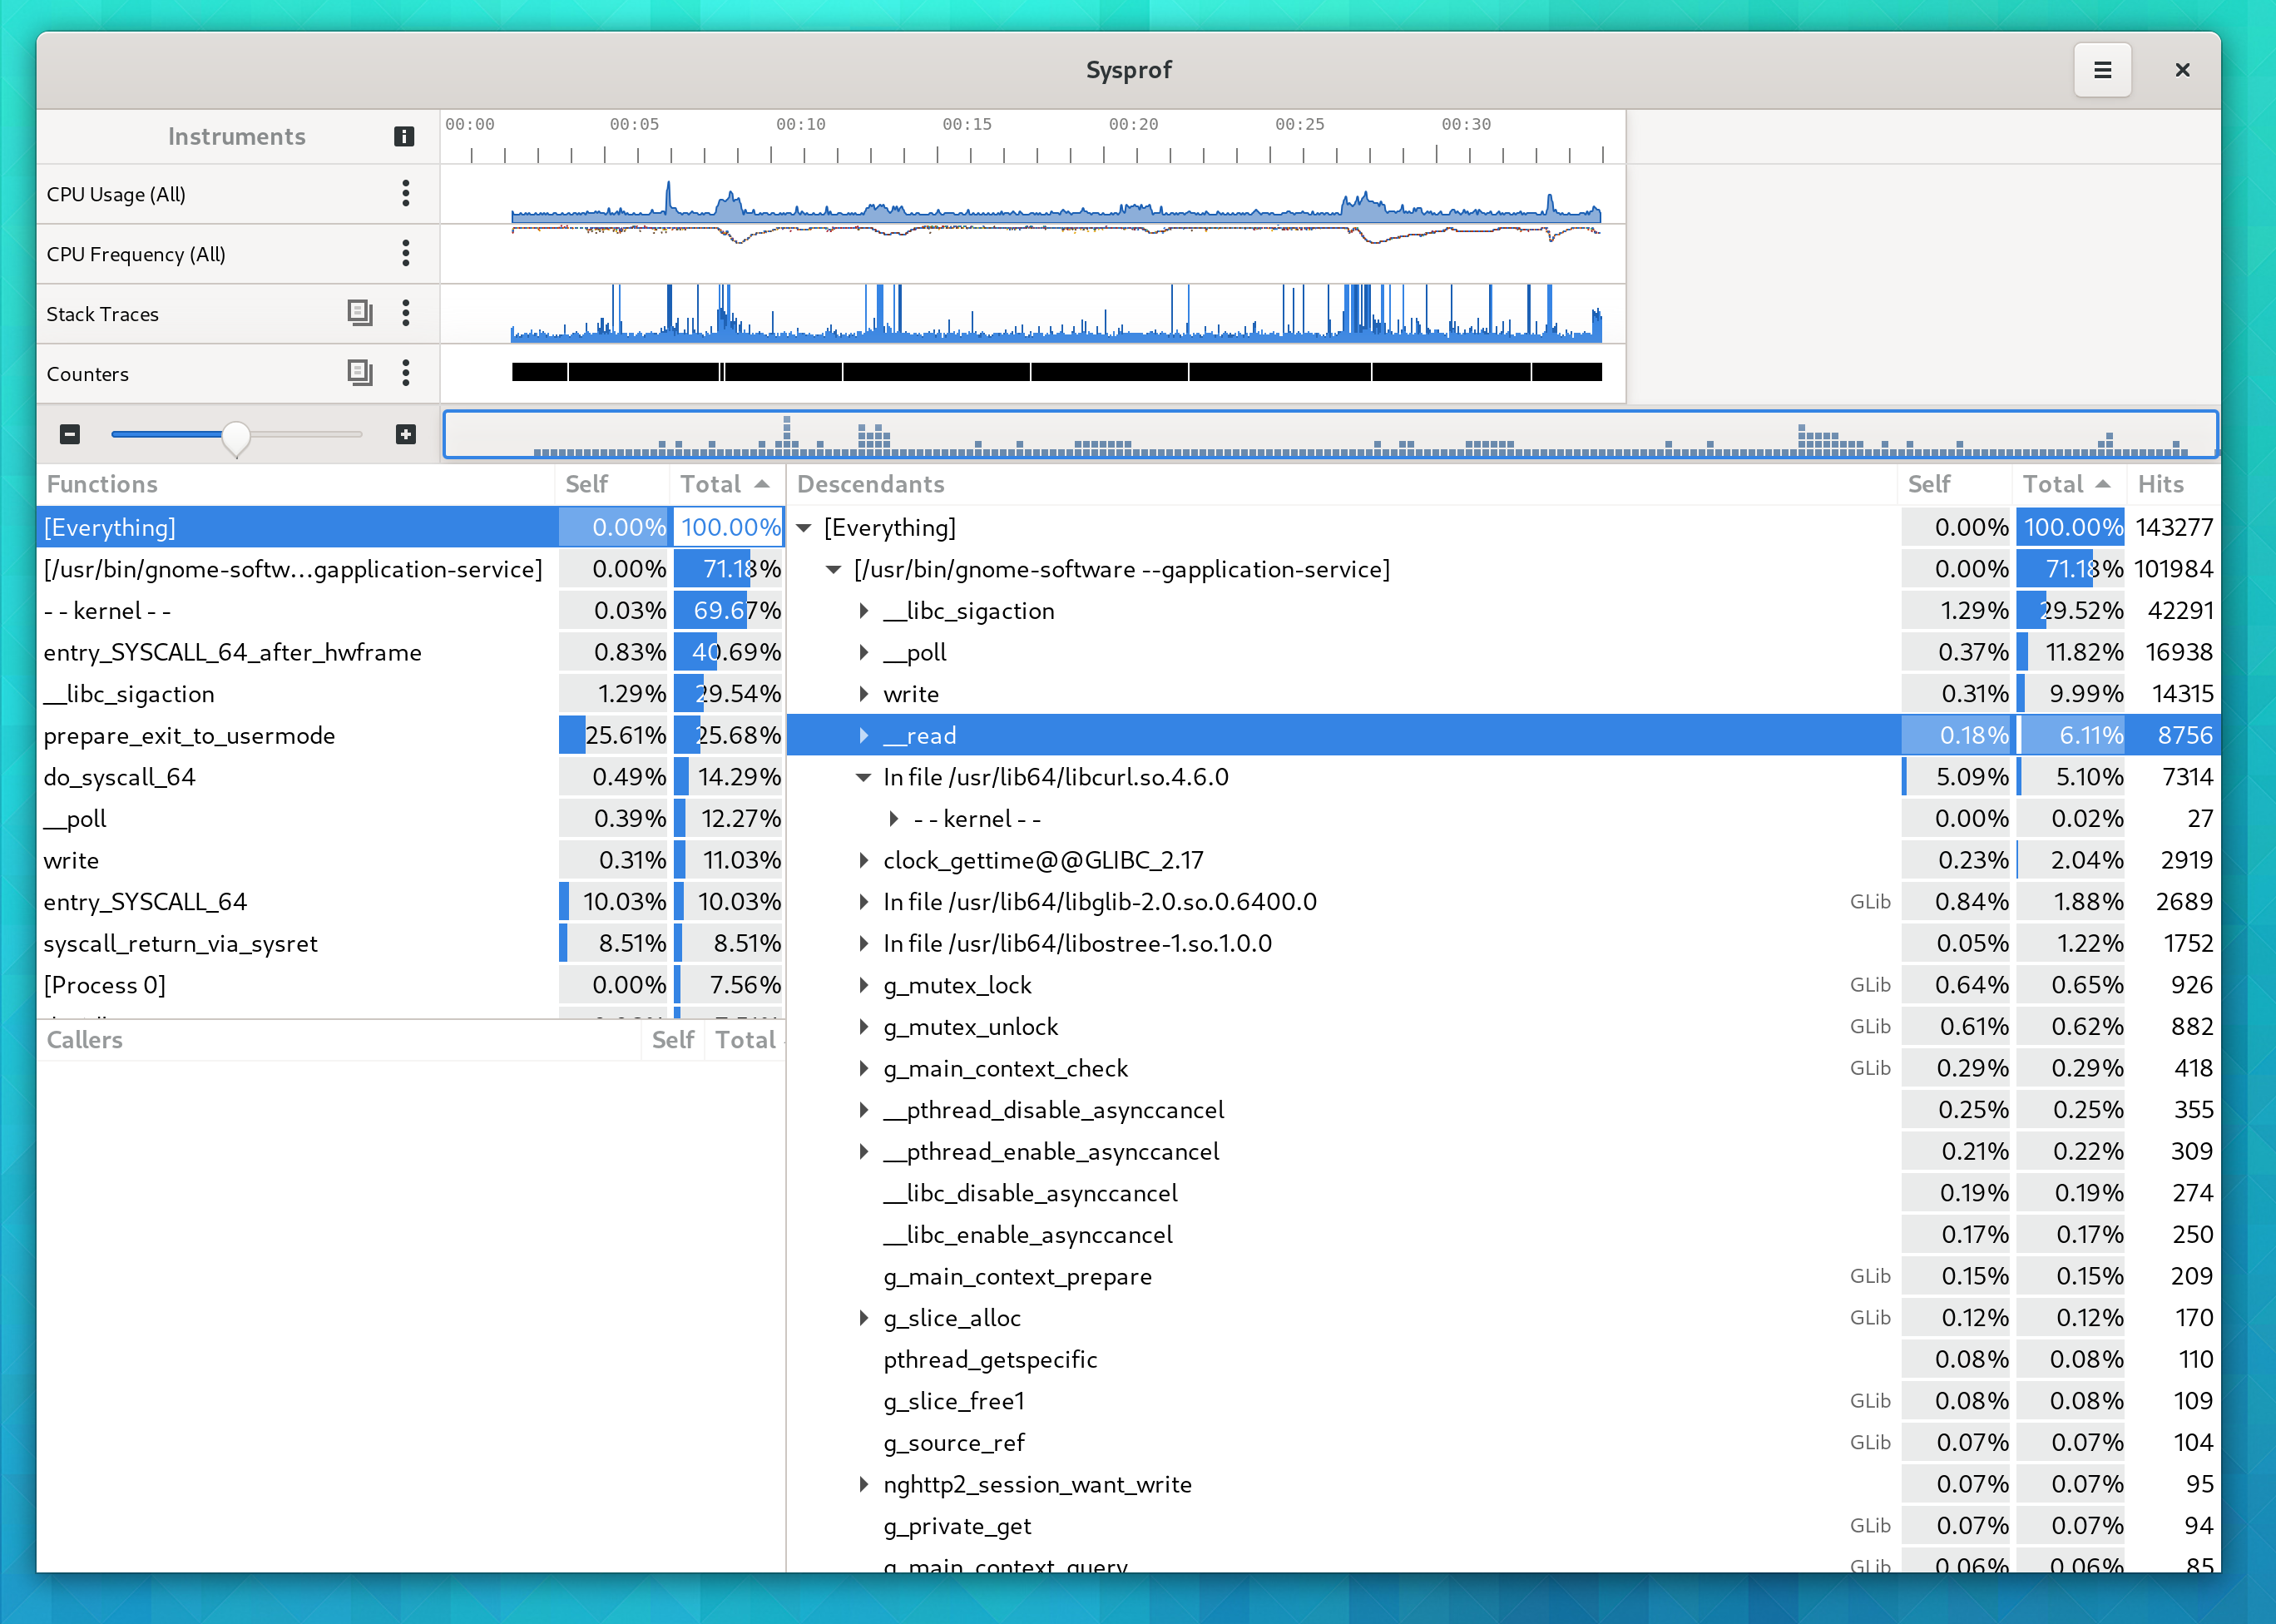
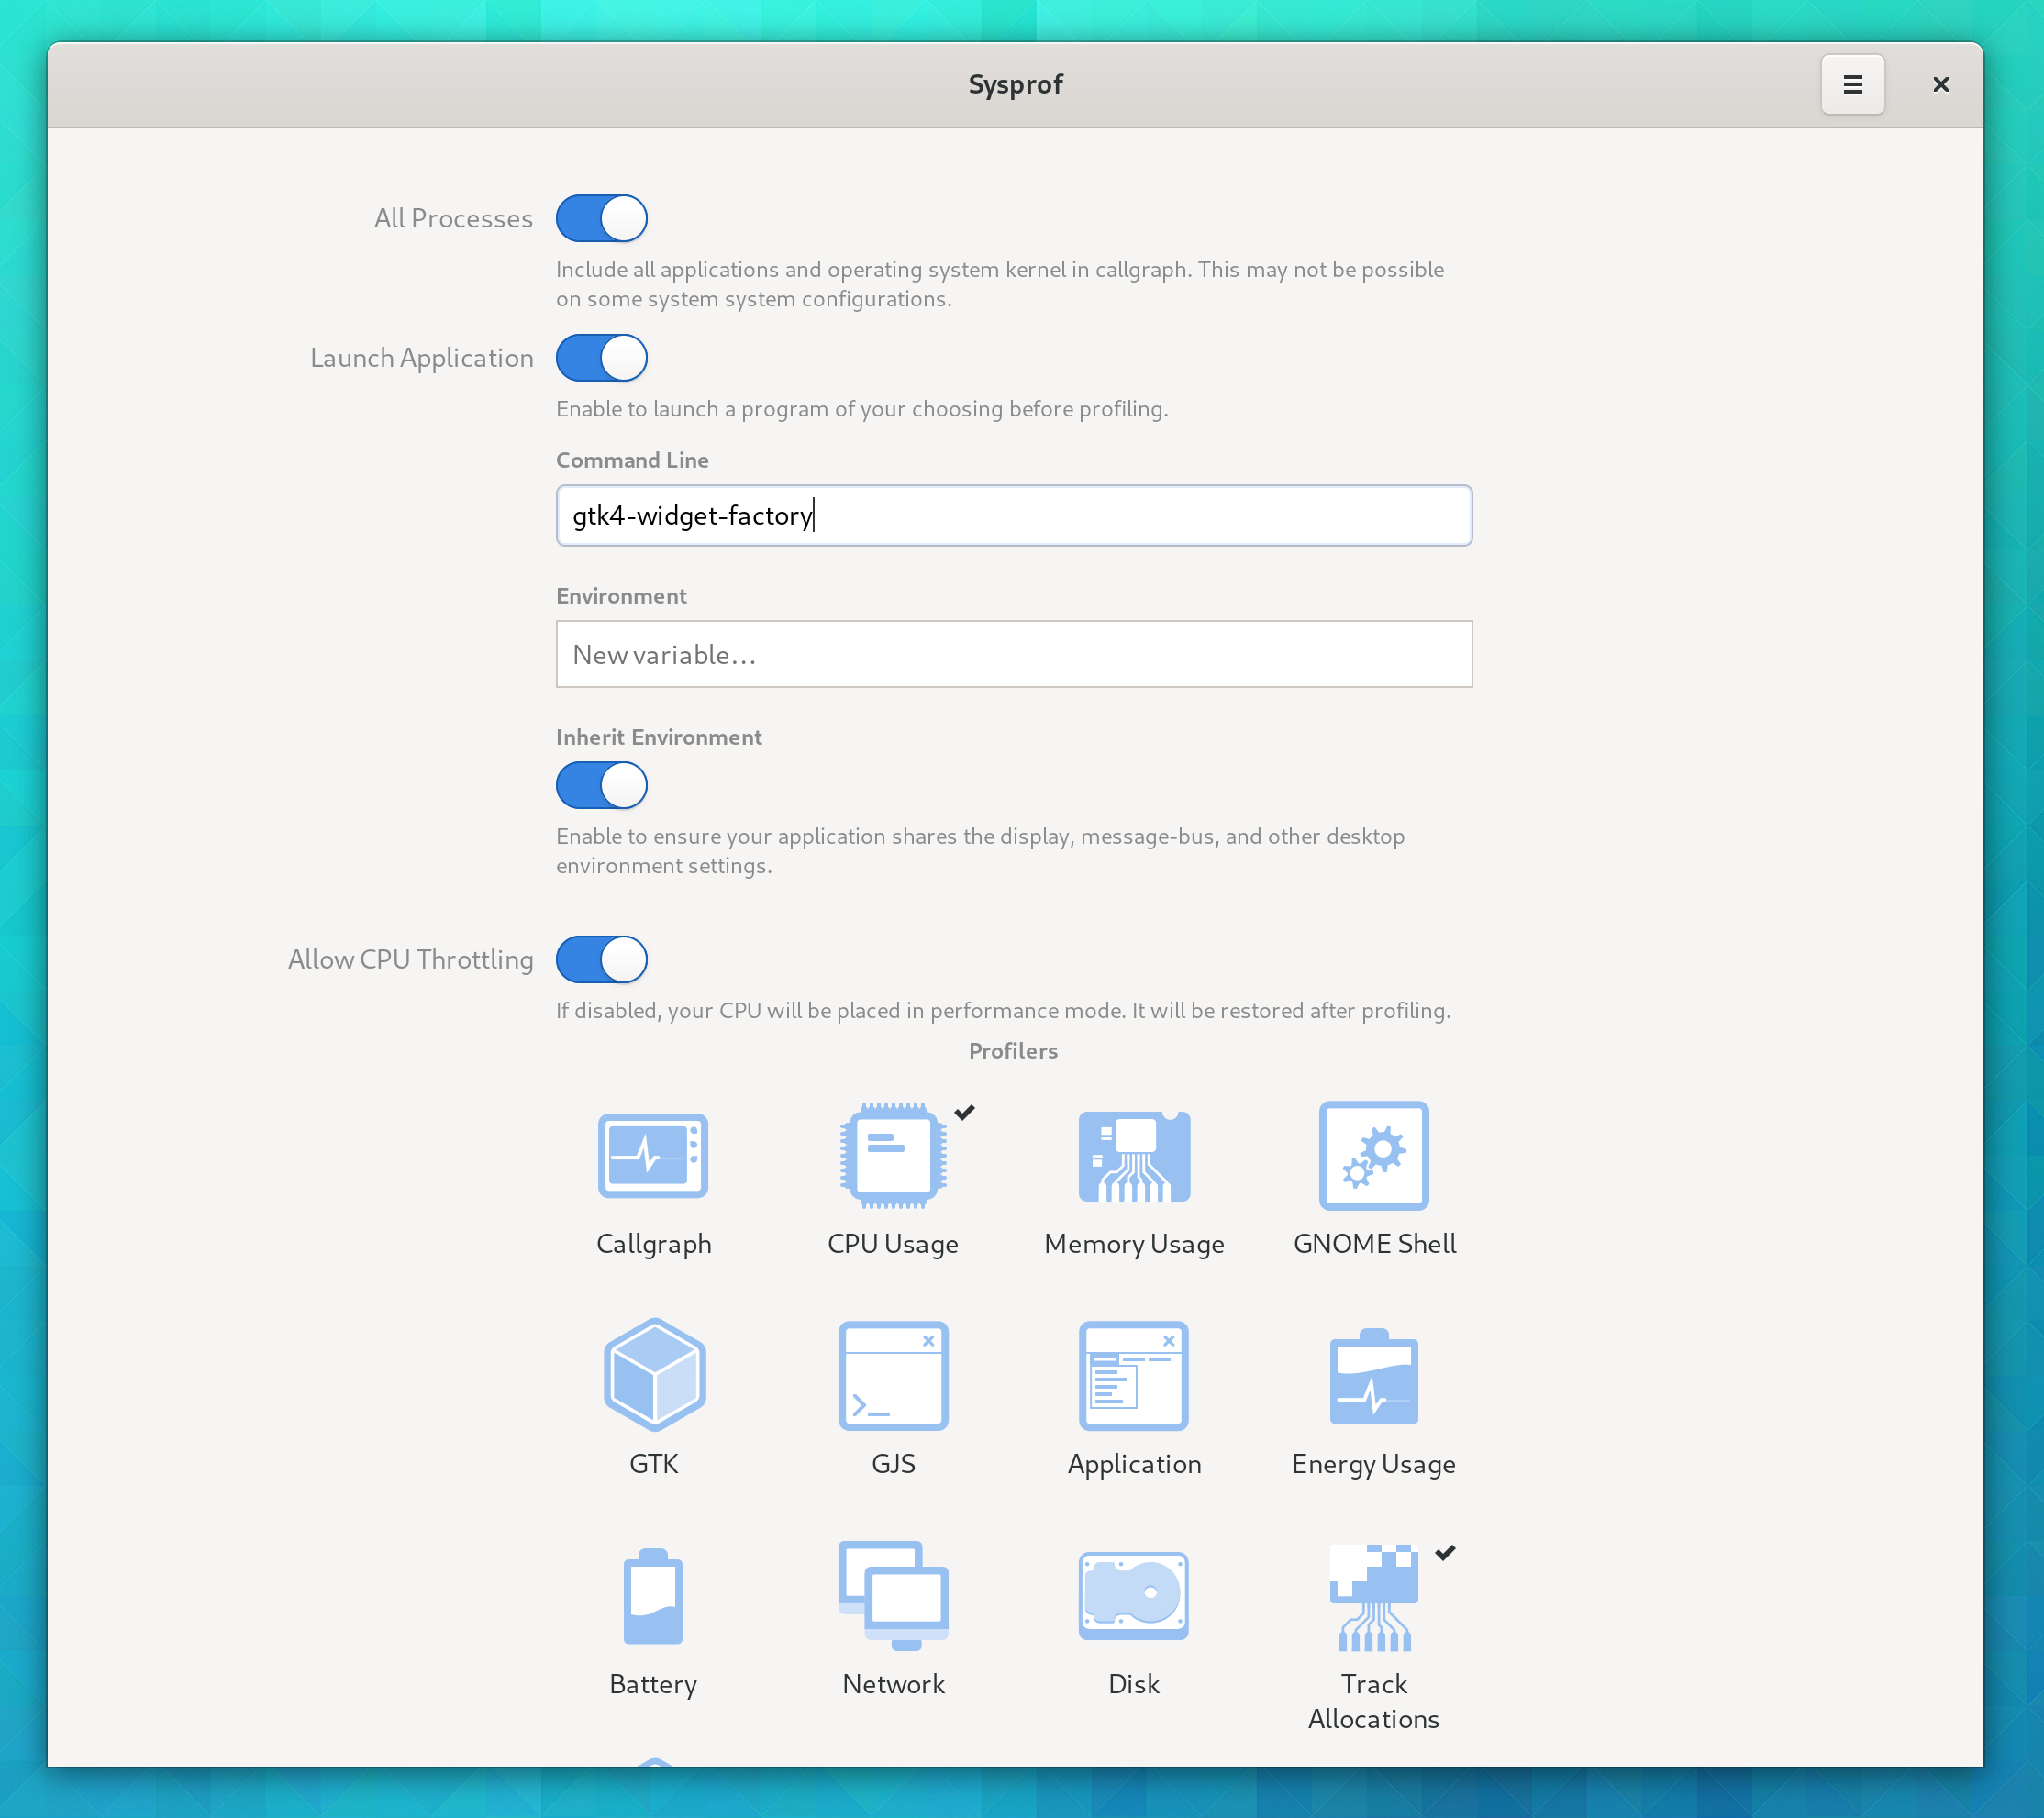
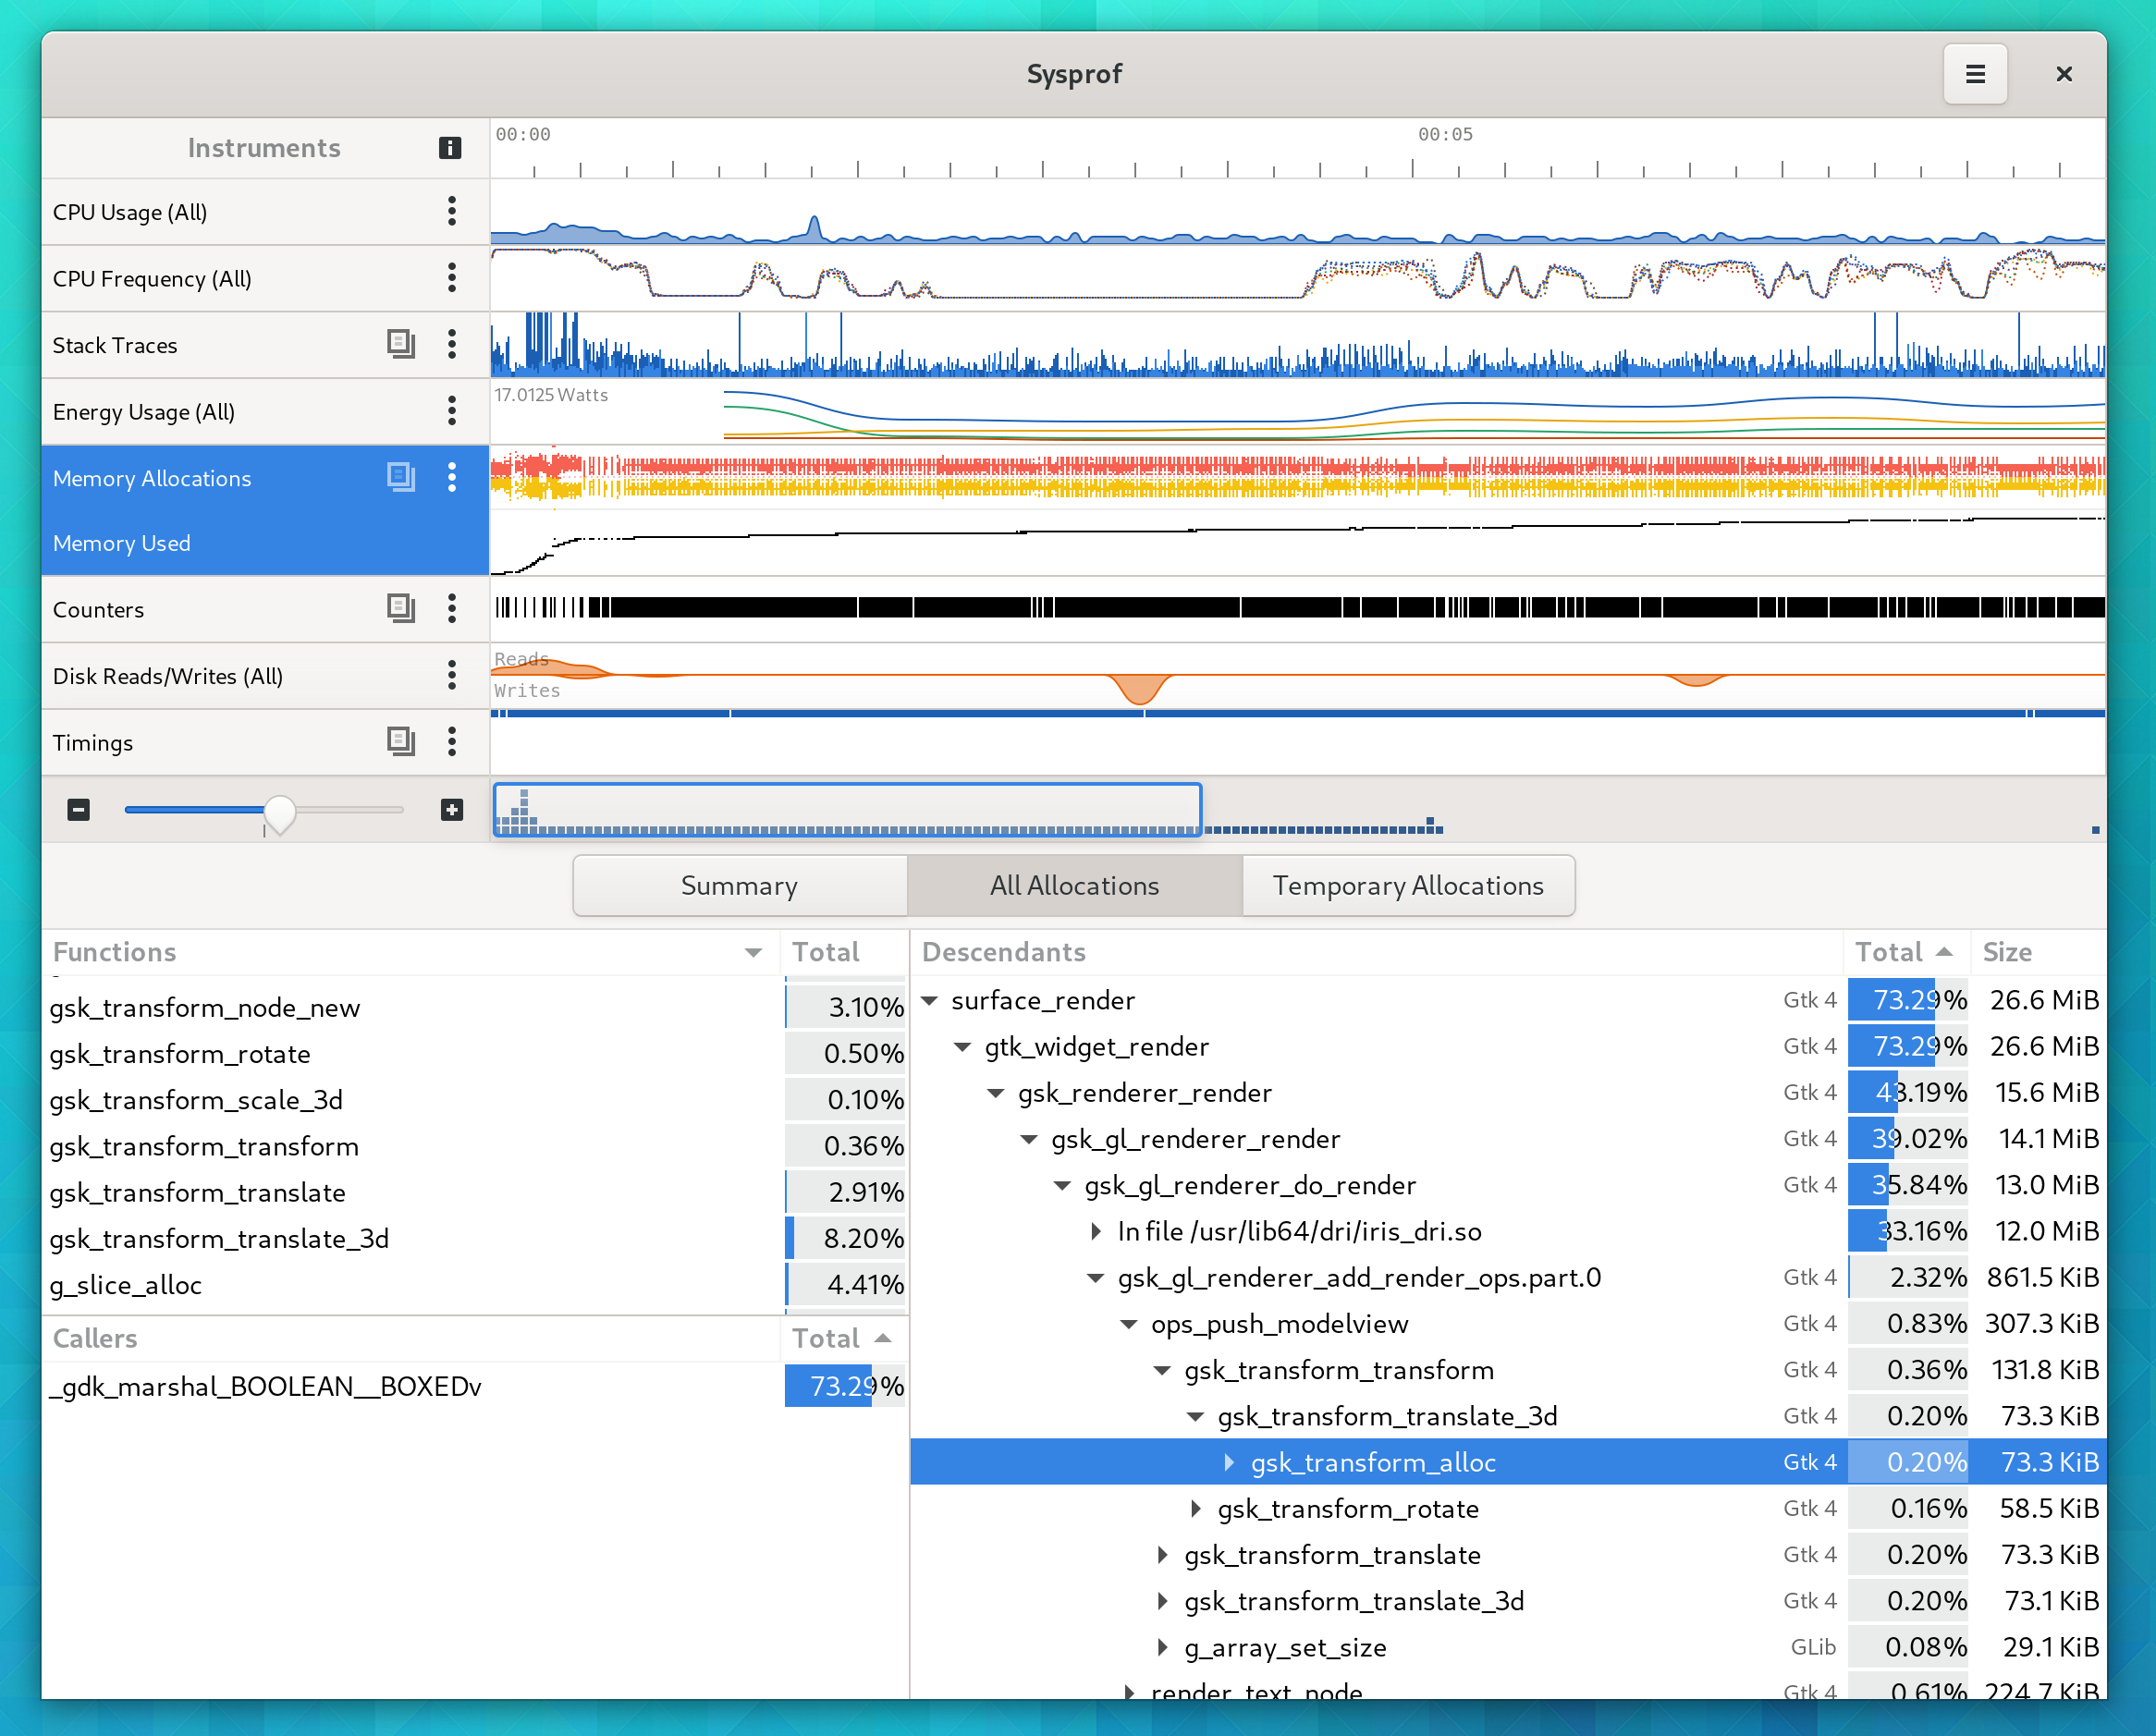
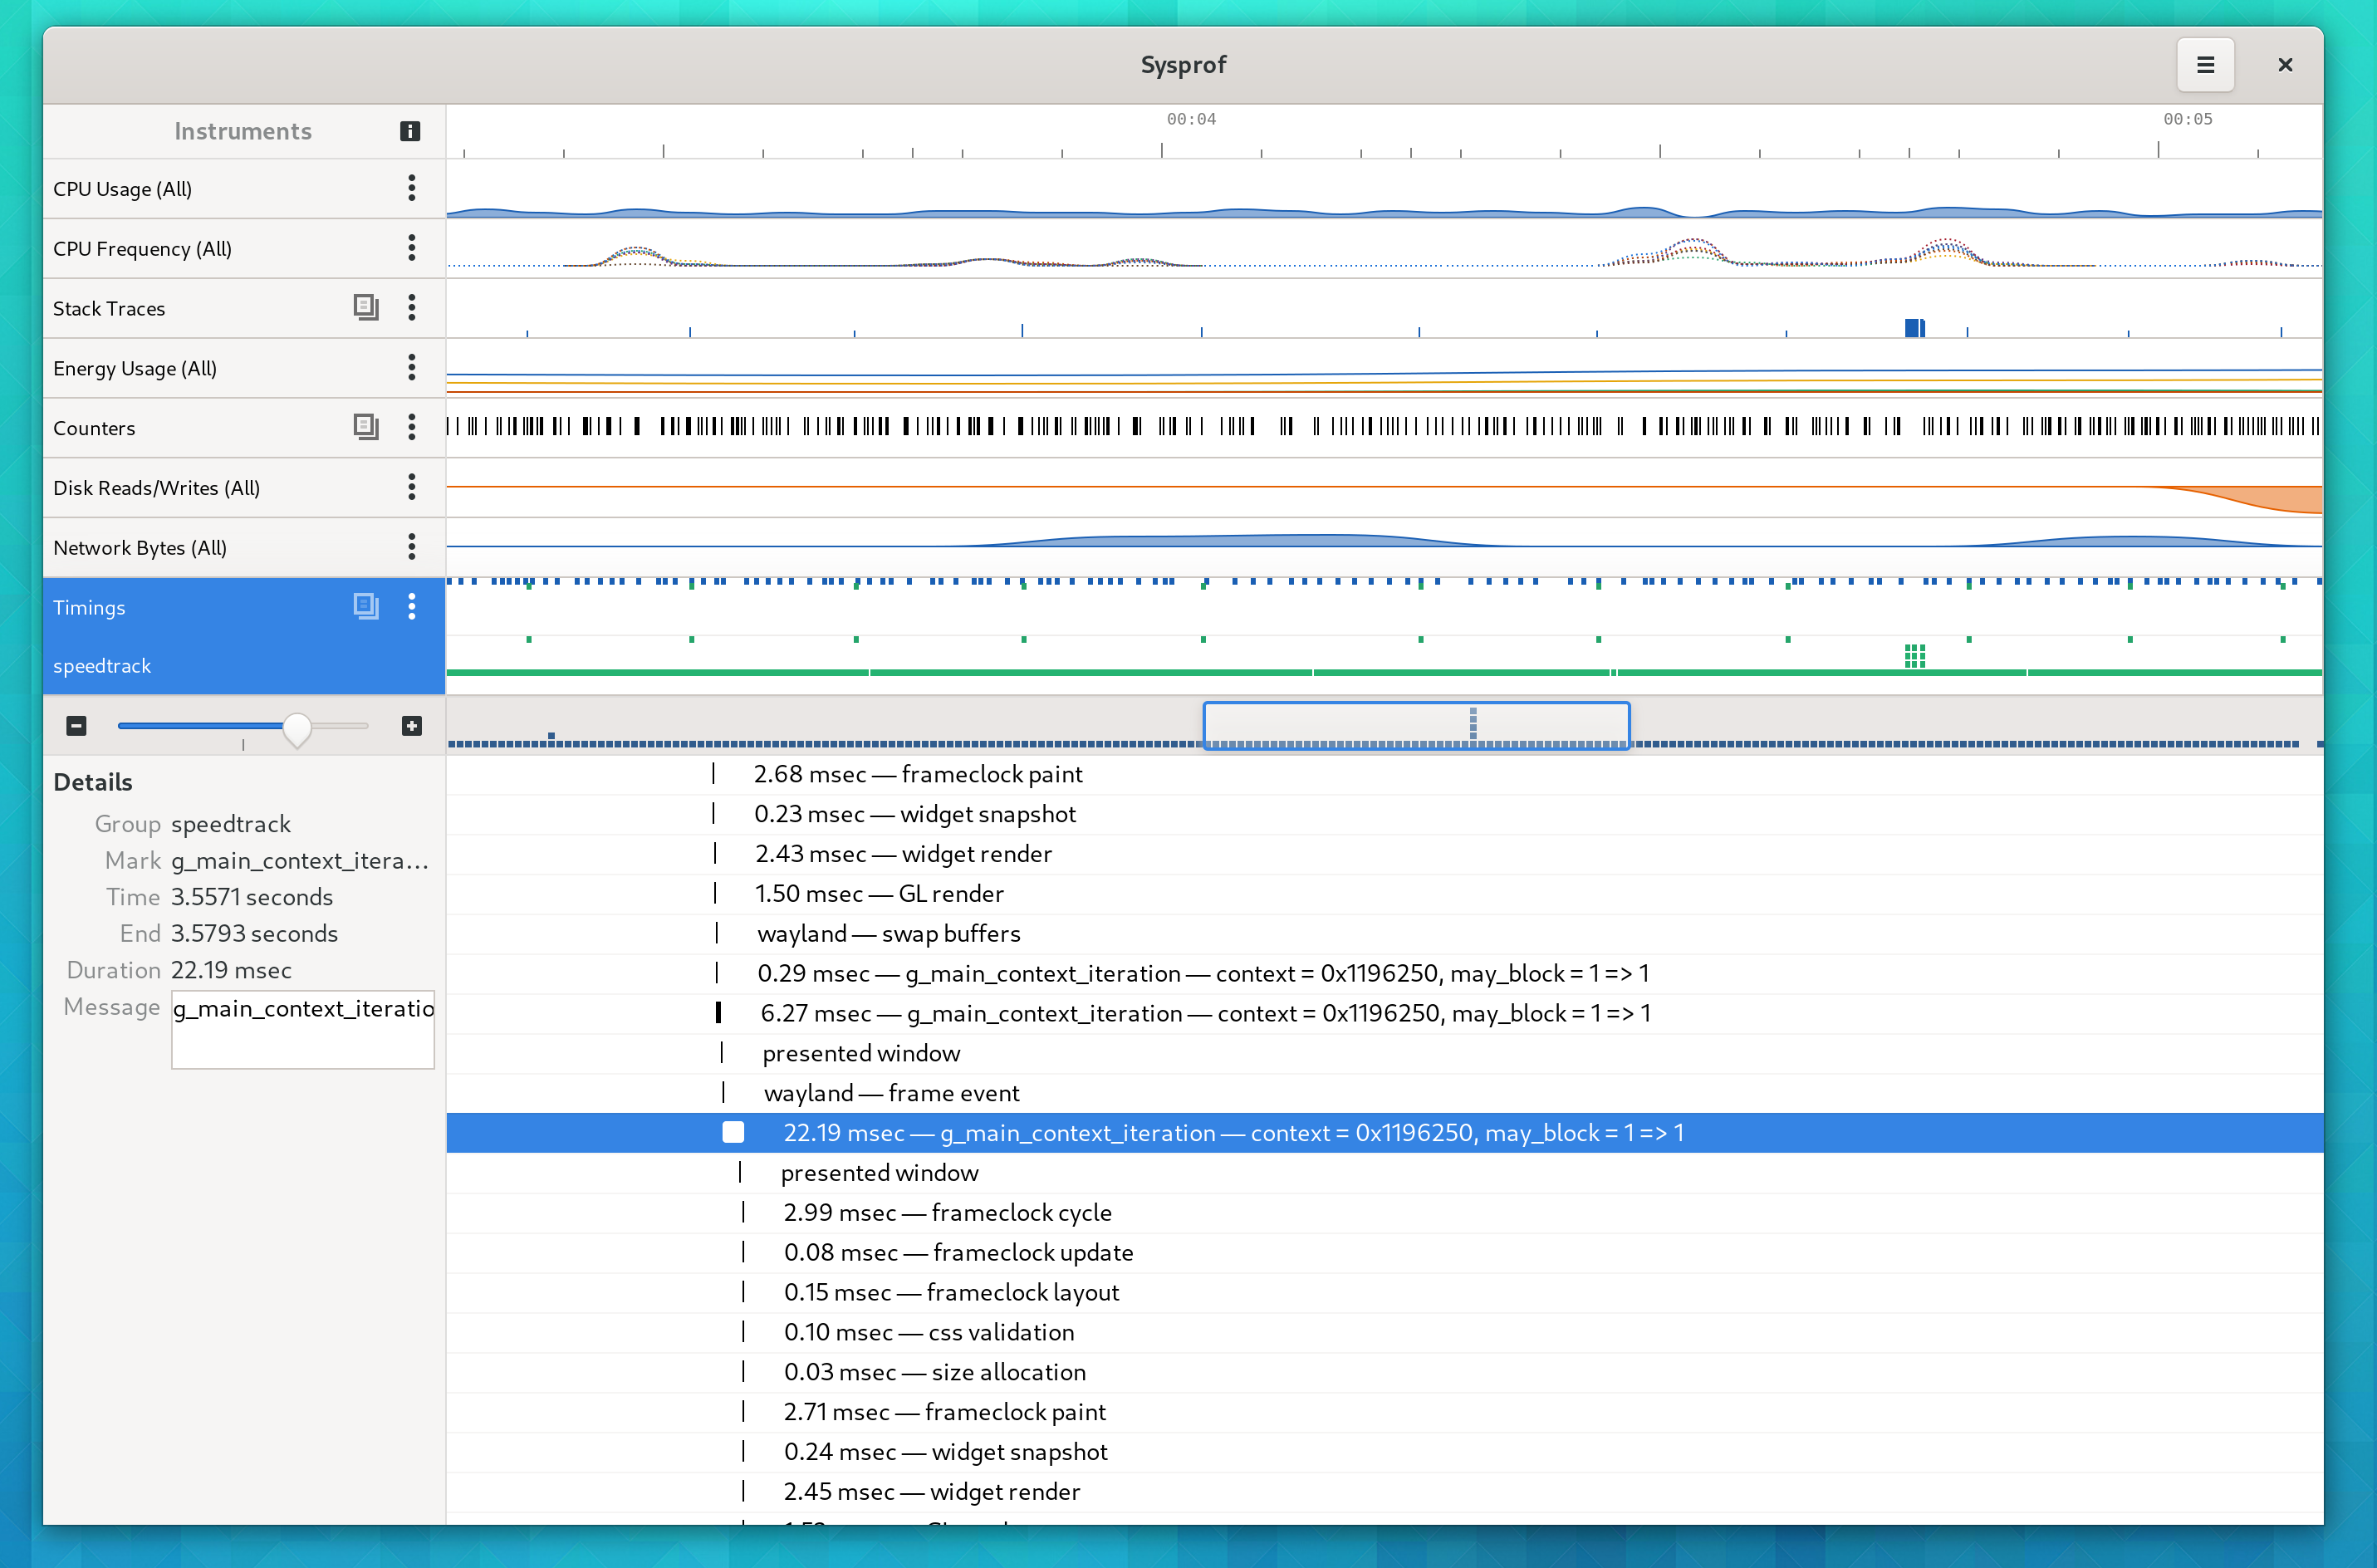
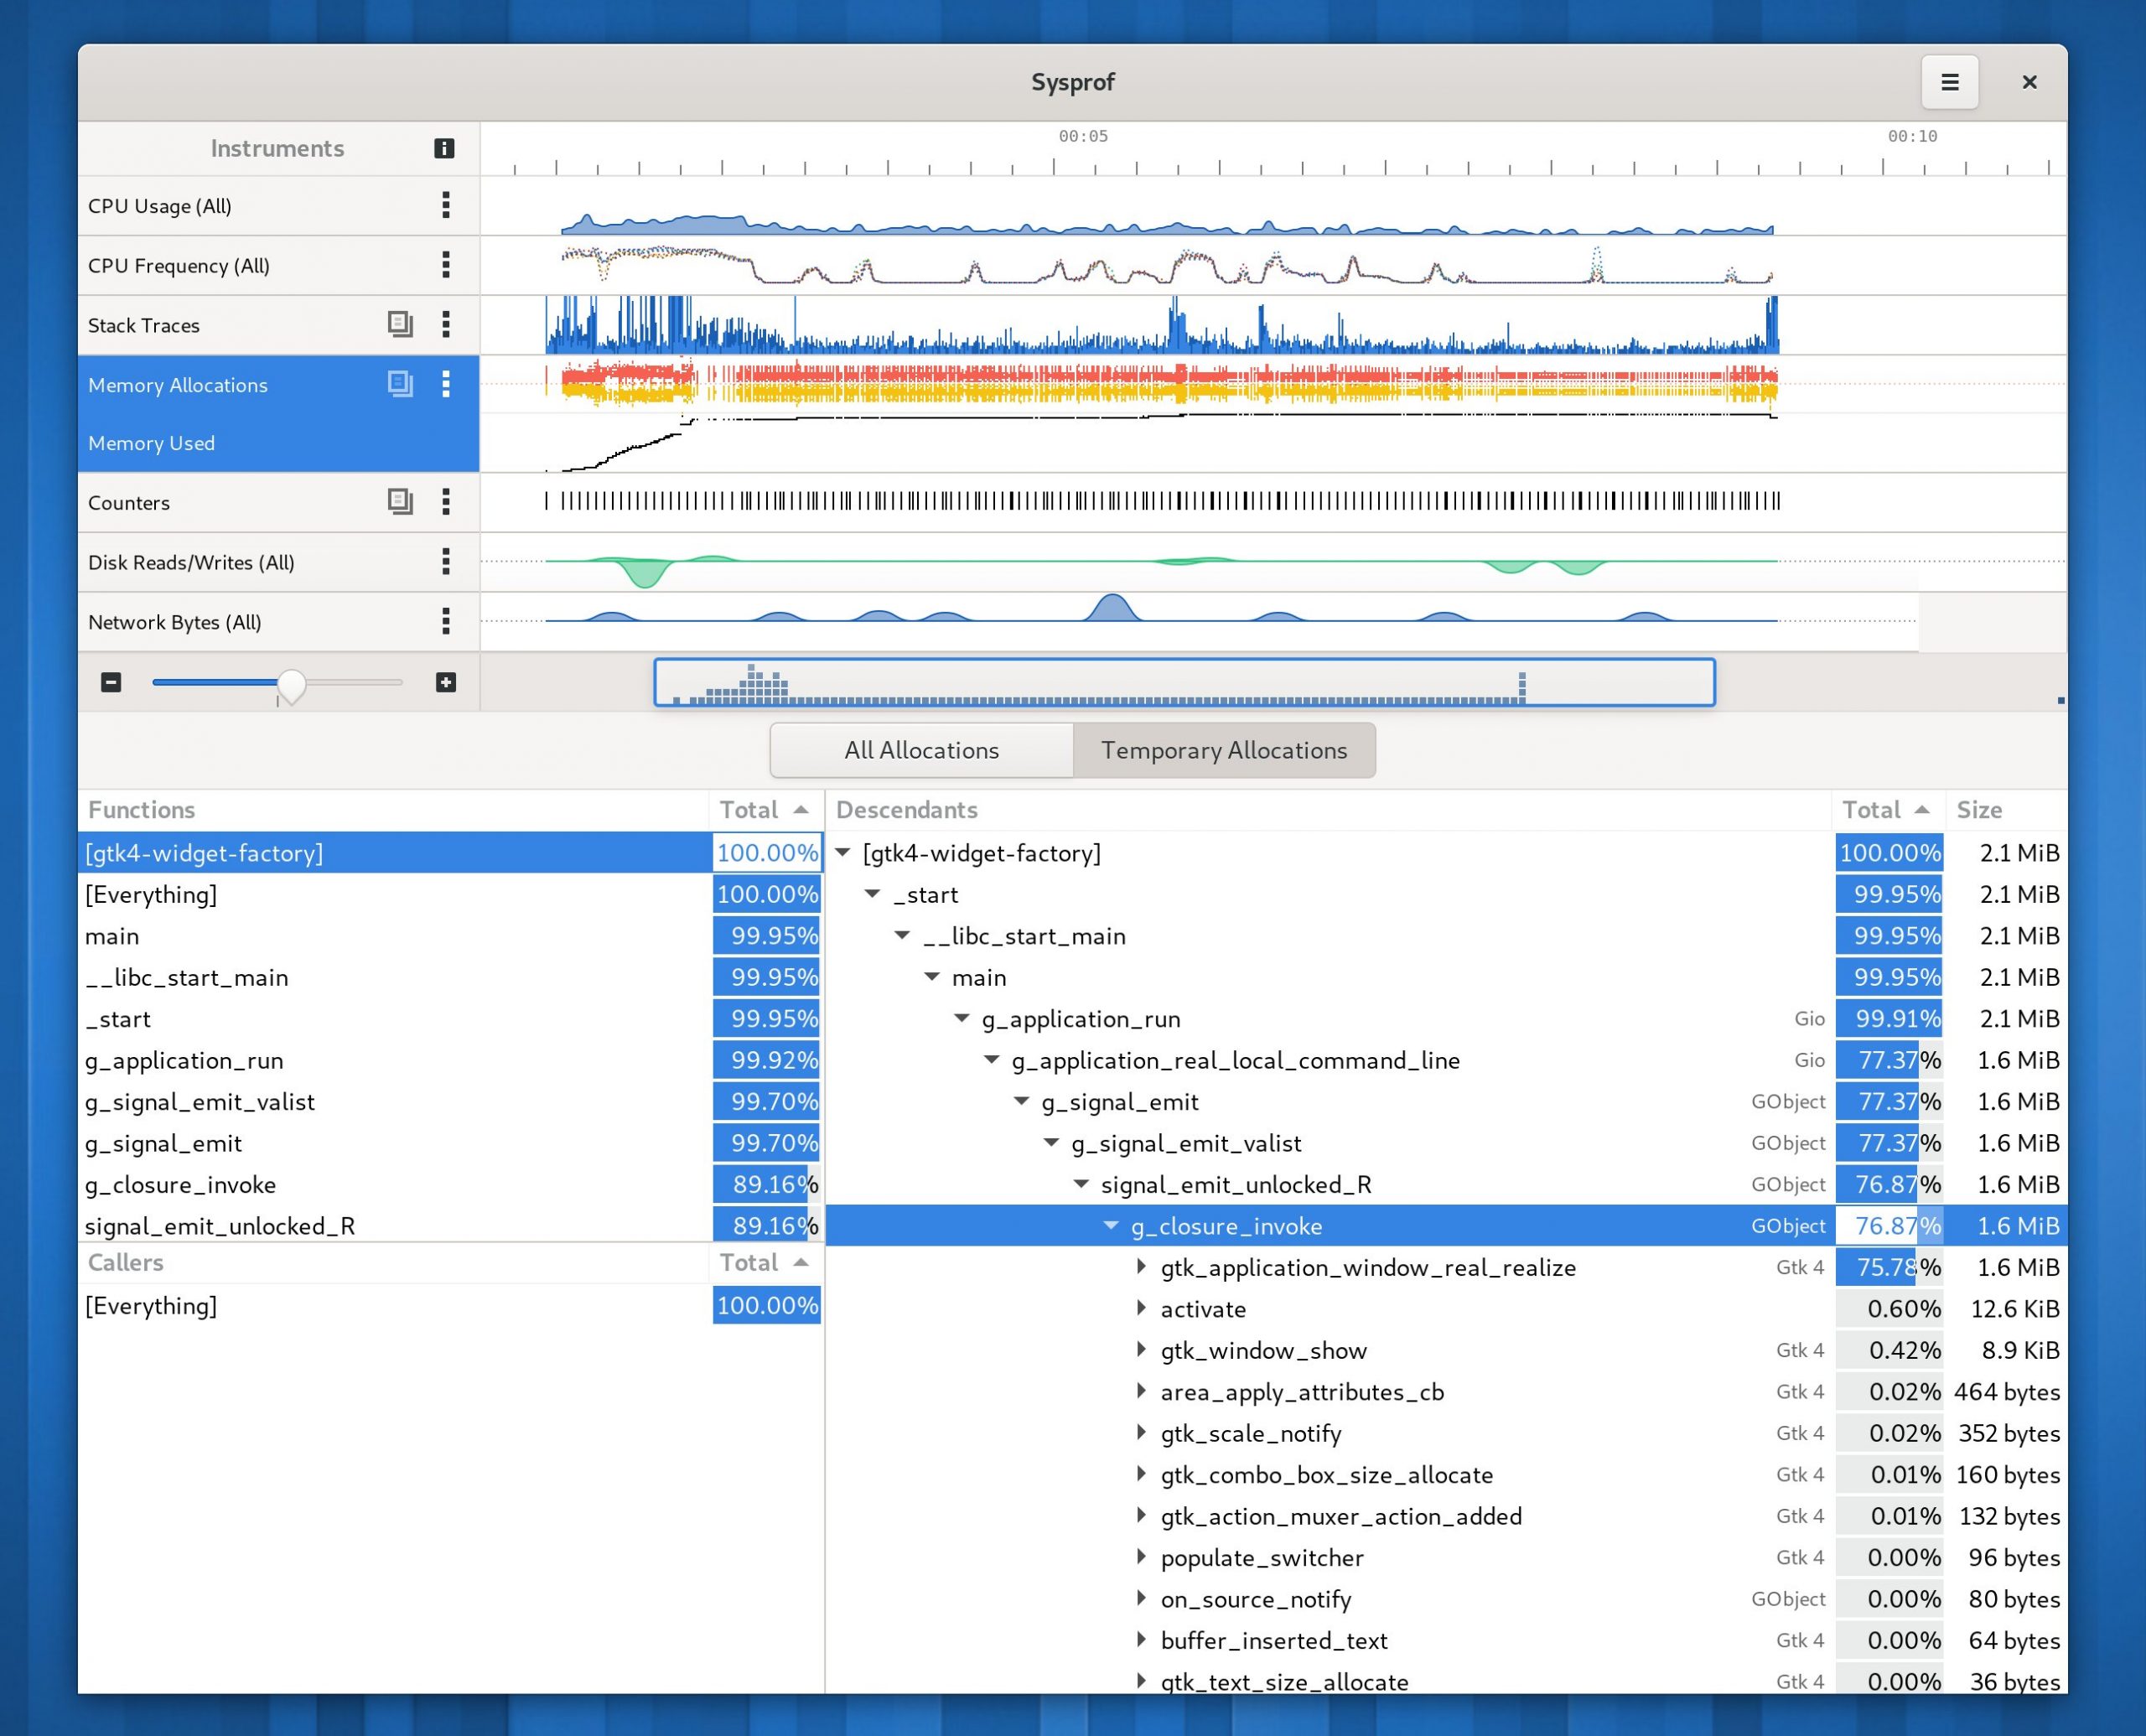
Sysprof Support
GtkSourceView now uses the Sysprof collector API just like GTK 4 does (among many other GNOME projects). This means you can get profiling information about renderings right in the Sysprof visualizer along other data.
Future Work
PCRE2
With GRegex on the chopping block for deprecation, it’s time to start moving to PCRE2 much like VTE did. Doing so will not only make us more deprecation safe, but ensure that we can actually use the JIT feature of the regex engine. With how much regexes are used by the highligting engine, this should be a fairly sizable improvement.
This has now been implemented.
Hover Providers
In GNOME Builder, we added an abstraction for “Hover Providers”. This is also a thing in the Language Server Protocol realm. Nothing exists upstream in GtkSourceView for this and that should probably change. Otherwise all the trickyness in making transient popovers work is put on application authors.
Style Schemes
I would like to remove or revamp some of our default style schemes. They do not handle the world of dyanmic GTK themes so well and become a constant source of bug reports by applications that want a “one size fits all” style scheme. I’m not sure yet on the complete right answer long term here, but my expectation is that we’d want to move toward a default style scheme that is mostly font changes rather than color changes which eventually fall apart on the more … interesting themes.
Anyway, that’s all for now!